Looker for OBIEE Experts: Introduction and Concepts
Looker for OBIEE Expert, and Introduction describing Looker concepts with the eyes of an OBIEE Expert.

Recently I've been doing some personal study around various areas including streaming, machine learning and data visualization and one of the tools that got my attention is Looker. I've initially heard about Looker from a Drill to Detail podcast and increasingly been hearing about it in conferences and use cases together with other cloud solutions like BigQuery, Snowflake and Fivetran.
I decided to give it a try myself and, since most of my career was based on Oracle Business Intelligence (OBI) writing down a comparison between the tools that could help others sharing my experience getting introduced to Looker.
OBIEE's Golden Feature: The Semantic Model
As you probably know if you have been working with OBIEE for some time the centrepiece of its architecture is the Semantic Model contained in the Repository (RPD)
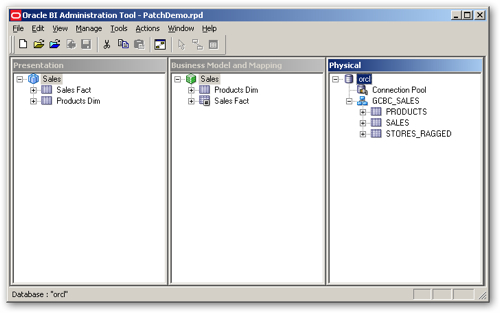
In the three layers of the RPD, we model our source data (e.g. database tables) into attributes, metrics, hierarchies which can then be easily dragged and dropped by the end-user in the analysis or data visualization.
I called the RPD "OBIEE's Golden Feature" because to me it's the main benefit of the platform: abstracting the data complexity from end-users and, at the same time, optimizing the query definition to take care of all the features that could be set in the datasource. The importance of the RPD is also its centrality: within the traditional OBIEE all Analysis and Dashboard had to be based on Subject Areas exposed by the RPD meaning that the definition of the metrics was done in a unique place in a consistent manner and then spread across all the reporting providing the unique source of truth for the important KPIs in the company typical of what Gartner calls the Mode 1 Analytics.
RPD Development Speed Limitation and Mode 2 Analytics
The RPD is a centralized binary object within the OBIEE infrastructure: in order to develop and test a full OBIEE instance is required, and the merges between different streams are natively performed via the RPD's admin tool.
This complexity unified to the deep knowledge required to correctly build a valid semantic model limits the number of people being able to create and publish new content thus slowing down the process from data to insights typical of the centralized Mode 1 Analytic platform provided centrally by IT teams. Moreover, RPD development is entirely point-and-click within the admintool which is somehow considered slow and old fashion in a world of scripting, code versioning and git merging. Several solutions are out in the market (including Rittman Mead Developer Toolkit) to enhance the agility of the development but still, the skills and the toolset required to develop new content makes it a purely IT manageable solution.
In order to overcome this limitation several tools like Tableau, QlikView or Oracle's Data Visualization (included in OAC or in the Desktop version) give all the power in the ends of the end-user: from data-sources to graphing, the tools allow an end-to-end data discovery to visualization journey. The problem with those tools (called Mode 2 Analytics by Gartner) is that there is no central definition of the KPI since it's demanded to every analyst. All those tools are addressing the problem by providing some sort of datasource certification allowing a datasource to be visible and reusable publicly only when it's validated centrally. Again, for most of those tools, the modelling is done in a visual format, which makes it difficult to debug, version control and automate. I've been speaking about this subject in my presentation "DevOps and OBIEE do it before it's too late".
What if we could provide the same centralized source of truth data modelling with an easily scriptable syntax that can be developed from business users without any deep knowledge of SQL or source tables? Well, what we just described is LookML!
LookML
LookerML takes the best part of OBIEE: the idea of a modelling layer and democratizes it in order to be available to all business user with a simple language and set of concepts. Moreover, the code versioning is embedded in the tool, so there's no need to teach git branch, commit, push or pull to non-IT people.
So, what are the concepts behing LookerML and how can you get familiar with it when comparing it to the medatada modelling in the RPD?
LookML Concepts
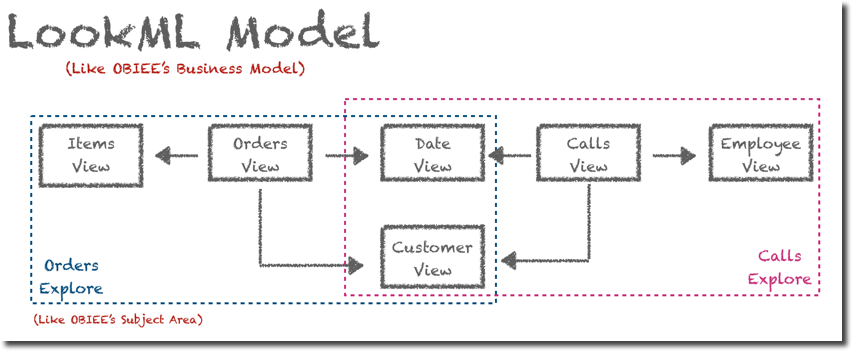
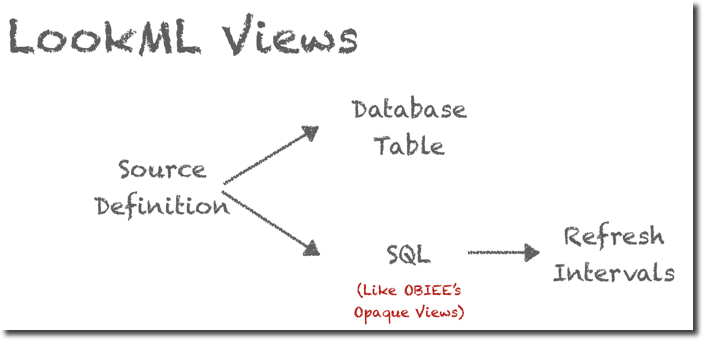
Let's start from the basic of the RPD modelling: a database table. In LookerML each table is represented by an object called View (naming is a bit confusing). Moreover, LookerML's Views can be used not only to map existing database tables but also to create new tables based on existing content and a SQL definition, like the opaque views in OBIEE. On top of this LookML allows the phisicalization of those objects (into a table) and the definition of a schedule for the refresh. This concept is very useful when aggregates are needed, the aggregate definition (SQL) is defined within the LookML View together with the related refresh schedule.
The View itself defines only the source, a bit like the RPD's physical layer, the next step is defining how multiple Views interact within each other, or, in OBIEE terms, the Business Layer. In LookML there is an entity called Explores and is the place where we can define which Views we want to group together, and what's the linkage between them. Multiple Explores are defined in a Model, which should be unique per database. So, in OBIEE words, a Model can be compared to a Business Model with Explores being a subset of Facts and Dimensions grouped in a Subject Area.

Ok, all "easy" so far, but where do we map the columns? and where do we set the aggregations? As you might expect both are mapped within a LookML View into Fields. Fields is a generic term which includes in both metrics and attributes, LookML naming is the below:
- Dimension: in OBIEE's terms attributes of a dimension. The terminology is confusing since in LookML the Dimension is the column itself while in OBIEE terms is the table. A Dimension can be a column value or a combination of multiple values (like OBIEE's BM Logical Sources formulas). A Dimension in LookML can't have any aggregation (as in OBIEE).
- Measures: in OBIEE's terms a metric. The definition includes, the source formula in SQL syntax, the type of aggregation (min/max/count...) and the drill fields.
- Filters: this is not something usually defined in OBIEE's RPD, filters are a way of passing a user choice based on a column value back to an RPD calculation formula, a bit like, for the OBIEE experts, overriding session variables with dashboard prompt values.
- Parameters: again this is not something usually defined in OBIEE's RPD, you can think a Parameter as a way of setting up variables function. E.g. a Parameter with values SUM, AVG, MIN, MAX could be used to change how a certain Measure is aggregated
All good so far? Stick with me and in the future we'll explore more about LookML syntax and Looker in general!