Kafka | IoT Ecosystem ::Cluster; Performance Metrics; Sensorboards & OBD-II::
Infrastructure is the place to start and the keyword here is scalability. Whether it needs to run on premise, on cloud or both, Kafka makes it possible to scale at low complexity cost when more brokers are either required or made redundant. It is also equally easy to deploy nodes and nest them in different networks and geographical locations. As for IoT devices, whether it’s a taxi company, a haulage fleet, a racing team or just a personal car, Kafka can make use of the existing vehicle OBDII port using the same process; whether it’s a recording studio or a server room packed with sensitive electronic equipment and where climate control is critical, sensorboards can be quickly deployed and stream almost immediately into the same Kafka ecosystem. Essentially, pretty much anything that can generate data and touch python will be able to join this ecosystem.
In large data centres it is fundamental to keep a close eye on misbehaving nodes, possibly overheating, constantly failing jobs or causing unexpected issues. Fires can occur too. This is quite a challenge with thousands and thousands of nodes. Though, Kafka allows for all of the node stats to individually stream in real time and get picked up by any database or machine, using Kafka Connect or kafka-python for consumption.
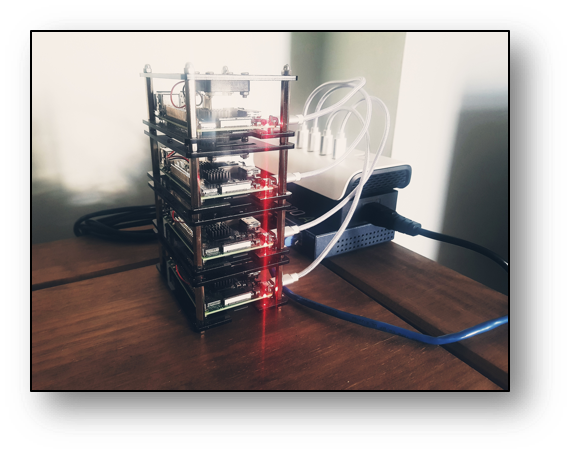
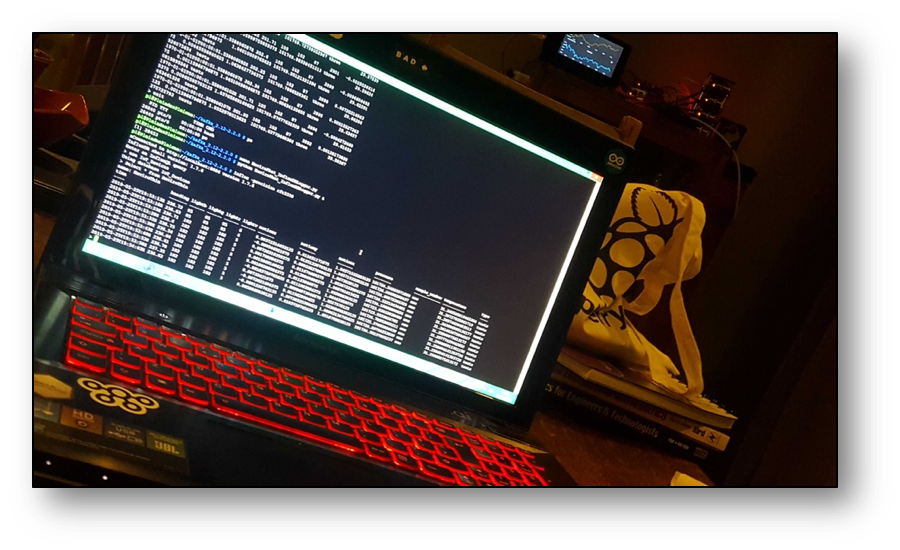
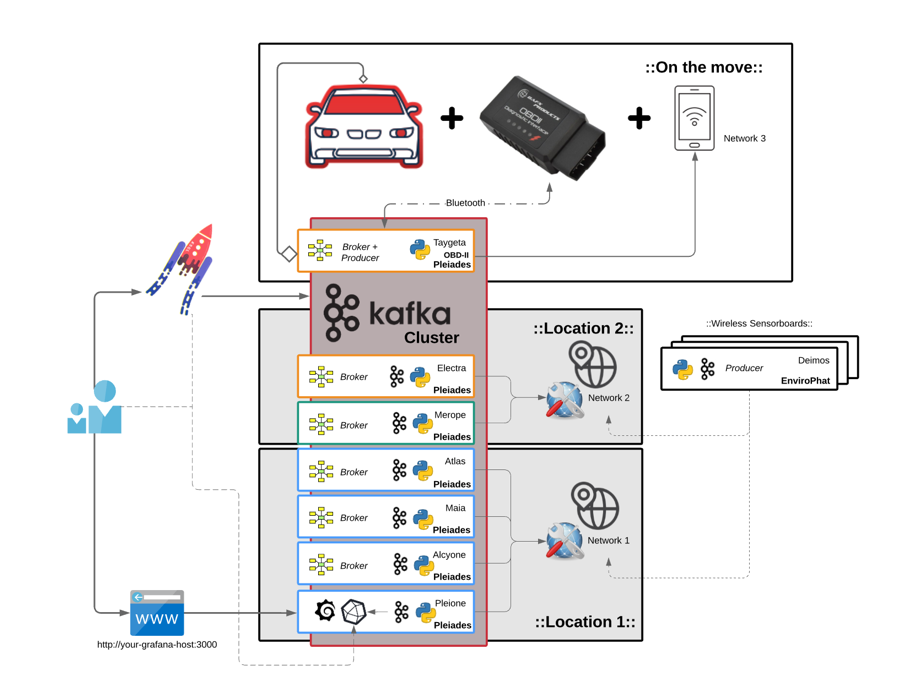
To demonstrate this on a smaller scale with a RaspberryPi 3 B+ cluster and test a humble variety of different conditions, a cluster of 7 nodes, Pleiades, was set up. Then, to make it easier to identify them, each computer was named after the respective stars of the Pleiades constellation.
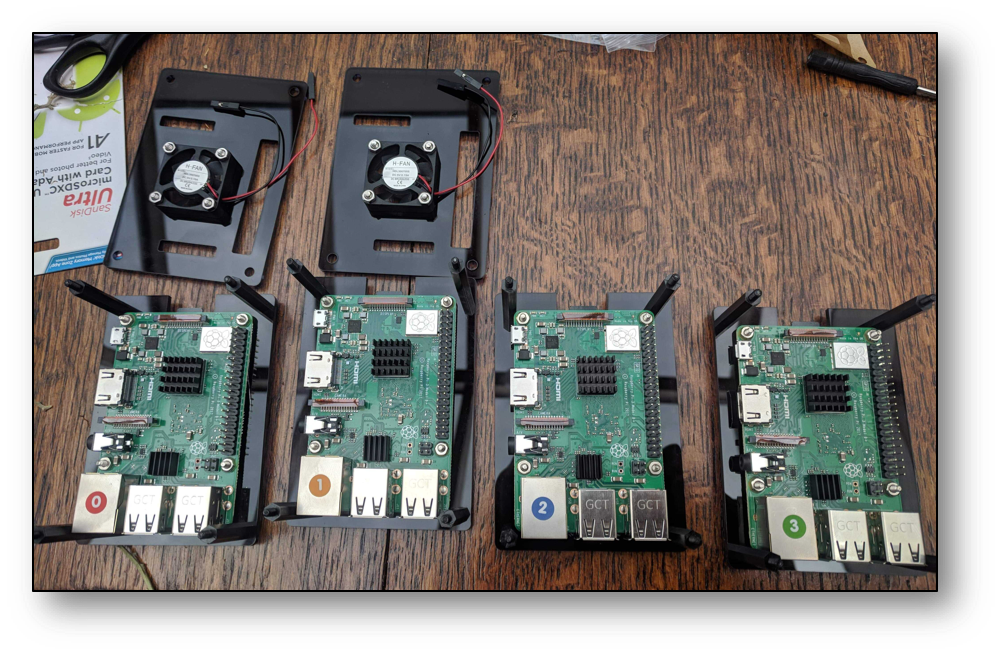
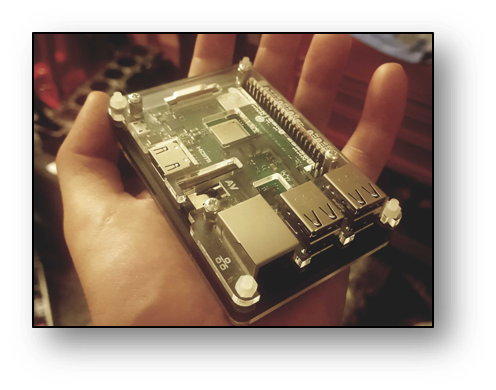
- 4 nodes {Alcyone; Atlas; Pleione; Maia} in a stack with cooling fans and heatsinks
- 1 node in metal case with heatsink {Merope}
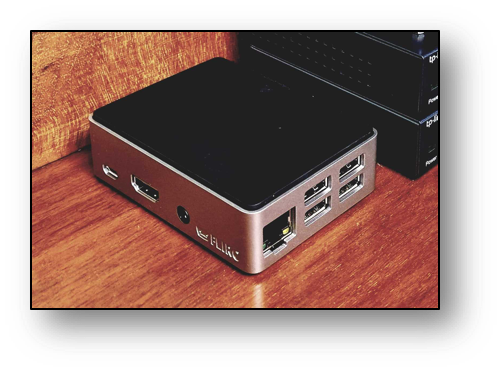
- 1 node in plastic case {Taygeta}
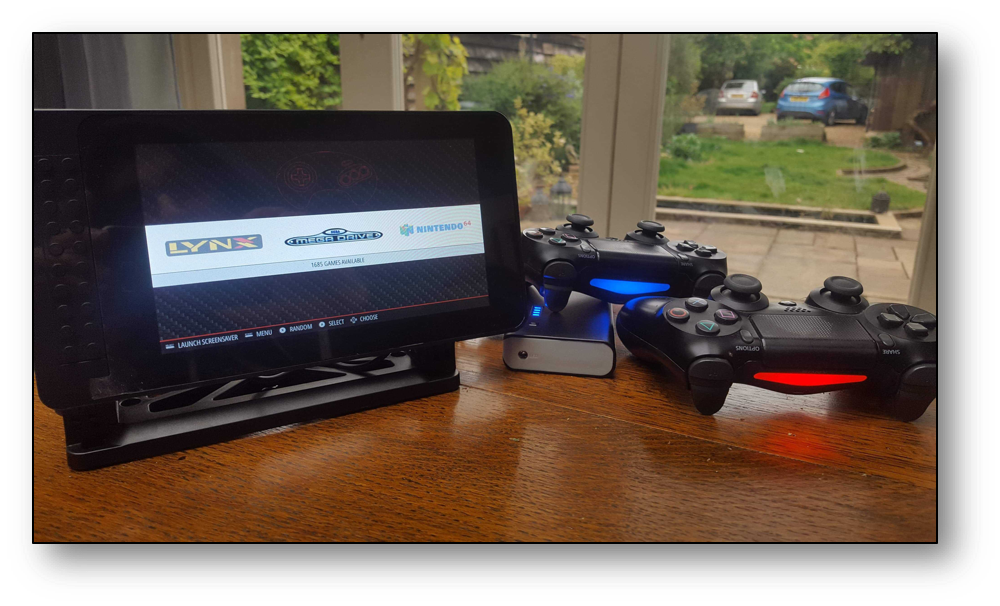
- 1 node in touchscreen plastic case {Electra}
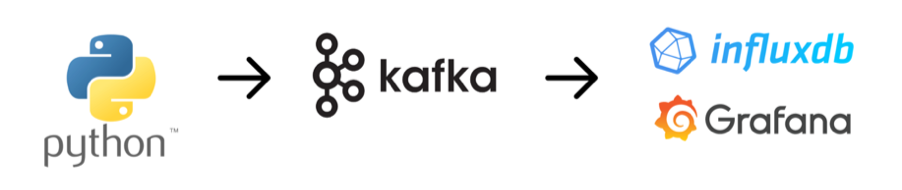
Every single node has been equipped with the same python Kafka-producer script, from which the stream is updated every second in real-time under 1 topic, Pleiades. Measures taken include CPU-Percentage-%, CPU-Temperature, Total-Free-Memory, Available-System-Memory, CPU-Current-Hz.
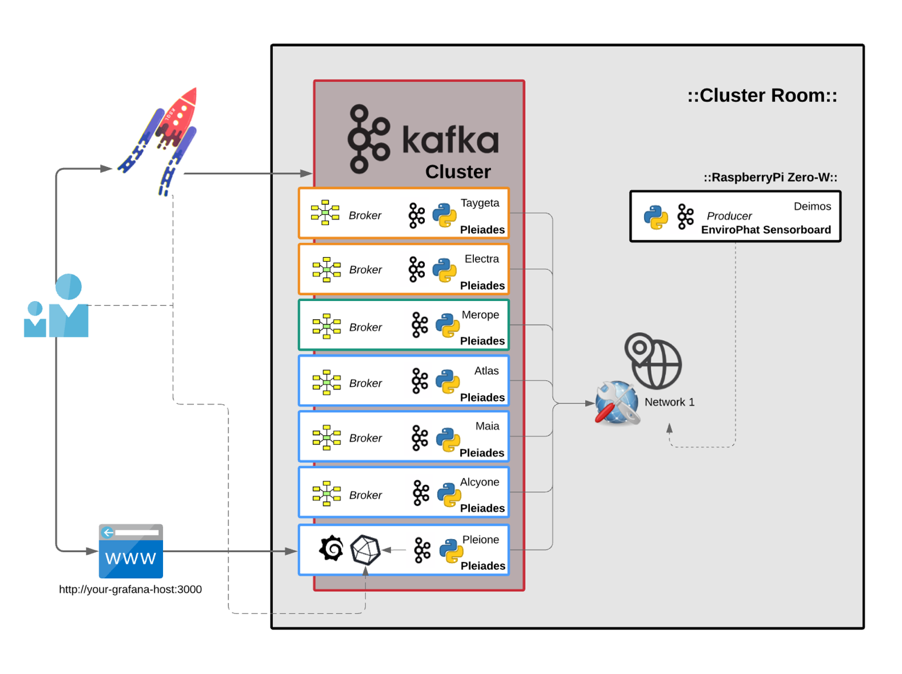
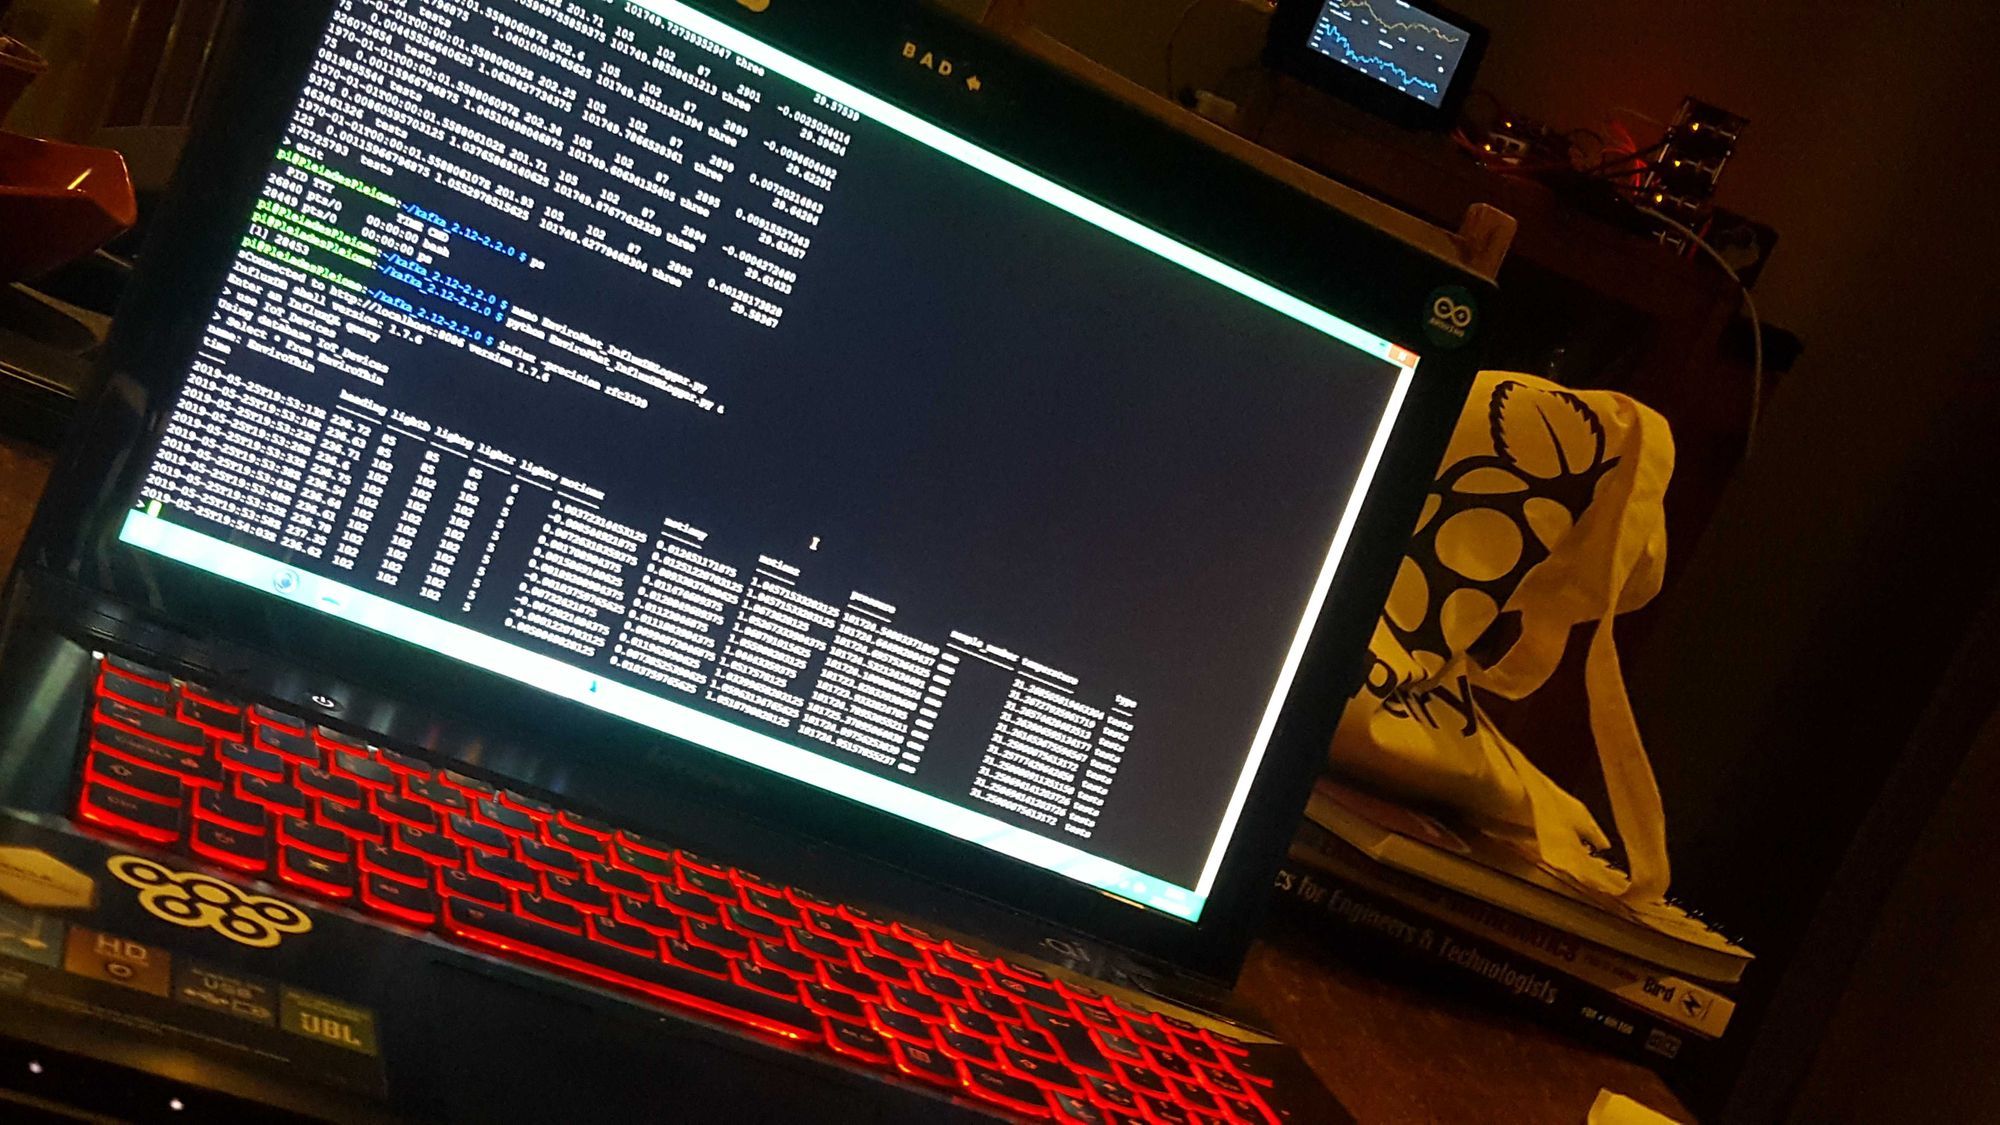
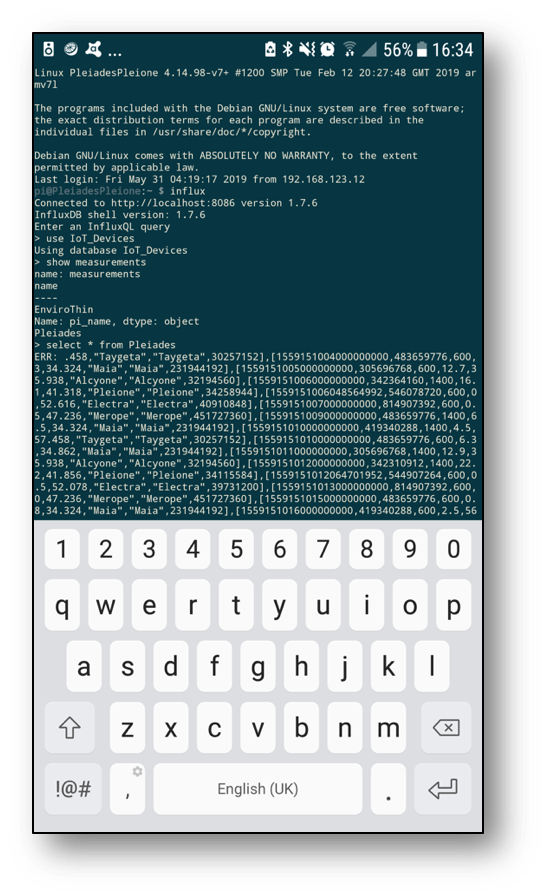
Kafka then connects to InfluxDB on Pleione, which can be queried using the terminal through a desktop or android SSH client. Nothing to worry about in terms of duplication, load balancing or gaps in the data. Worst case scenario InfluxDB, for example, crashes and the data will still be retrievable using KSQL to rebuild gap in DB depending on the retention policy set.
We can query InfluxDB directly from the command line. The Measure (InfluxDB table) for Pleiades is looking good and holding plenty of data for us to see in Grafana next.
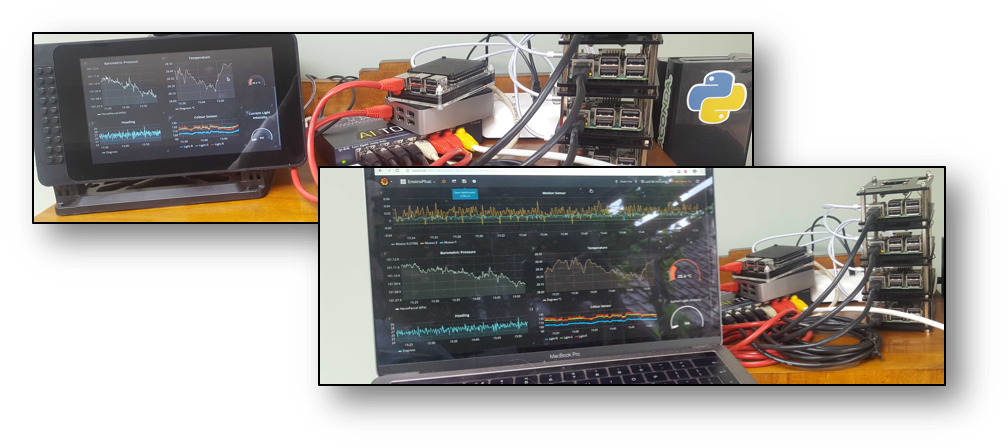
A live feed is then delivered with Grafana dashboards. It's worth noting how mobile friendly these dashboards really are.
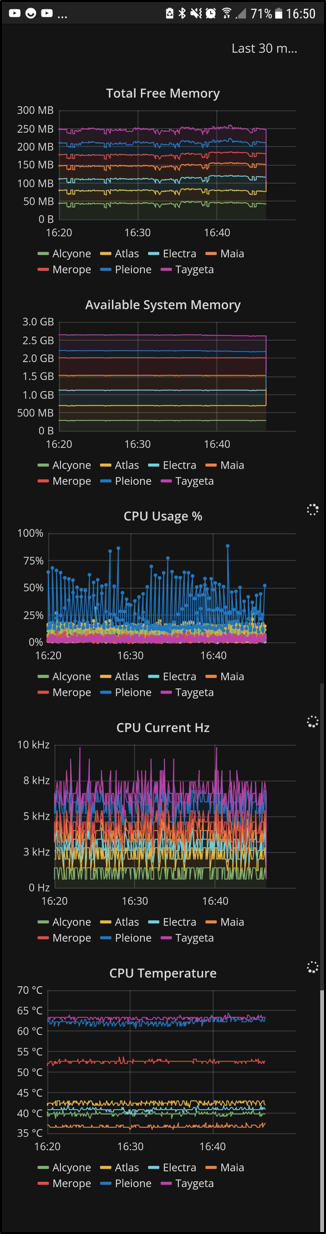
At a glance, we know the critical factors such as how much available memory there is and how much processing power is being used, for the whole cluster as well as each individual node, in real time and anywhere in the world (with an internet connection).
It has then been observed that the nodes in the stack remain fairly cool and stable between 37 °C and 43 °C, whereas the nodes in plastic cases around 63 °C. Merope is in the metal casing with a heatsink, so it makes sense to see it right in the middle there at 52 °C. Spikes in temperature and CPU usage are directly linked to running processes. These spikes are followed by software crashes. Moving some of the processes from the plastic enclosures over to the stack nodes stopped Grafana from choking; this was a recurring issue when connecting to the dashboards from an external network. Kafka made it possible to track the problem in real time and allow us to come up with a solution much quicker and effortlessly; and then immediately also track if that solution was the correct approach. In the end, the SD cards between Electra and Pleione were quickly swapped, effectively moving Pleione to the fan cooled stack where it was much happier living.
If too many spikes begin to occur, we should expect for nodes to soon need maintenance, repair or replacement. KSQL makes it possible to tap into the Kafka Streams and join to DW stored data to forecast these events with increased precision and notification time. It's machine-learning heaven as a platform. KSQL also makes it possible to join 2 streams together and thus create a brand new stream, so to add external environment metrics and see how they may affect our cluster metrics, a sensor board on a RaspberryPi Zero-W was setup producing data into our Kafka ecosystem too.
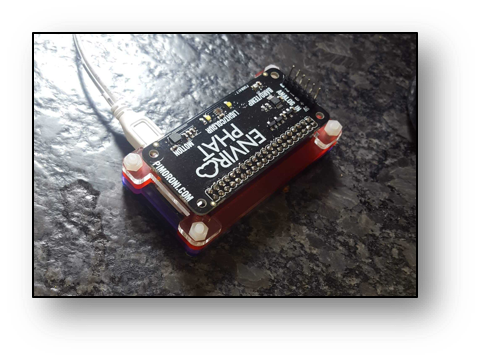
To keep track of the room conditions where the cluster sits, an EnviroPhat sensor board is being used. It measures temperature, pressure, colour and motion. There are many available sensorboards for SBCs like RaspberryPi that can just as easily be added to this Kafka ecosystem. Again, important to emphasize both data streams and dashboards can be accessed from anywhere with an internet connection.
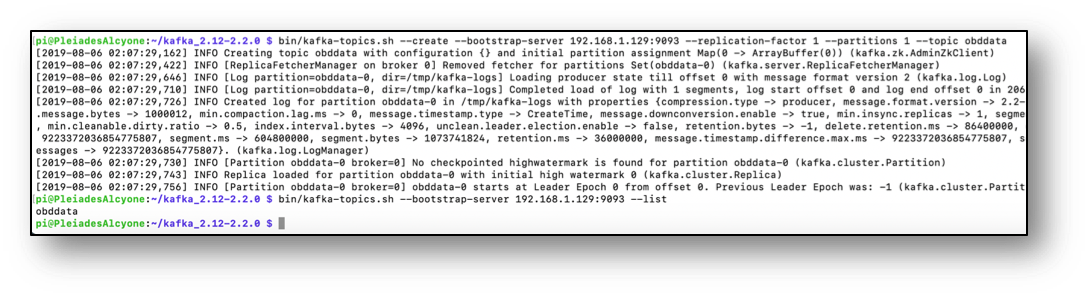
OBDII data from vehicles can be added to the ecosystem just as well. There are a few ways this can be achieved. The most practical, cable free option is with a Bluetooth ELM327 device. This is a low cost adaptor that can be purchased and installed on pretty much any vehicle after 1995. The adaptor plugs into the OBDII socket in the vehicle, connects via Bluetooth to a Pi-Zero-W, which then connects to a mobile phone’s 4G set up as a wi-fi hotspot. Once the data is flowing as far as needing a Kafka topic, the create command is pretty straight forward.
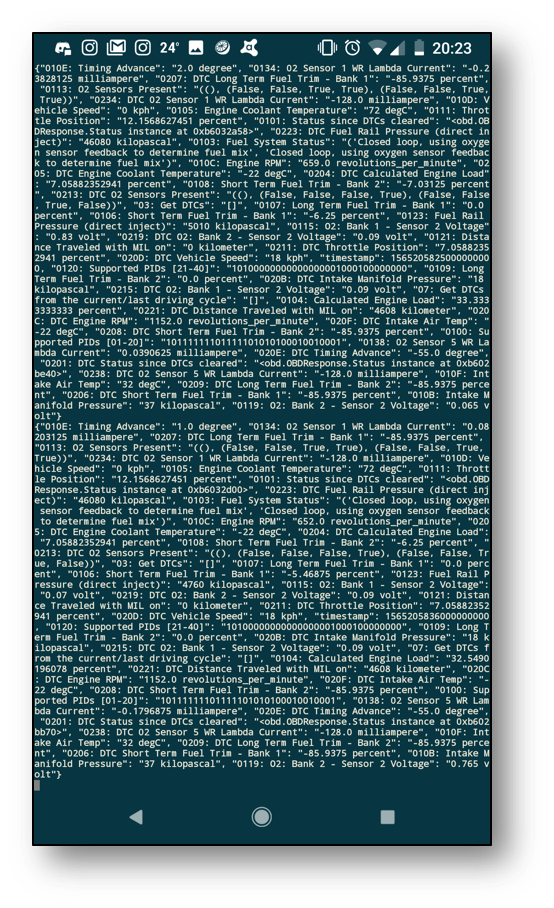
With the obd-producer python script running, another equivalently difficult command opens up the console consumer for the topic OBD in Alcyone, and we can check if we have streams and if the OBD data is flowing through Kafka. A quick check on my phone reveals we have flow.
To make things more interesting, the non-fan nodes in plastic and metal enclosures {Taygeta; Electra; Merope} were moved to a different geographical location and setup under a different network. This helps network outages and power cuts become less likely to affect our dashboard services or ability to access the IoT data. Adding cloud services to mirror this setup at this point would make it virtually bulletproof; zero point of failure is the aim of the game. When the car is on the move, Kafka is updating InfluxDB + Grafana in real time, and the intel can be tracked live as it happens from a laptop, desktop or phone from anywhere in the world.
In a fleet scenario, harsh braking could trigger a warning and have the on-duty tracking team take immediate action; if the accelerometer spikes as well, then that could suggest an accident may have just occurred or payload checks may be necessary. Fuel management systems could pick up on driving patterns and below average MPG performance, even sense when the driver is perhaps not having the best day. This is where the value of Kafka in IoT and the possibilities of using ML algorithms really becomes apparent because it makes all of this possible in real time without a huge overhead of complexity.

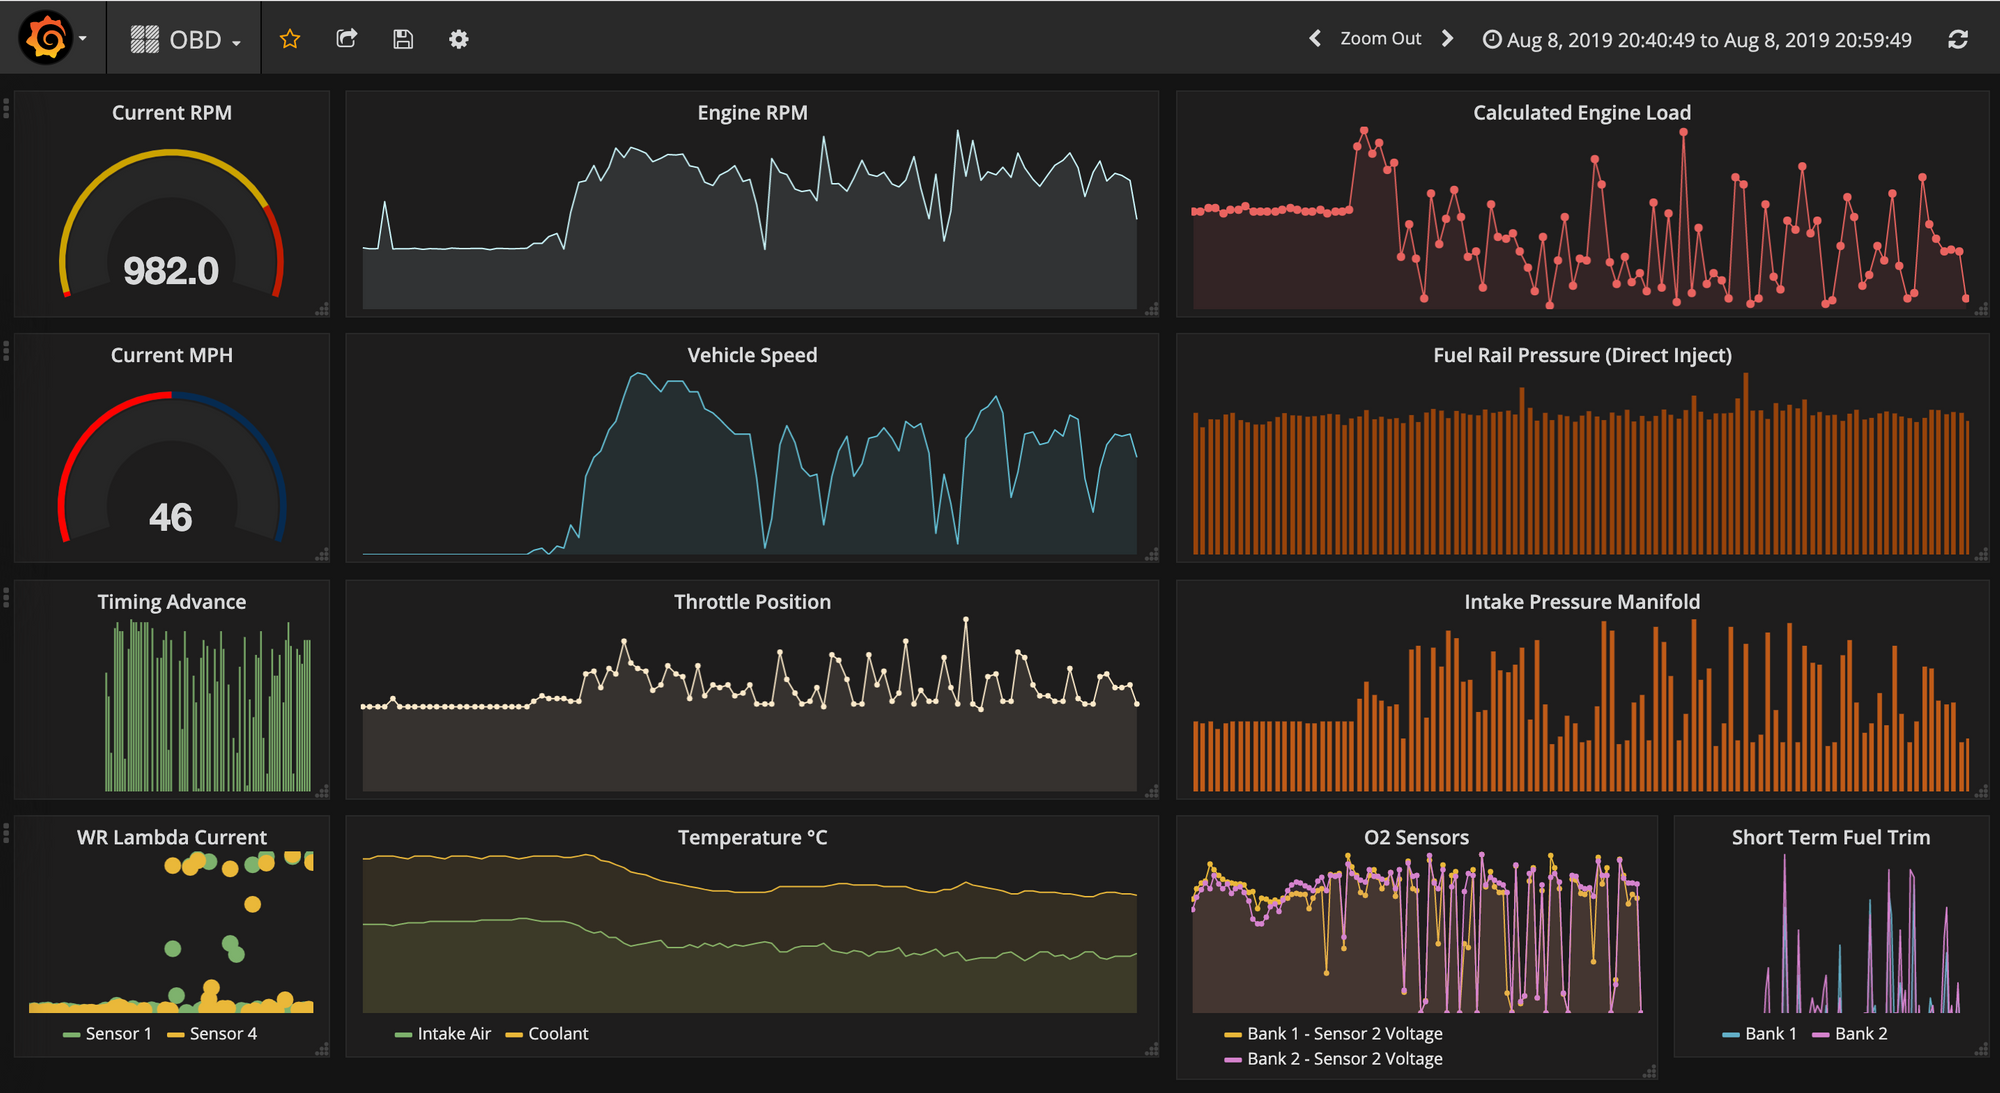
After plugging in the OBDII bluetooth adapter to the old e92-335i and driving it for 20 minutes, having it automatically stream data over the internet to the kafka master, Alcyone, and automatically create and update an OBD influxdb measure in Pleione, it can quickly be observed in Grafana that it doesn't enjoy idling that much; the coolant and intake air temperature dropped right down as it started moving at a reasonable speed. This kind of correlation is easier to spot in time series Grafana dashboards whereas it would be far less intuitive with standard vehicle dashboards that provide only current values.
So now that a real bare-metal infrastructure exists - and it’s a self-monitoring, low power consumption cluster, spread across multiple geographical locations, keeping track of enviro-sensor producers from multiple places/rooms, logging all vehicle data and learning to detect problems as far ahead as possible - adding sensor data pickup points to this Kafka ecosystem is as simple as its inherent scalability. As such, with the right Kafka-Fu, pretty much everything is kind of plug-&-play from this point onwards, meaning we can now go onto connecting, centralising and automating as many things in life as possible that can become IoT using Kafka as the core engine under the hood.