Timestamp Functions and Presentation Variables in Oracle Cloud Analytics

One of the most popular Rittman Mead blog posts over the last 10 years is Timestamps and Presentation Variables. As we are seeing more and more migrations to OAC, we decided to review and revise this post for the latest version of Oracle Cloud Analytics (OAC), 105.4.0-140 as of October 2019. Read more about the latest updates here.
--
One could say that creating a chart is not the most complex task in the world of Business Intelligence but we would argue that creating a meaningful report that perfectly illustrates the message hidden in data and therefore adds value to the management is nowhere close to being easy! A good way to make a report as informative as possible is to use trends and comparison. And to do so, a perfect tool would be the time analysis functions. For example comparing sales in a period of time this year to the same period of time the year before. Or measure the similarity or dissimilarity of sales in different months of the year.
Demo Platform
I have used a free trial instance of OAC for this demo. If you haven’t done yet, sign up for a free 30-day trial Oracle Cloud account (different to an Oracle account). Use the account to access the Oracle Cloud Infrastructure (OCI) console which is the latest Oracle movement towards having one integrated cloud platform to manage all your Oracle cloud applications, platforms, and infrastructure in one place.
From the OCI console it is 5 to 10 minutes before your free trial instance of OAC is up and running. For the detailed step by step of creating a new instance read here.
Demo Goals
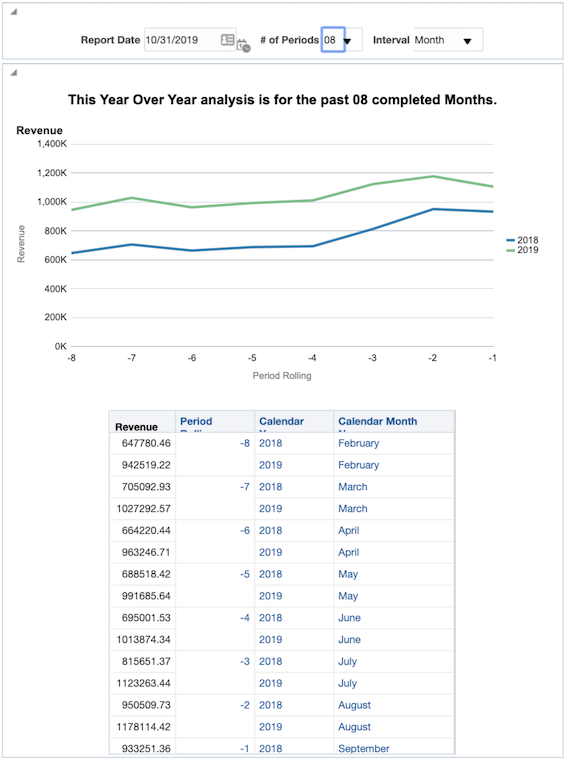
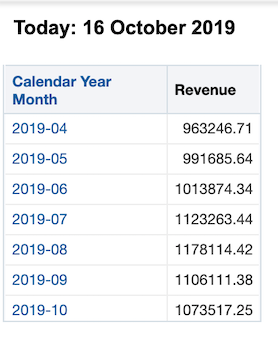
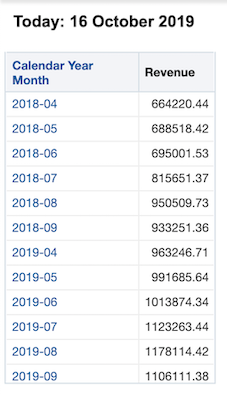
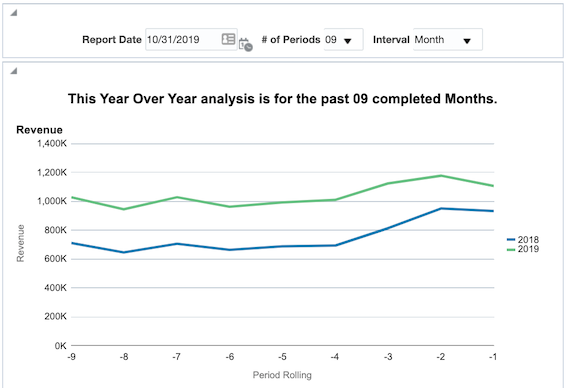
In this blog post I intend to show you how to combine the power of timestamp functions and presentation variables to create robust, repeatable reports. We will create a report that displays a year over year analysis for any rolling number of periods, by week or month, from any date in time, all determined by the user. This entire demo will only use values from a date and a revenue field.
TIMESTAMP Functions
TIMESTAMPADD() manipulates data of the data types DATE and DATETIME based on a calendar year.
Syntax: TIMESTAMPADD(interval, expr, timestamp)
Example: TIMESTAMPADD(SQL_TSI_MONTH, 12,Time."Order Date")
Description: Adds a specified number of intervals to a timestamp, and returns a single timestamp.
Timestamp Interval (TSI) Options: SQL_TSI_SECOND, SQL_TSI_MINUTE, SQL_TSI_HOUR, SQL_TSI_DAY, SQL_TSI_WEEK, SQL_TSI_MONTH, SQL_TSI_QUARTER, SQL_TSI_YEAR
Read more about other calendar functions.
Building Filters
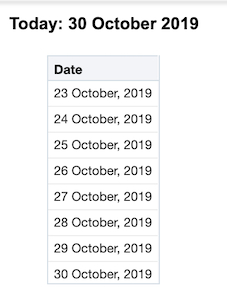
Starting to build our demo, the filter below returns all dates greater than or equal to 7 days ago including the current date.

In other words we have now a functional filter to select all the rows where Date >= a week ago.
As a good practice, always include a second filter giving an upper limit to the time filter. For example "Periods"."Day Date" < CURRENT_DATE would confirm that there won’t be any records that you don’t want in the mix and therefore no unnecessary strain on the system.
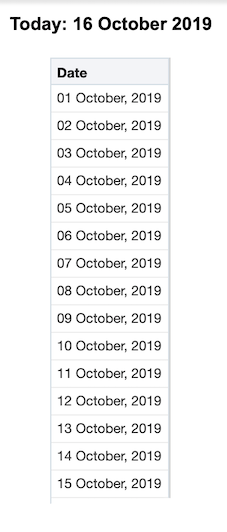
Let’s go one step further, instead of going 7 days back, we could try and include all the previous days in the current month or in other words dates >= the first day of the month. In this scenario, we can use the DAYOFMONTH() function to get the calendar day of any date. From here it will be easy to calculate the number of days in the month so far. Our new filter would look like this:
For example, if today is October 16th, DAYOFMONTH(CURRENT_DATE) would equal 16. Thus, we would subtract 16 days from CURRENT_DATE to go back to September 30th, and adding one will give us October 1st.
Presentation Variables
A presentation variable is a variable that can be created from the front end, the Analytics as part of one of the following types of dashboard prompts:
- Column prompt, Associated with a column and the values that it can take come from the column values. For information on working with column prompts, see Creating a Column Prompt.
- Variable prompt, Not associated with any column, and you define the values that it can take. For information on working with variable prompts, see Creating a Variable Prompt.
Each time a user selects a value in the column or variable prompt, the value of the presentation variable is set to the value that the user selects and will then be sent to any references of that filter throughout the dashboard page. This could be filters, formulas and even text boxes.
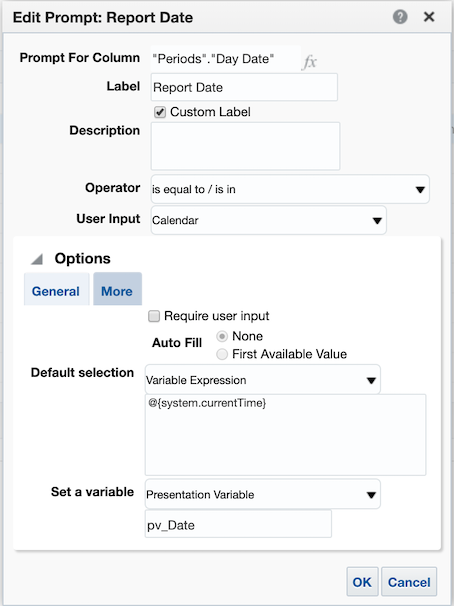
The first presentation variable we could introduce is to replace the CURRENT_DATE with a prompted value. Let’s call this presentation variable pv_Date,
- Use the syntax
@{pv_Date}to call this variable in the reports. - For variables of type string, surround the name in single quotes:
‘@{pv_String]’ - It is good practice to assign a default value to the presentation variables so that you can work with your report before publishing it to a dashboard. For example the default value for the
pv_DateisCURRENT_DATEso the new syntax would be@{pv_Date}{CURRENT_DATE}
Demo Time!
Our updated filter after replacing the CURRENT_DATE looks like below. Will will refer to this filter later as Filter 1 (F1).
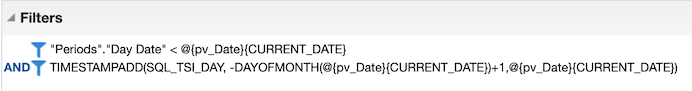
The filter is starting to take shape. Now let's say we are going to always be looking at a date range of six months before the selected date. All we would need to do is create a nested TIMESTAMP function. To do this, we will “wrap” our current TIMESTAMP with another that will subtract six months:

Now we have a filter to select dates that are greater than or equal to the first day of the month of any given date and all the six months prior to that.
To take this one step further, we can create another presentation variable called pv_n to allow the users to determine the amount of months to include in this analysis from a dashboard prompt.
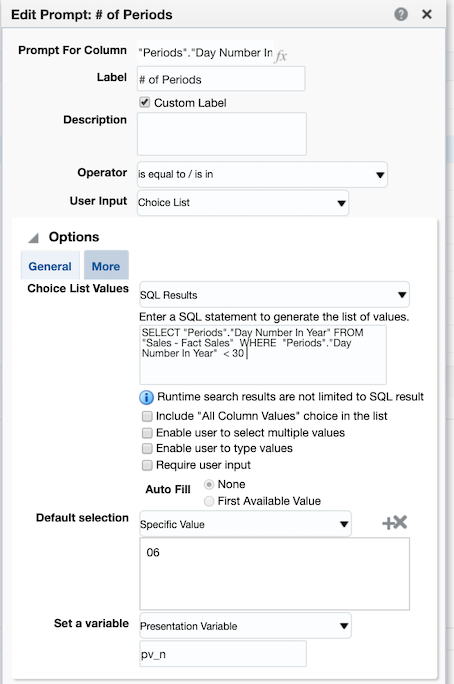
Here is the updated version of our filter using the number of periods presentation variable and a default value of 6, @{pv_n}{6}. We will refer to the following filter as Filter 2 (F2).

Our TIMESTAMPADD function is now fairly robust and will give us any date greater than or equal to the first day of the month from n months ago from any given date. Now we will see what we just created in action by creating date ranges to allow for a Year over Year analysis for any number of months. Consider the following filter set:
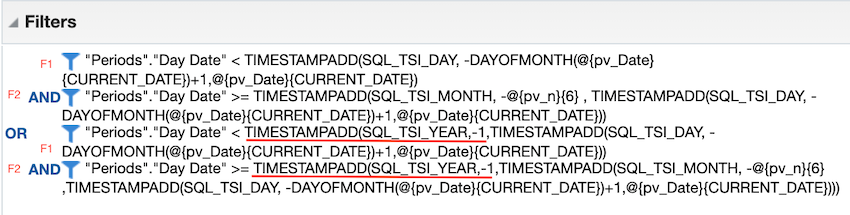
This may appear to be pretty intimidating at first but if we break it into parts we can start to understand its purpose. Notice we are using the exact same filters from before; Filter 1 and Filter 2. What we have done here is filtered on two time periods, separated by the OR statement.
- The first date range defines the period as being the most recent completed n months from any given prompted date value, using a presentation variable with a default of today. Dates in the current month have been removed from the set by Filter 1.
- The second time period, after the OR statement, is the exact same as the first only it has been wrapped in another TIMESTAMP function subtracting a year, giving you the exact same time frame for the year prior.
This allows us to create a report that can run a year over year analysis for a rolling n month time frame determined by the user.
A note on nested TIMESTAMPS: you will always want to create nested TIMESTAMPS with the smallest interval first. Then you will wrap intervals as necessary. In this case our smallest increment is day, wrapped by month, wrapped by year.
Let’s Go Crazy
A more advanced trick, If you use real time or near real time reporting: using CURRENT_DATE may be how you want to proceed. Otherwise, instead of using today as your default date value, use yesterday’s date since most data are only as current as yesterday. Using yesterday will be valuable especially when pulling reports on the first day of the month or year - you generally want the entire previous time period rather than the empty beginning of a new one. So, to implement, wherever you have @{pDate}{CURRENT_DATE} replace it with @{pDate}{TIMESTAMPADD(SQL_TSI_DAY,-1,CURRENT_DATE)}
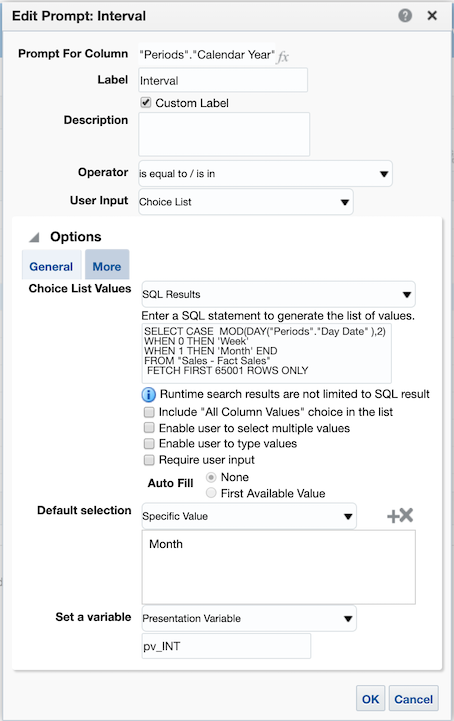
One more change on our filter to make it extra-flexible here is to use a new presentation variable to determine if you want to display year over year values, or by month, or by week. This can be done by inserting a variable into your SQL_TSI_MONTH and DAYOFMONTH statements; changing MONTH to SQL_TSI_@{pv_INT}{MONTH} and DAYOF@{pv_INT}{MONTH}, where pv_INT is the name of our variable.
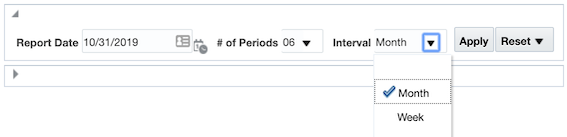
Start by creating a dummy variable in your prompt to allow users to select either MONTH or WEEK. You can try something like this: CASE MOD(DAY("Time"."Date"),2) WHEN 0 'WEEK' WHEN 1 THEN 'MONTH' END
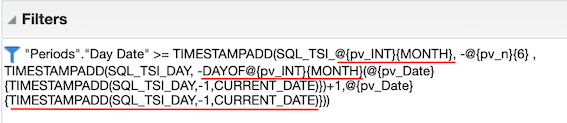
The updated filter now look like this:
In order for our interaction between Month and Week to run smoothly we have to factor in one last consideration: if we are to take the date December 1st, 2019 and subtract one year we get December 1st, 2018. However, if we take the first day of this week, Sunday December 15, 2019 and subtract one year we get Saturday December 15, 2014. In our analysis this will cause an extra partial week to show up for prior years. To get around this we will add a case statement determining if '@{pv_INT}{MONTH}' = 'Week' THEN subtract 52 weeks from the first of the week ELSE subtract 1 year from the first of the month. With this, our final filter set will look like this:
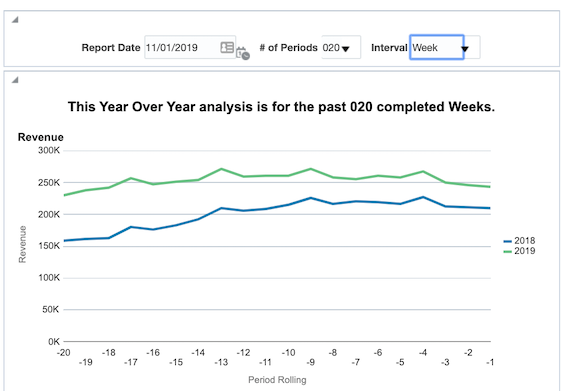
With the use of these filters and some creative dashboarding, you can construct a report that easily allows you to view a year over year analysis from any date in time for any number of periods either by month or by week.
Filtered by Week intervals;
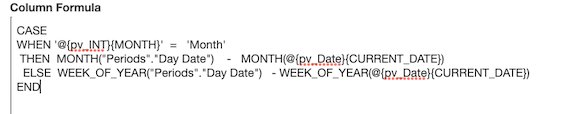
The formula below will give you the value of period rolling to use in the analysis;
In this post, we created a cloud version of the amazing demo previously described by Brian Hall. As demonstrated, Timestamp functions and their power have been within the interesting topics of the visualisation and reporting for as long as we at Rittman Mead remember and can still be used in the realm of the Oracle Cloud Services in a very similar way as the past.
Feel free to get in touch, let us know your reviews and comments.