What's new in OAC5.5?
All the new features of OAC5.5

Last Friday, alongside Oracle Analytics Server (for which a blog post is coming), new OAC version came out, let's have a quick look at all the new features it includes!
Maps
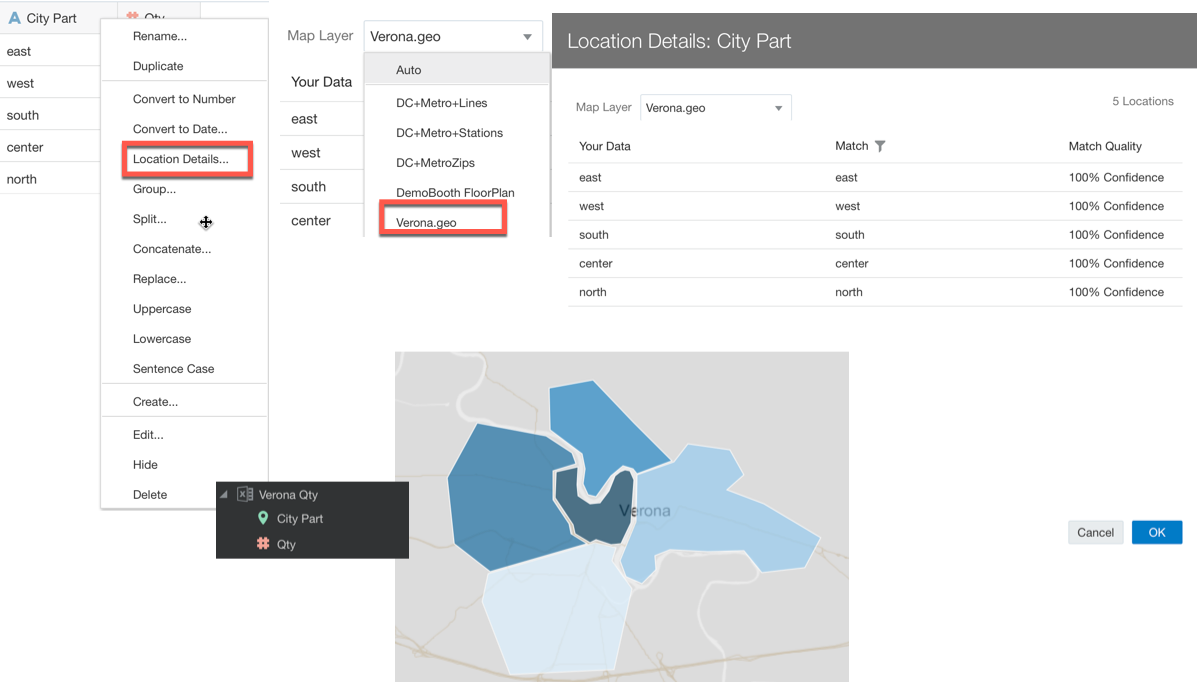
If you use Maps often, then there is a good list of options available to you! The very first is the possibility to associate a Map Layer to a Data Column directly in the data source definition.
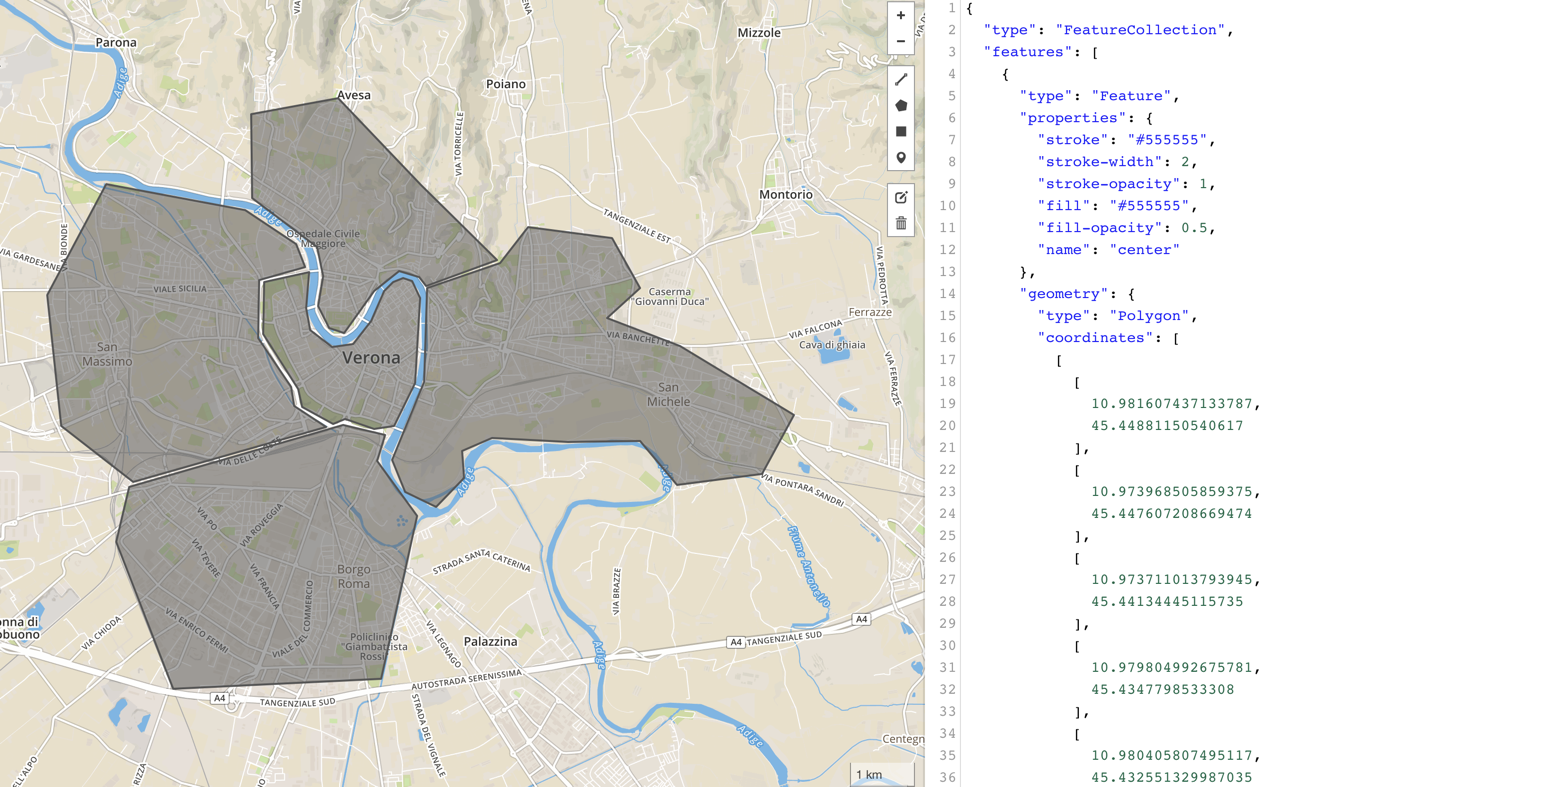
Let's say you have a column City Zones in your dataset, which divides a city in customized areas based on your company needs and you have a map layer defining geographically those areas (e.g. with a GeoJSON file). I created an example with Verona, the city where I live. Custom GeoJSON file was created using geojson.io.
The upload of custom shapes and their usage in OAC was already available since some time, however you as project creator had to associate the City Zone column to the correct Map Layer for each map visualization included in your project. Now you can define the Map Layer to Data column association once for all at datasource level, so every Map using the City Zone column will automatically use the correct Layer.
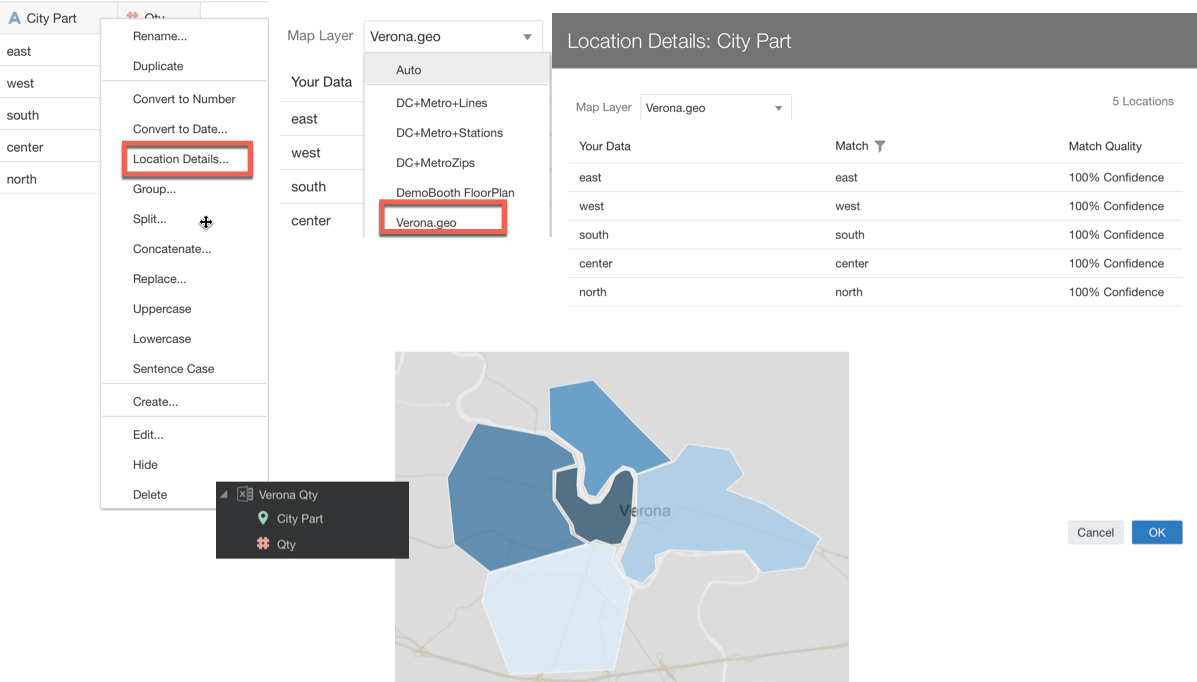
Another cool new feature in Maps is the AutoFocus on Data, meaning that the visualization will automatically zoom and center the map appropriately based on the dataset presented and rearrange in case of changes in the filtering.
Pivot Tables
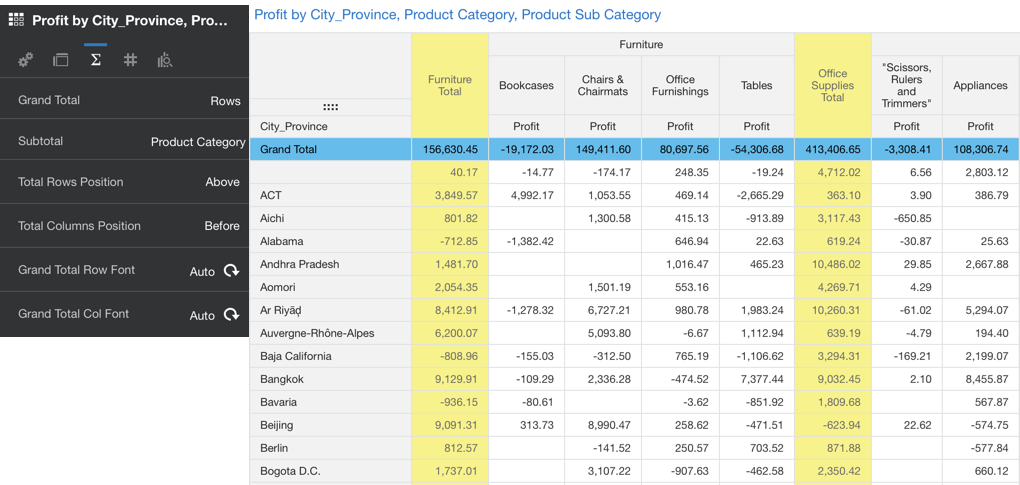
Another new option is available in pivot tables where now you can set Totals and Subtotals Above and Below like you were used to do in Answers. Like the "old" tool you can now set a different format for the Totals and Subtotals with coloring, background and font formatting options available. You have now the full control of the layout and can make beautiful or horrible (like the below) color choices.
Visualizations
The perfect visualization is now available: the Spacer Viz! This is an empty visualization that you can add to your canvas allowing you to optimize the layout in cases where you need an extra white space.
Another news in this release is related to the Custom Background: now it's possible to define a color or an image as background for the whole Project or for a single canvas. The image can be a URL reference or uploaded from the desktop. There are also options to position the image in the screen and to auto-fit the image in the window size. Adding a custom background to the whole project means that every time a new canvas is added, it will already have the selected image/color by default.
Another news is represented by the Butterfly Viz, this view was already available as plugin from the Oracle Analytics Library, now becomes native in OAC5.5. The butterfly viz is useful when comparing two metrics across the same dimension.
By Default the two metrics are on the same scale, but there is also an option "Synchronized Scales" that, when set to OFF will show the metric on different scales.
Datasources and Data Gateway
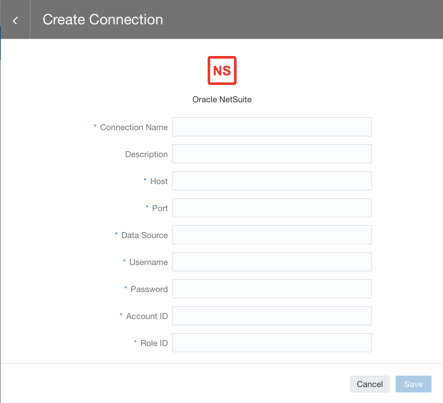
A new datasource definition to Oracle NetSuite is now available, allowing the connection by passing the parameters Datasource, Account ID and Role ID on top of the usual Host, Username and Password.
An enhancement has been published also for the Oracle Database connection: now you can select between a Basic connection and Advanced. The Basic option should be used when connecting to single node databases. The Advanced, on the other side, is useful when connecting to Cluster RAC DBs where multiple hostnames and ports need to be listed. When selecting the Advanced option we can simply add a custom connection string like the below
(DESCRIPTION
(ADDRESS_LIST= (LOAD_BALANCE=on)(FAILOVER=on)
(ADDRESS=(PROTOCOL=tcp)(HOST=hostname1.subnet.com)(PORT=1529))
(ADDRESS=(PROTOCOL=tcp)(HOST=hostname2.subnet.com)(PORT=1529))
(ADDRESS=(PROTOCOL=tcp)(HOST=hostname3.subnet.com)(PORT=1529))
...
(ADDRESS=(PROTOCOL=tcp)(HOST=hostnamen.subnet.com)(PORT=1529))
)
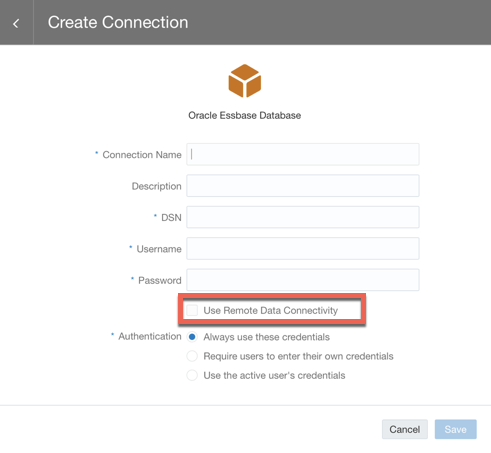
)A option is also available to use Data Gateway with Essbase sources, making the OAC on-premises Essbase connection only one click away by just enabling Use Data Gateway option in the screen. The usage of Data Gateway is also available now on BI Publisher allowing the pixel perfect reporting from on-premises datasources.
Another option in BI Publisher is Data Chunking, extremely useful for big reports since it allows the report execution in multiple sub-jobs in parallel with a final job to consolidate the results in a unique output.
The above are the news for this release, do you want more detailed examples on a particular features? Let me know in the comments and I'll write about it!