Oracle Analytics Server 2022 (6.4): The Best 15 New Features, Ranked

OAS 6.4 is finally live and provides a big set of enhancements that had been already available to OAC users. New features mostly affect the Data Visualization tool and involve the full process flow, from the data preparation to the data presentation, including visualizations, machine learning and administration improvements.
The focus of this post is on the best 15 new features of OAS 6.4 according to my personal opinion. I asked to my colleagues at Rittman Mead to rank them after a quick demonstration, so you know who to blame if the feature to hide loading messages is not at the top of the ladder!
If you are interested in a comprehensive list of new features and enhancements in OAS 6.4 please refer to What's New for Oracle Analytics Server.
15. Redwood theme
OAS 6.4 includes components of Redwood - Oracle's new user experience design language. With a consistent look and feel across Analytics, Publisher and Data Visualization tools, the new default theme improves the user experience through a better handling of white space, a softer color palette, and new fonts.
14. Hide loading messages
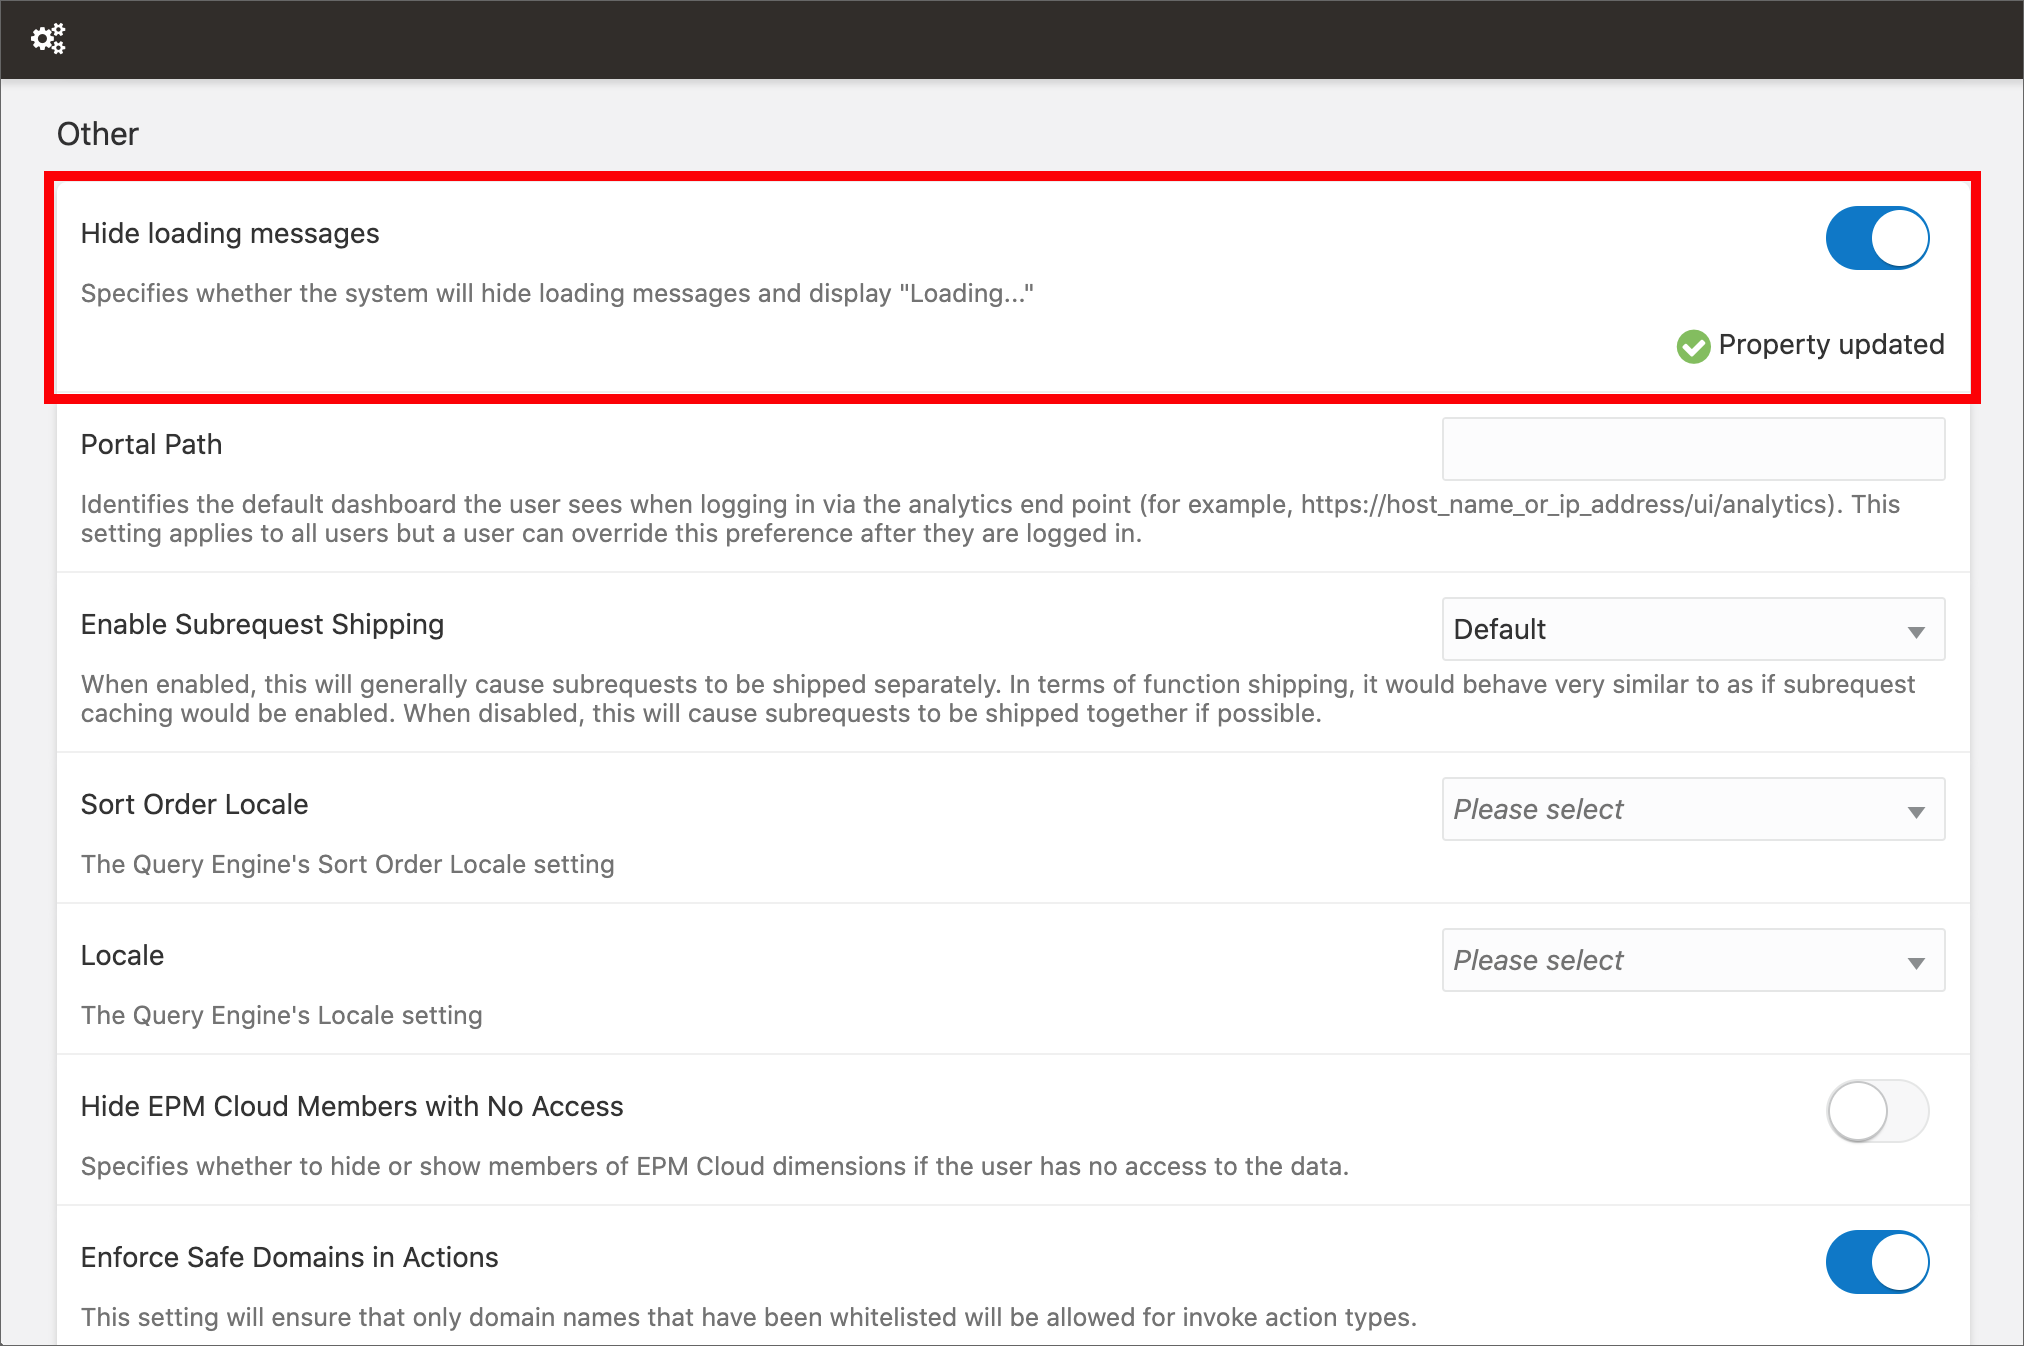
Funny random quotes are displayed in Data Visualization during loading since it has been released, and since then people are asking for a way to disable or customize them. These messages can be fun for the first 2 seconds, but when they are displayed over and over if loading takes longer... I feel like the application is fooling me!

I'm really happy to announce that I can finally crumple my loyal sticky note (see the picture above) because quotes can be replaced with a generic "Loading..." message in OAS 6.4. This can be done by switching on the Hide loading messages option in the System Settings section of Data Visualization Console, and restarting the Presentation Server.
13. Improved Home page search
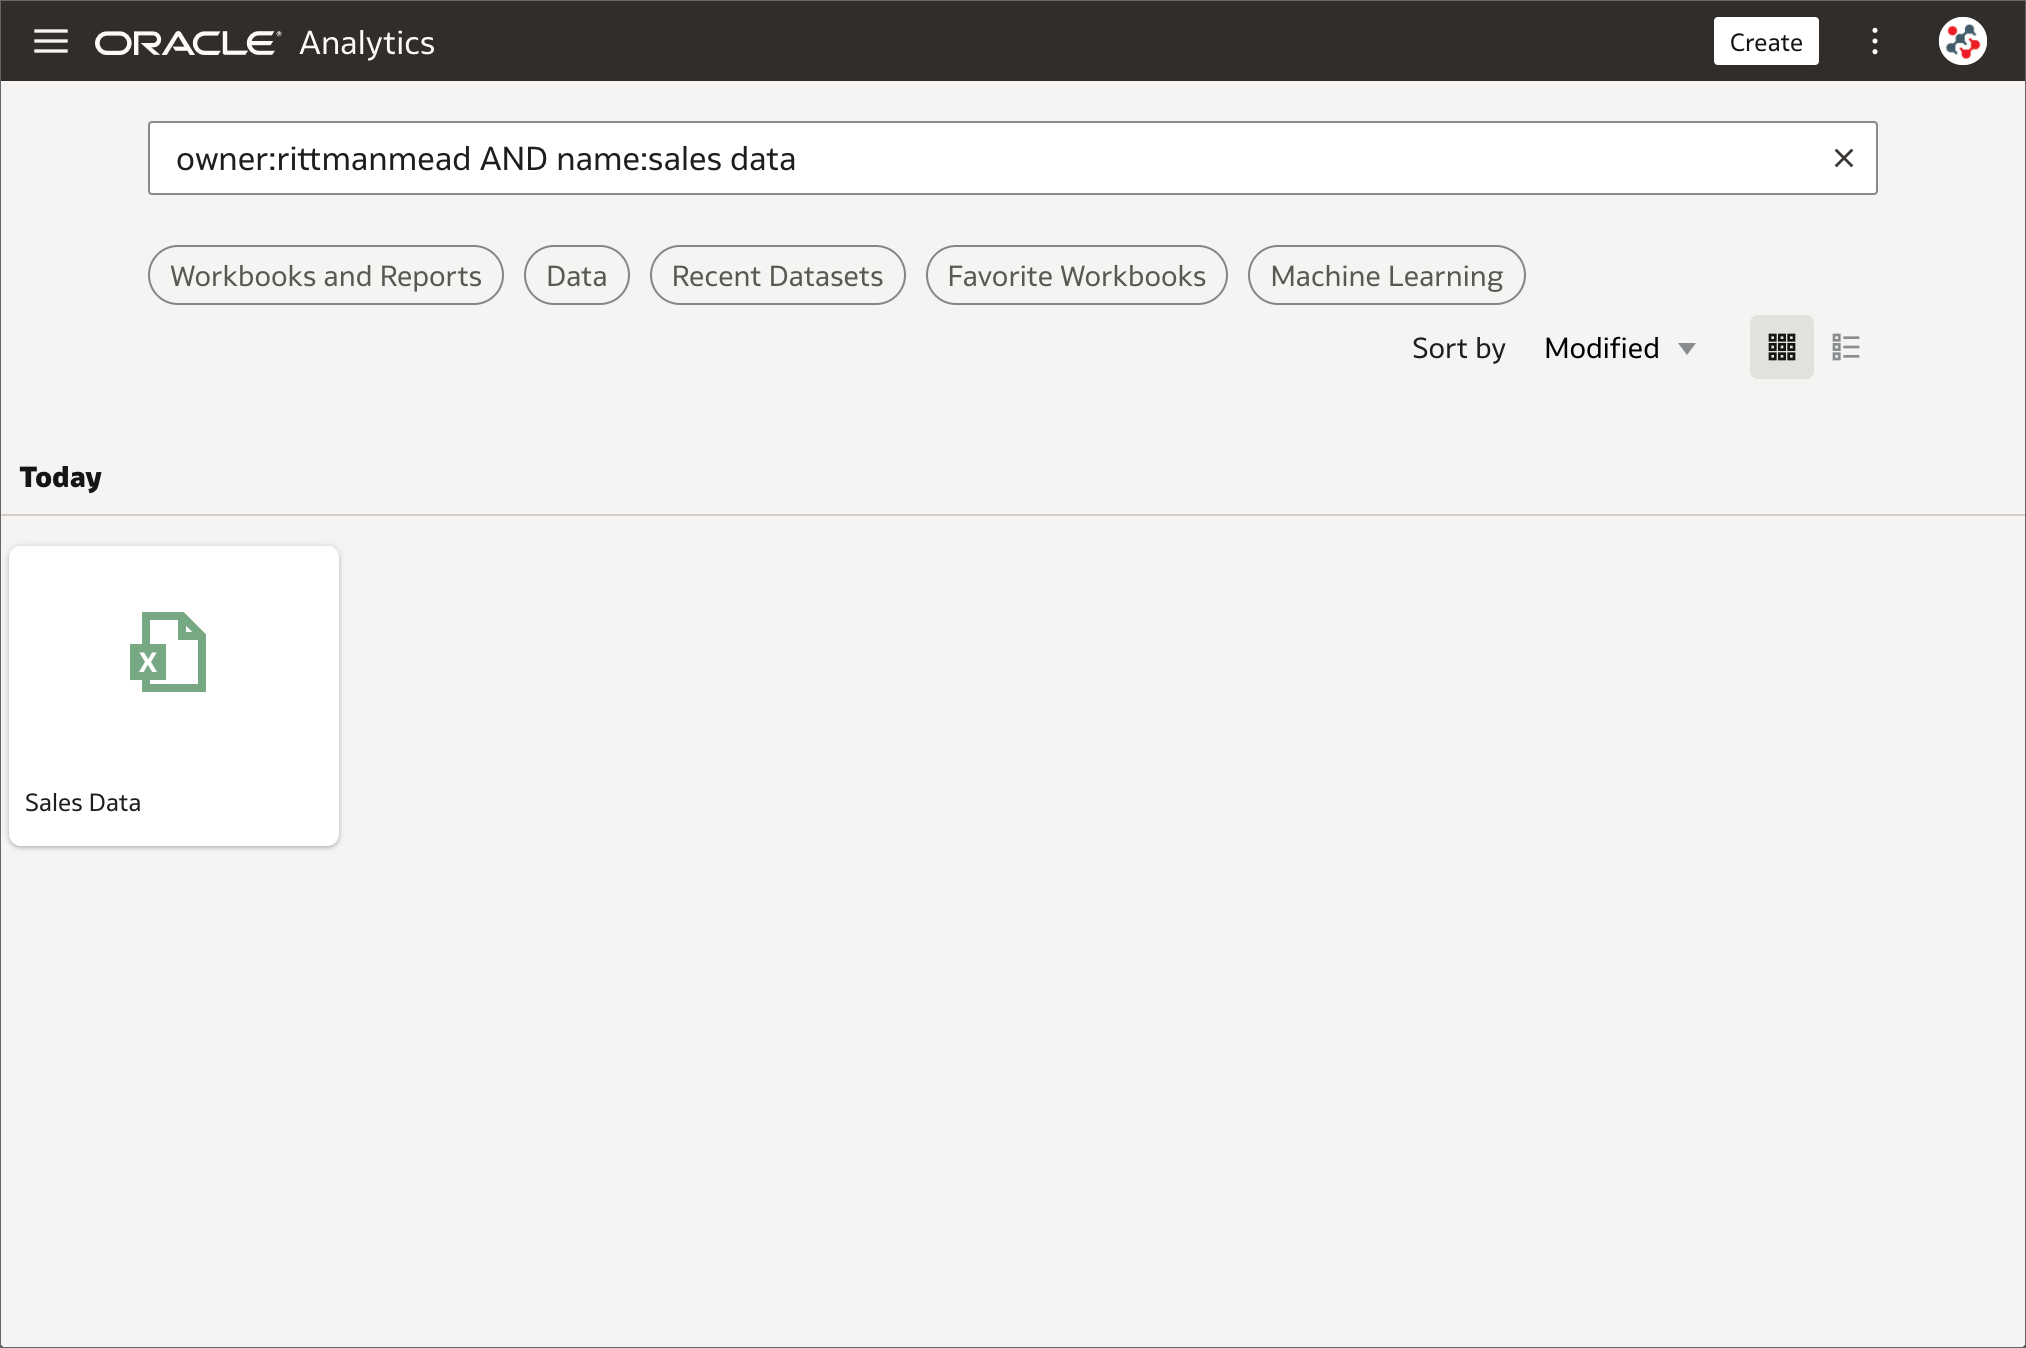
The search bar in the Home page can be used to search for content and generate on-the-fly visualizations based on the chosen keywords. This was already one of my favourite features and it has been further improved in OAS 6.4: advanced search commands can be used to tailor search results for exact matches, multi-term matches, and field-level matches. When the list of accessible datasets is huge, these commands result particularly useful to quickly locate datasets created by a specific user or with a particular name. Unfortunately, the advanced search commands can be used only in the Home page search bar, and not in all other pages such as Data.
12. Support for Back button in browsers
The Back button in the browser can be pressed to navigate within the OAS 6.4 interface such as between editors and the Home page. Unfortunately, this cannot be used it in Analytics (Classic) and Publisher editors to undo an action.
11. View and export membership data
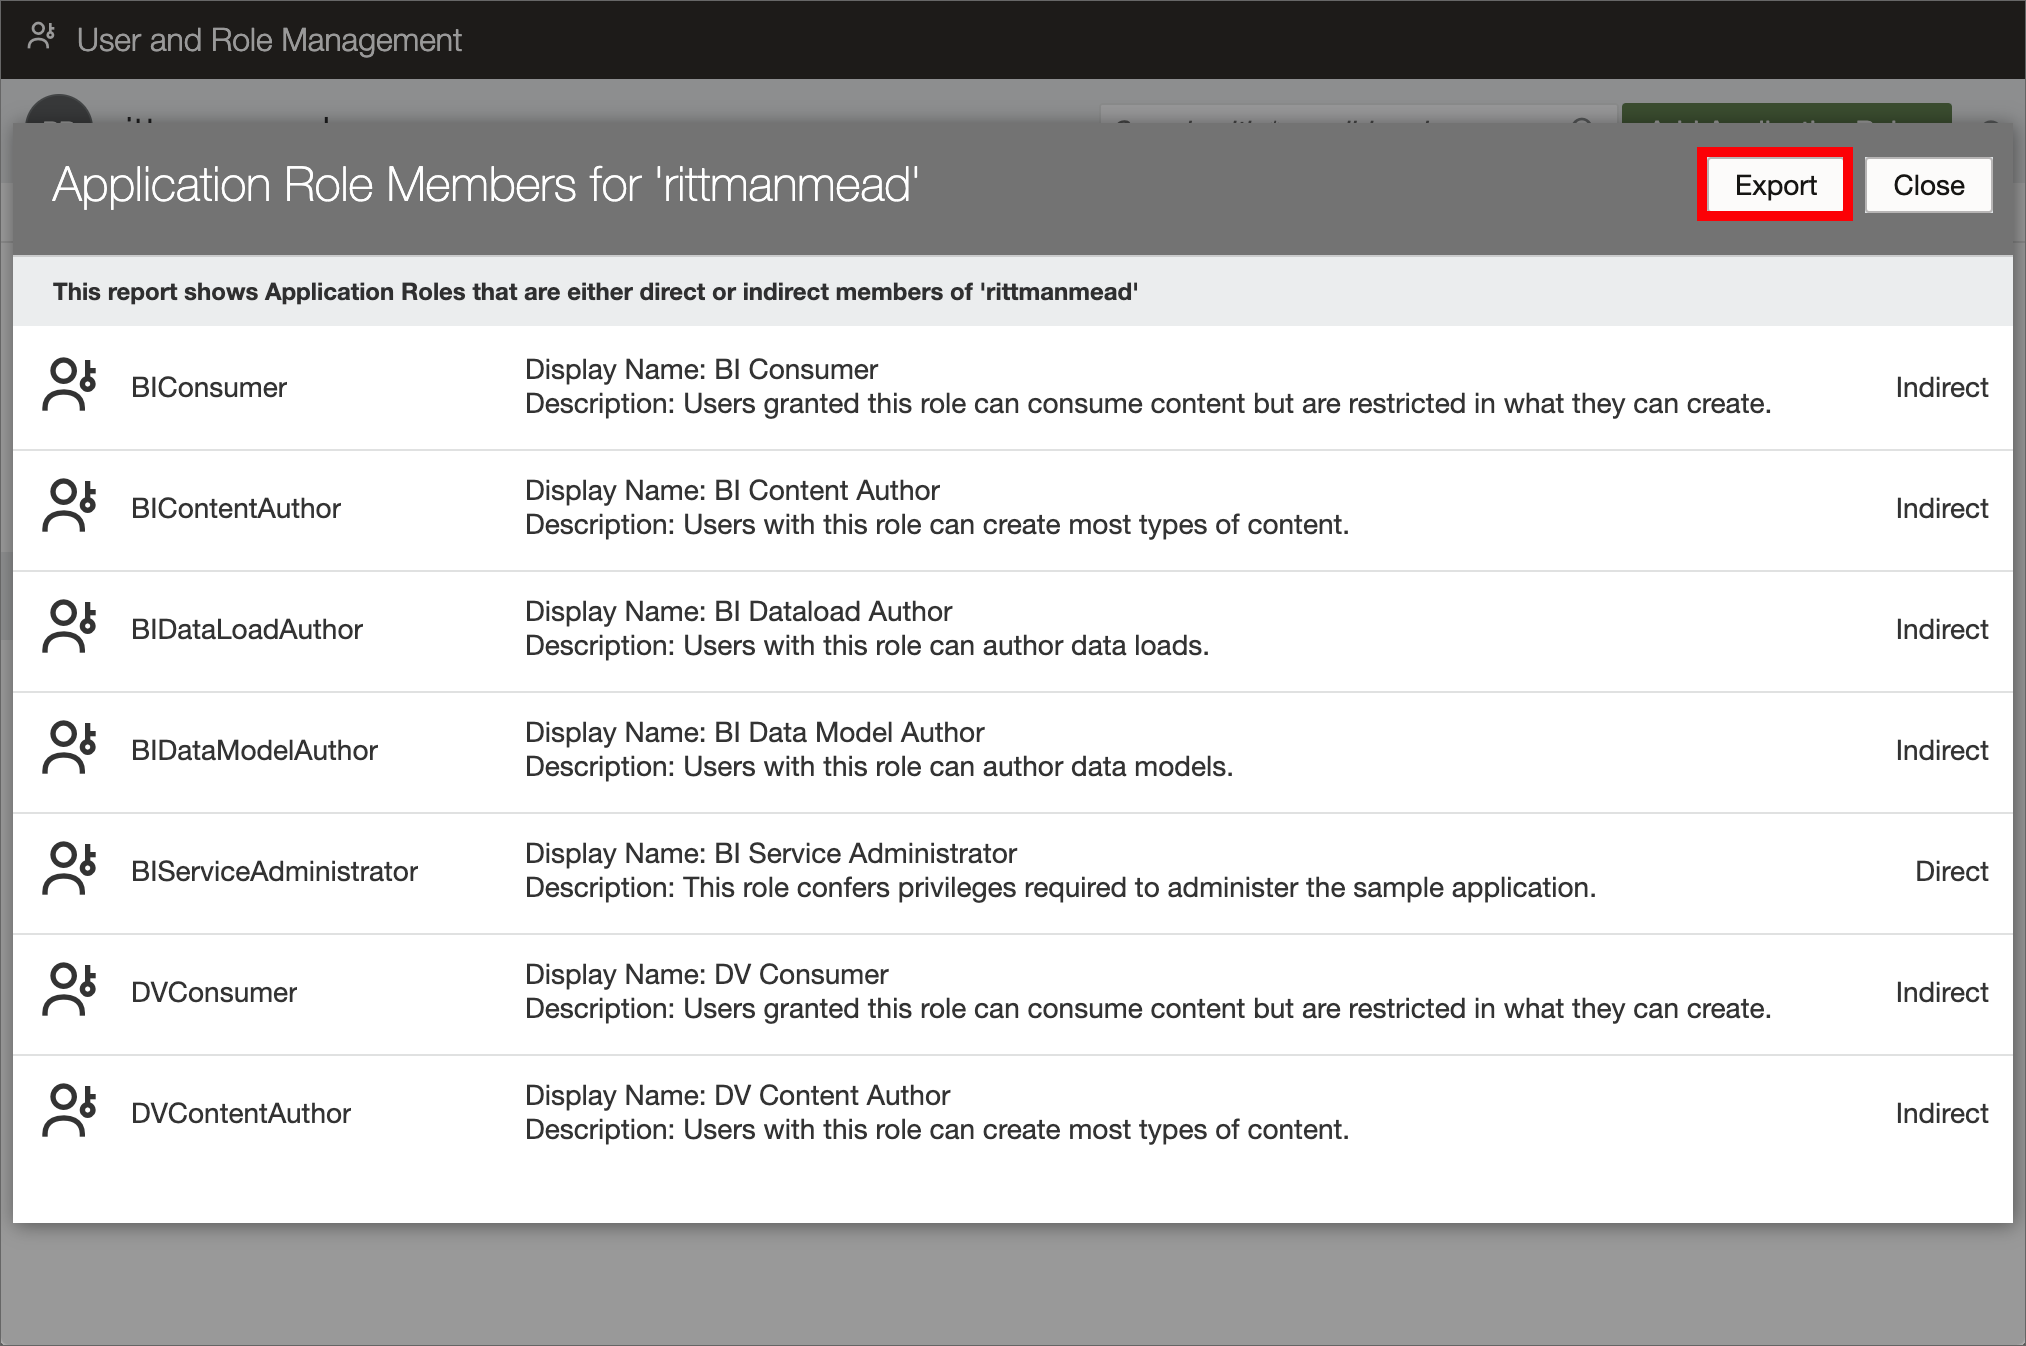
Exporting membership data for auditing purposes and to find out exactly who has what access is a common task for any OAS administrator. To achieve this task I always used WLST with custom Python scripts, and I will probably continue with this approach in future. However, for users not familiar with WLST and Python, there is a new option in OAS 6.4 to download membership data for users, groups, and application roles to a CSV file in few clicks.
To view and export membership data for a user:
- Open the Users and Roles section in Data Visualization Console.
- Select the Users tab and select the name of the user whose membership details you want to see.
- Click on Application Roles (or Groups) under Direct Memberships.
- Click on the menu icon and select Show Indirect Memberships.
- Click on the Export button.
In a similar way membership data for groups and application roles can be viewed and exported.
10. Annotations on canvases
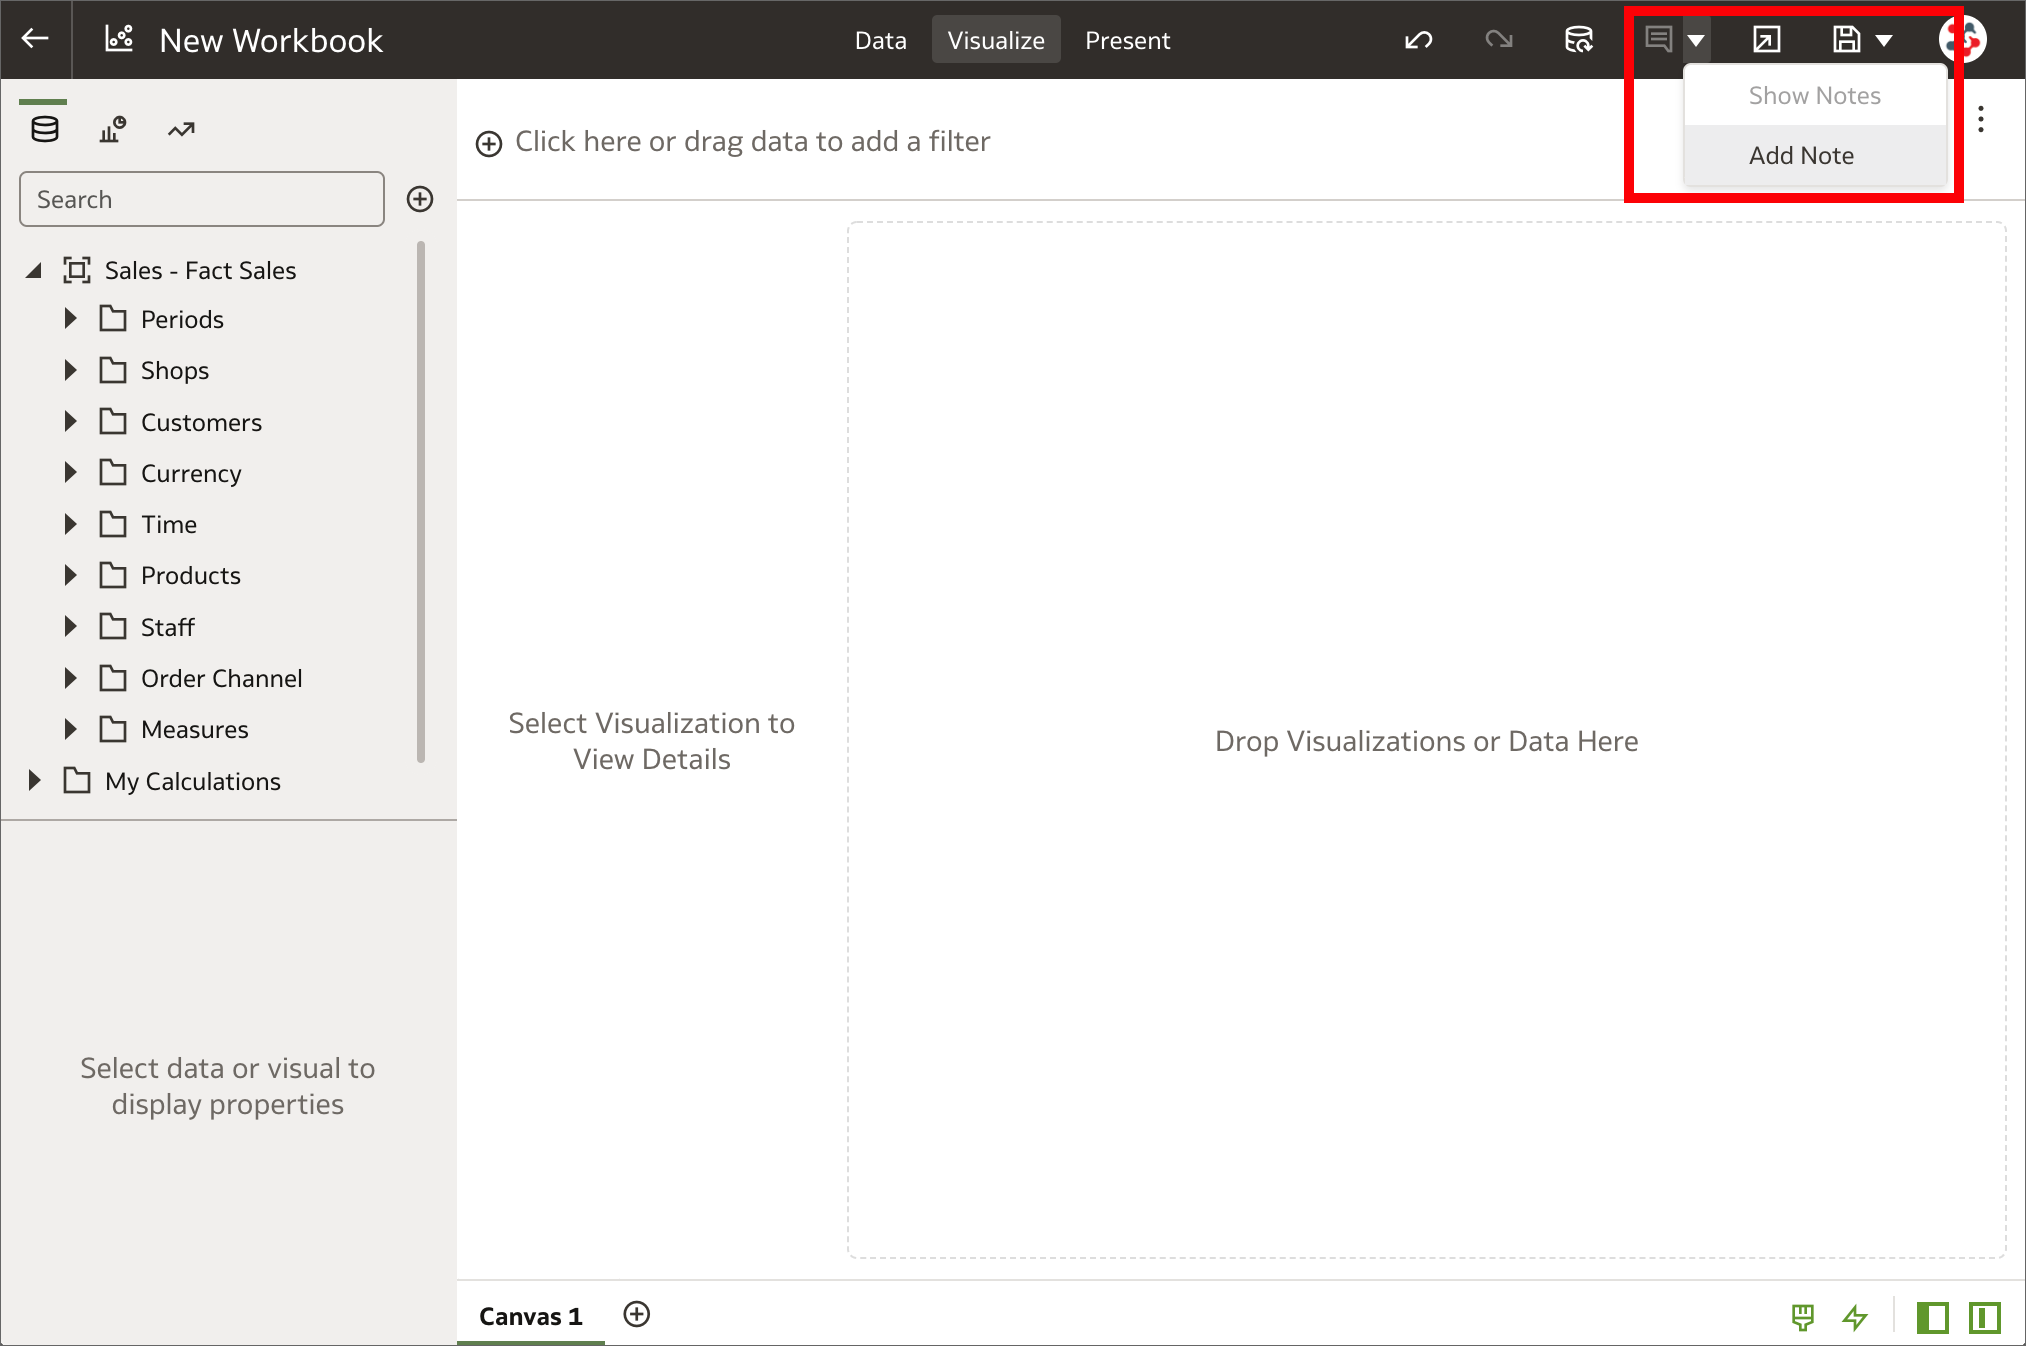
Notes are a great way to emphasize or explain important information in visualizations, but I always found it limiting to be able to use them only in Data Visualization stories. In OAS 6.4 notes can be added to canvases in workbooks and tied to specific data points also in the Visualize tab. If you are wondering what a workbook is, it's just how projects are called in the new release!
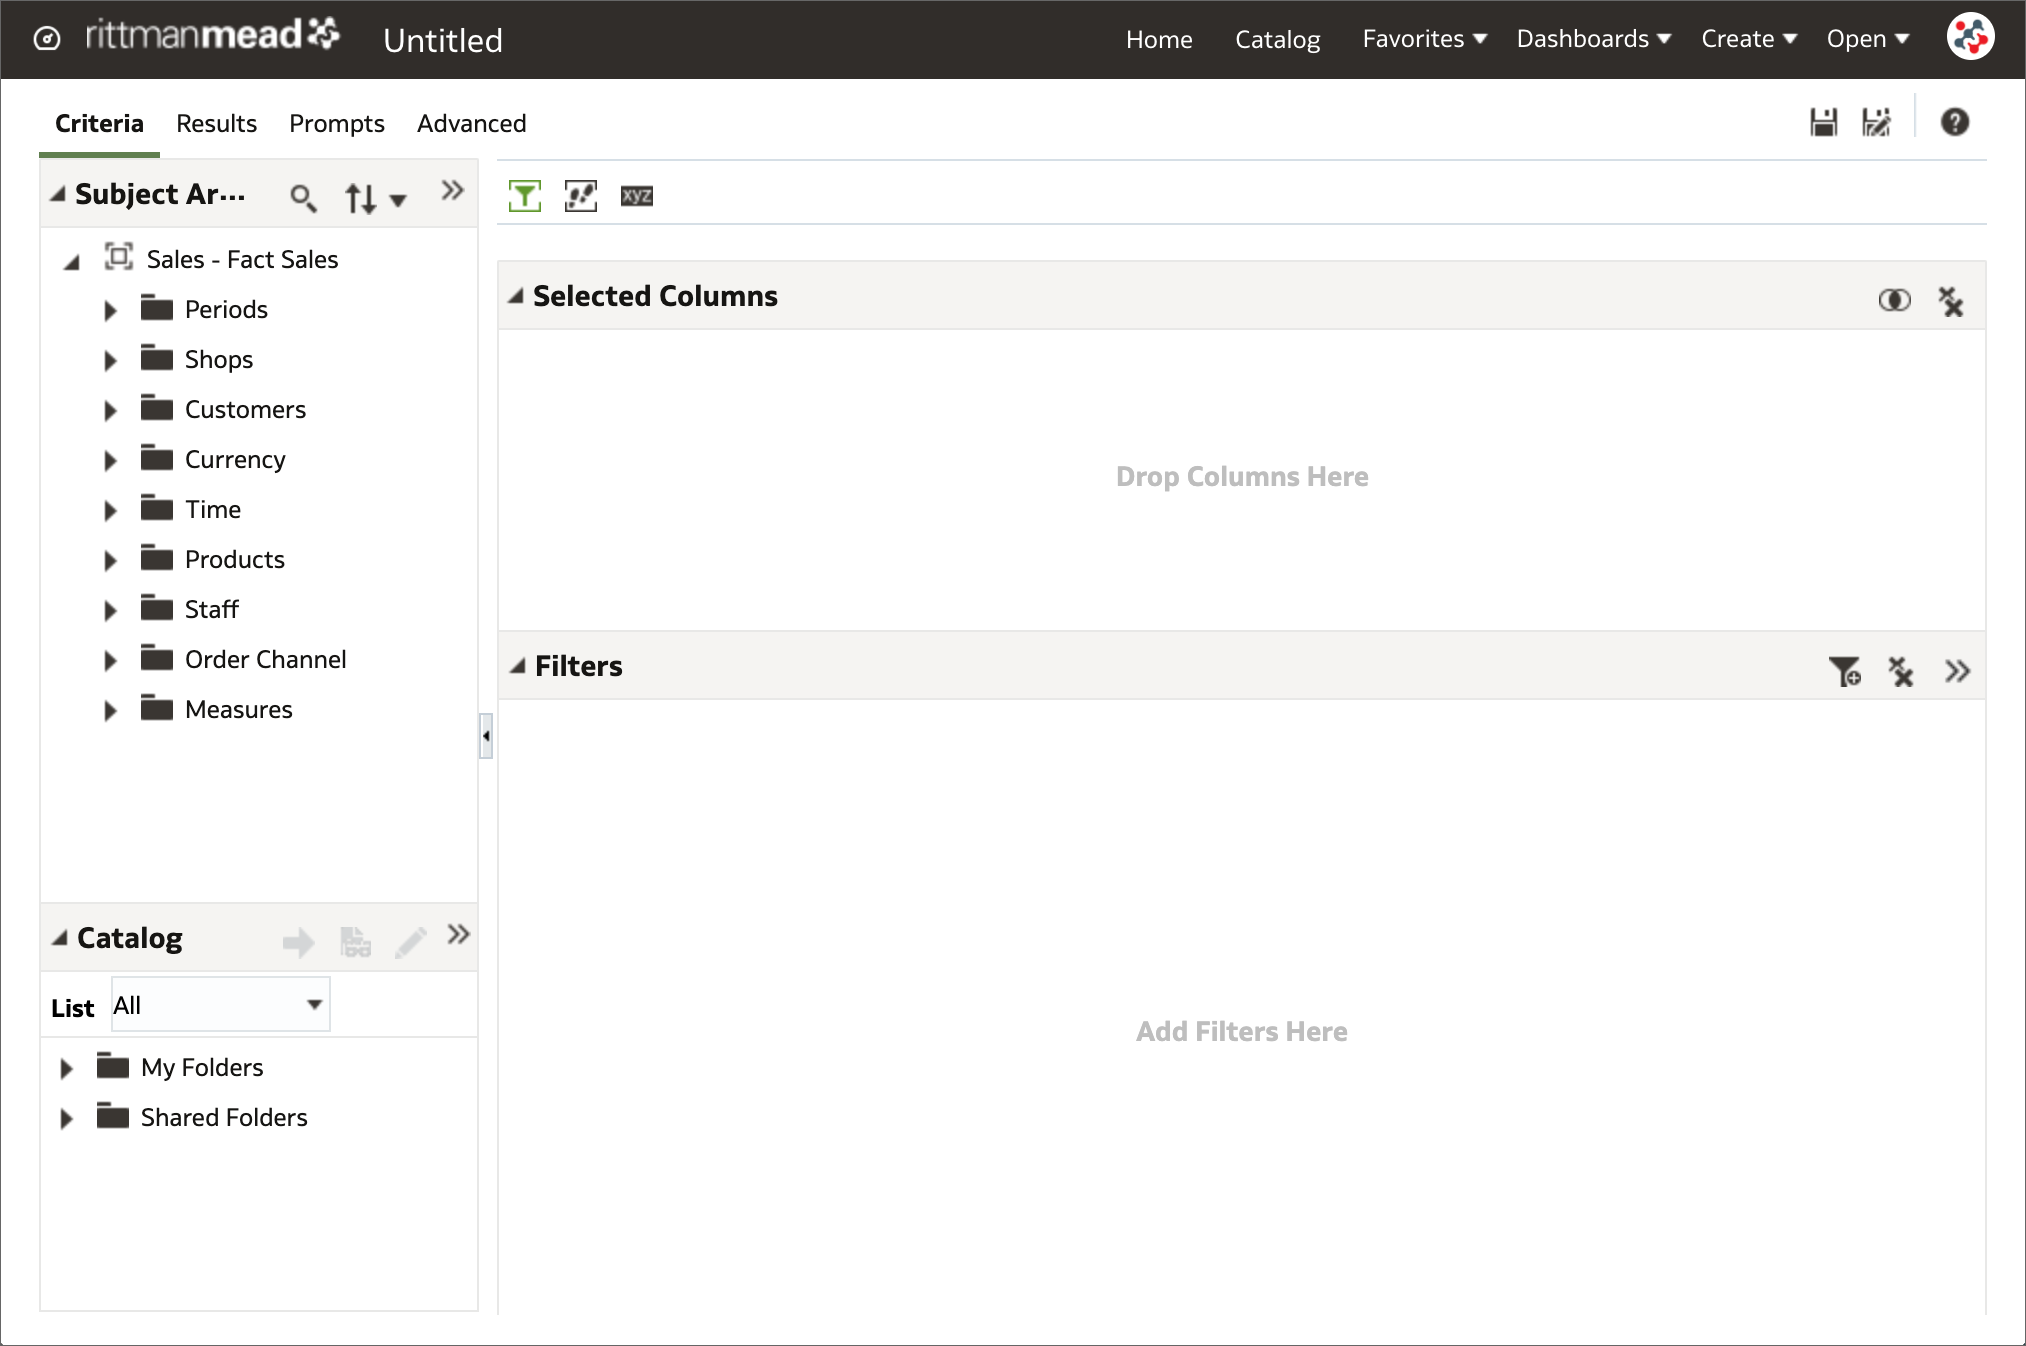
9. Expression filters for entities in datasets
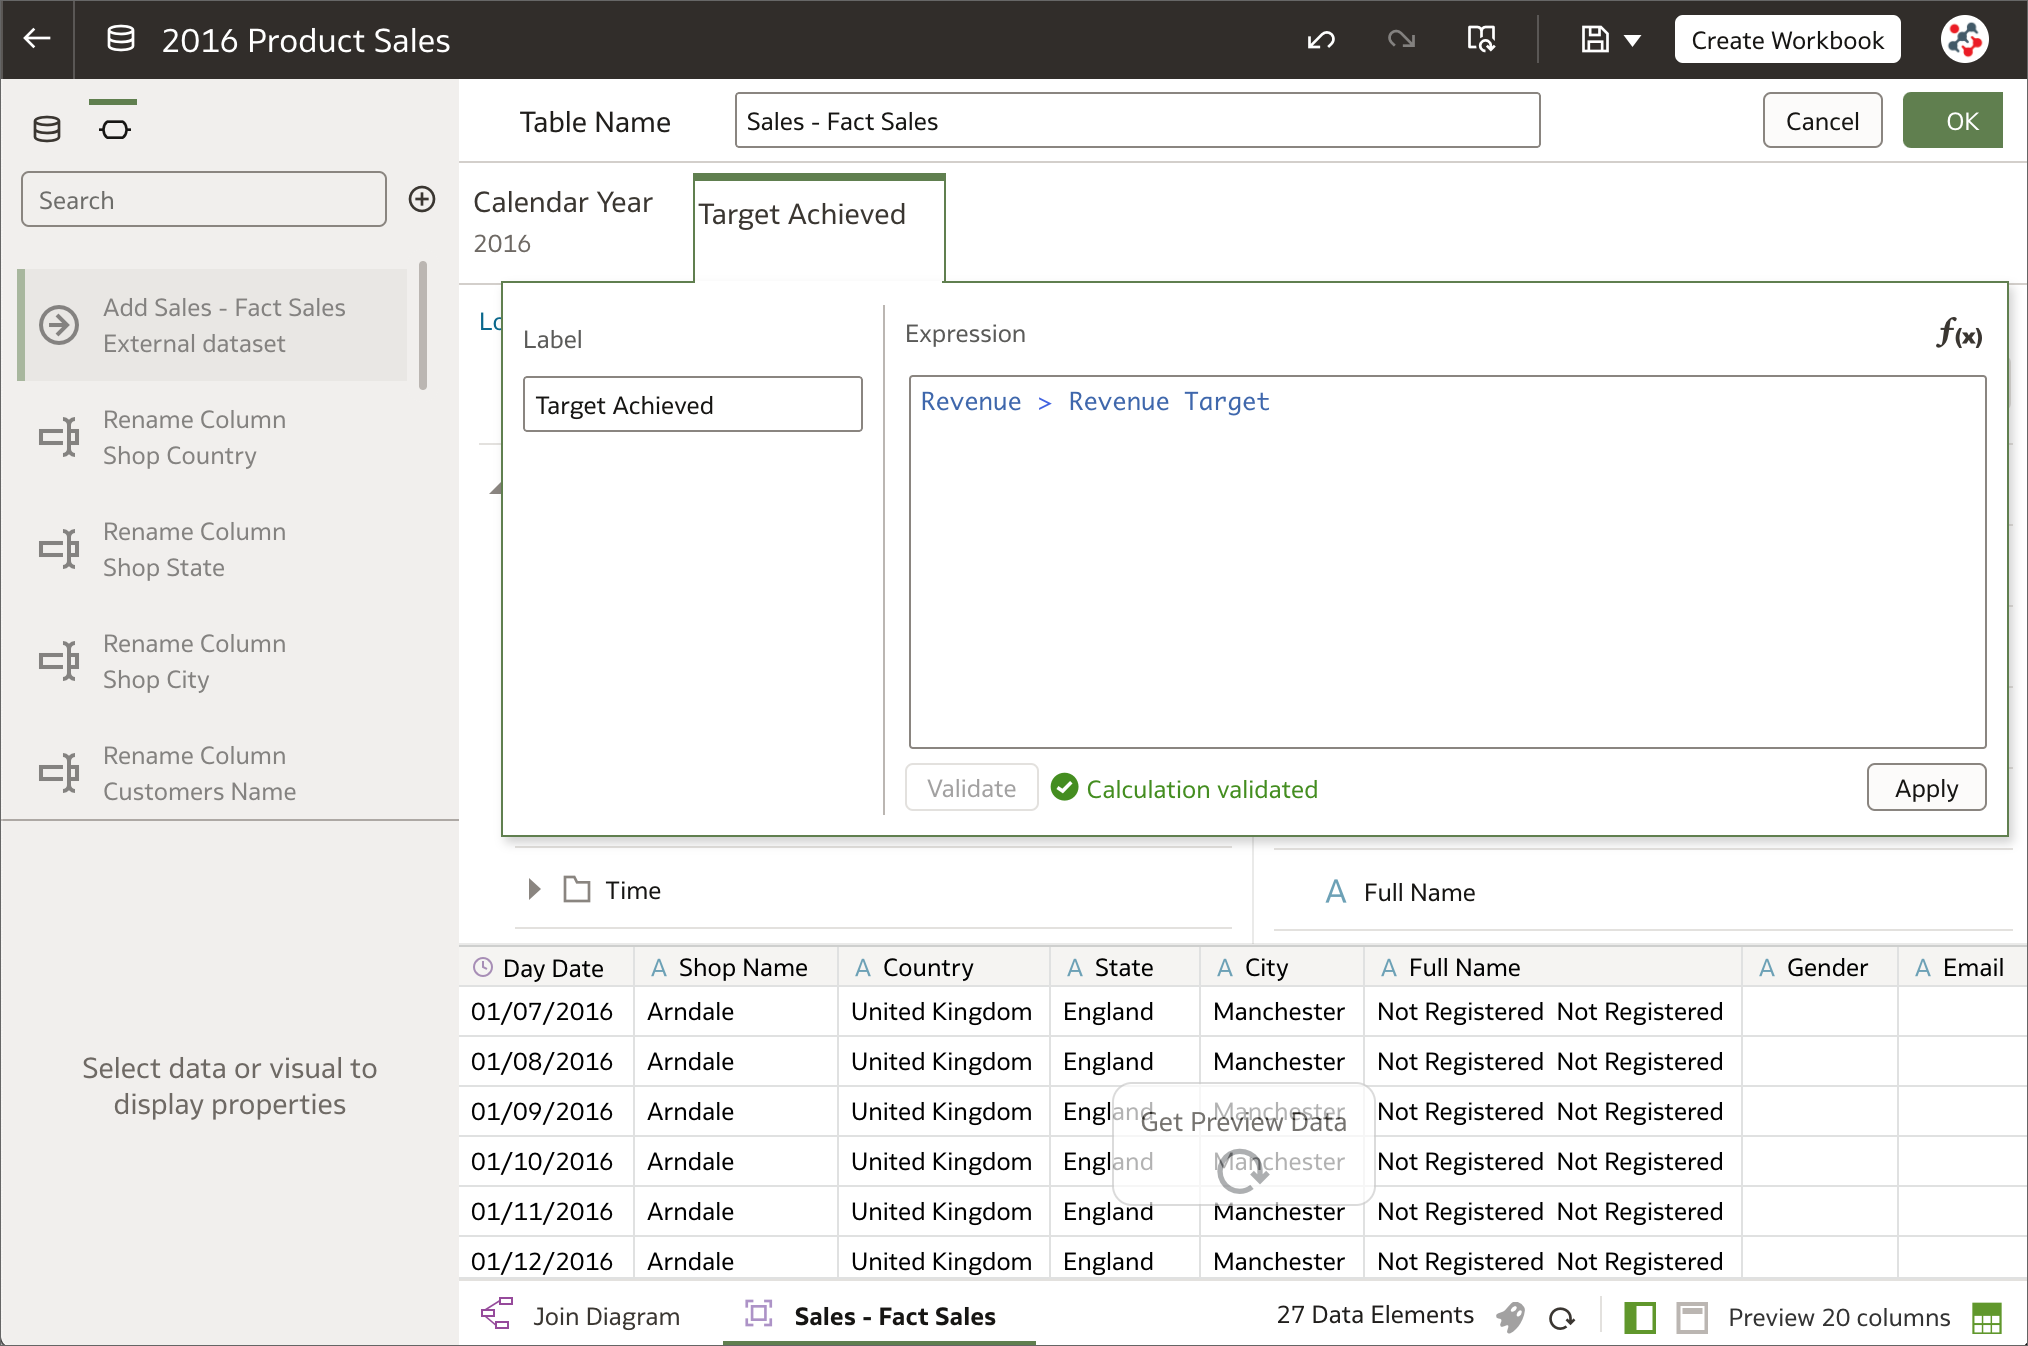
When a column is added to a dataset from a database connection or a subject area, all of the column values are included in most cases. Columns can be filtered so that the dataset contains only the rows needed, but it was not possible to filter on expressions in OAS 5.9. More complex filters are now supported by using expression filters. They must be Boolean (that is, they must evaluate to true or false) and can reference zero or more data elements.
8. Select multiple columns/visualizations for editing
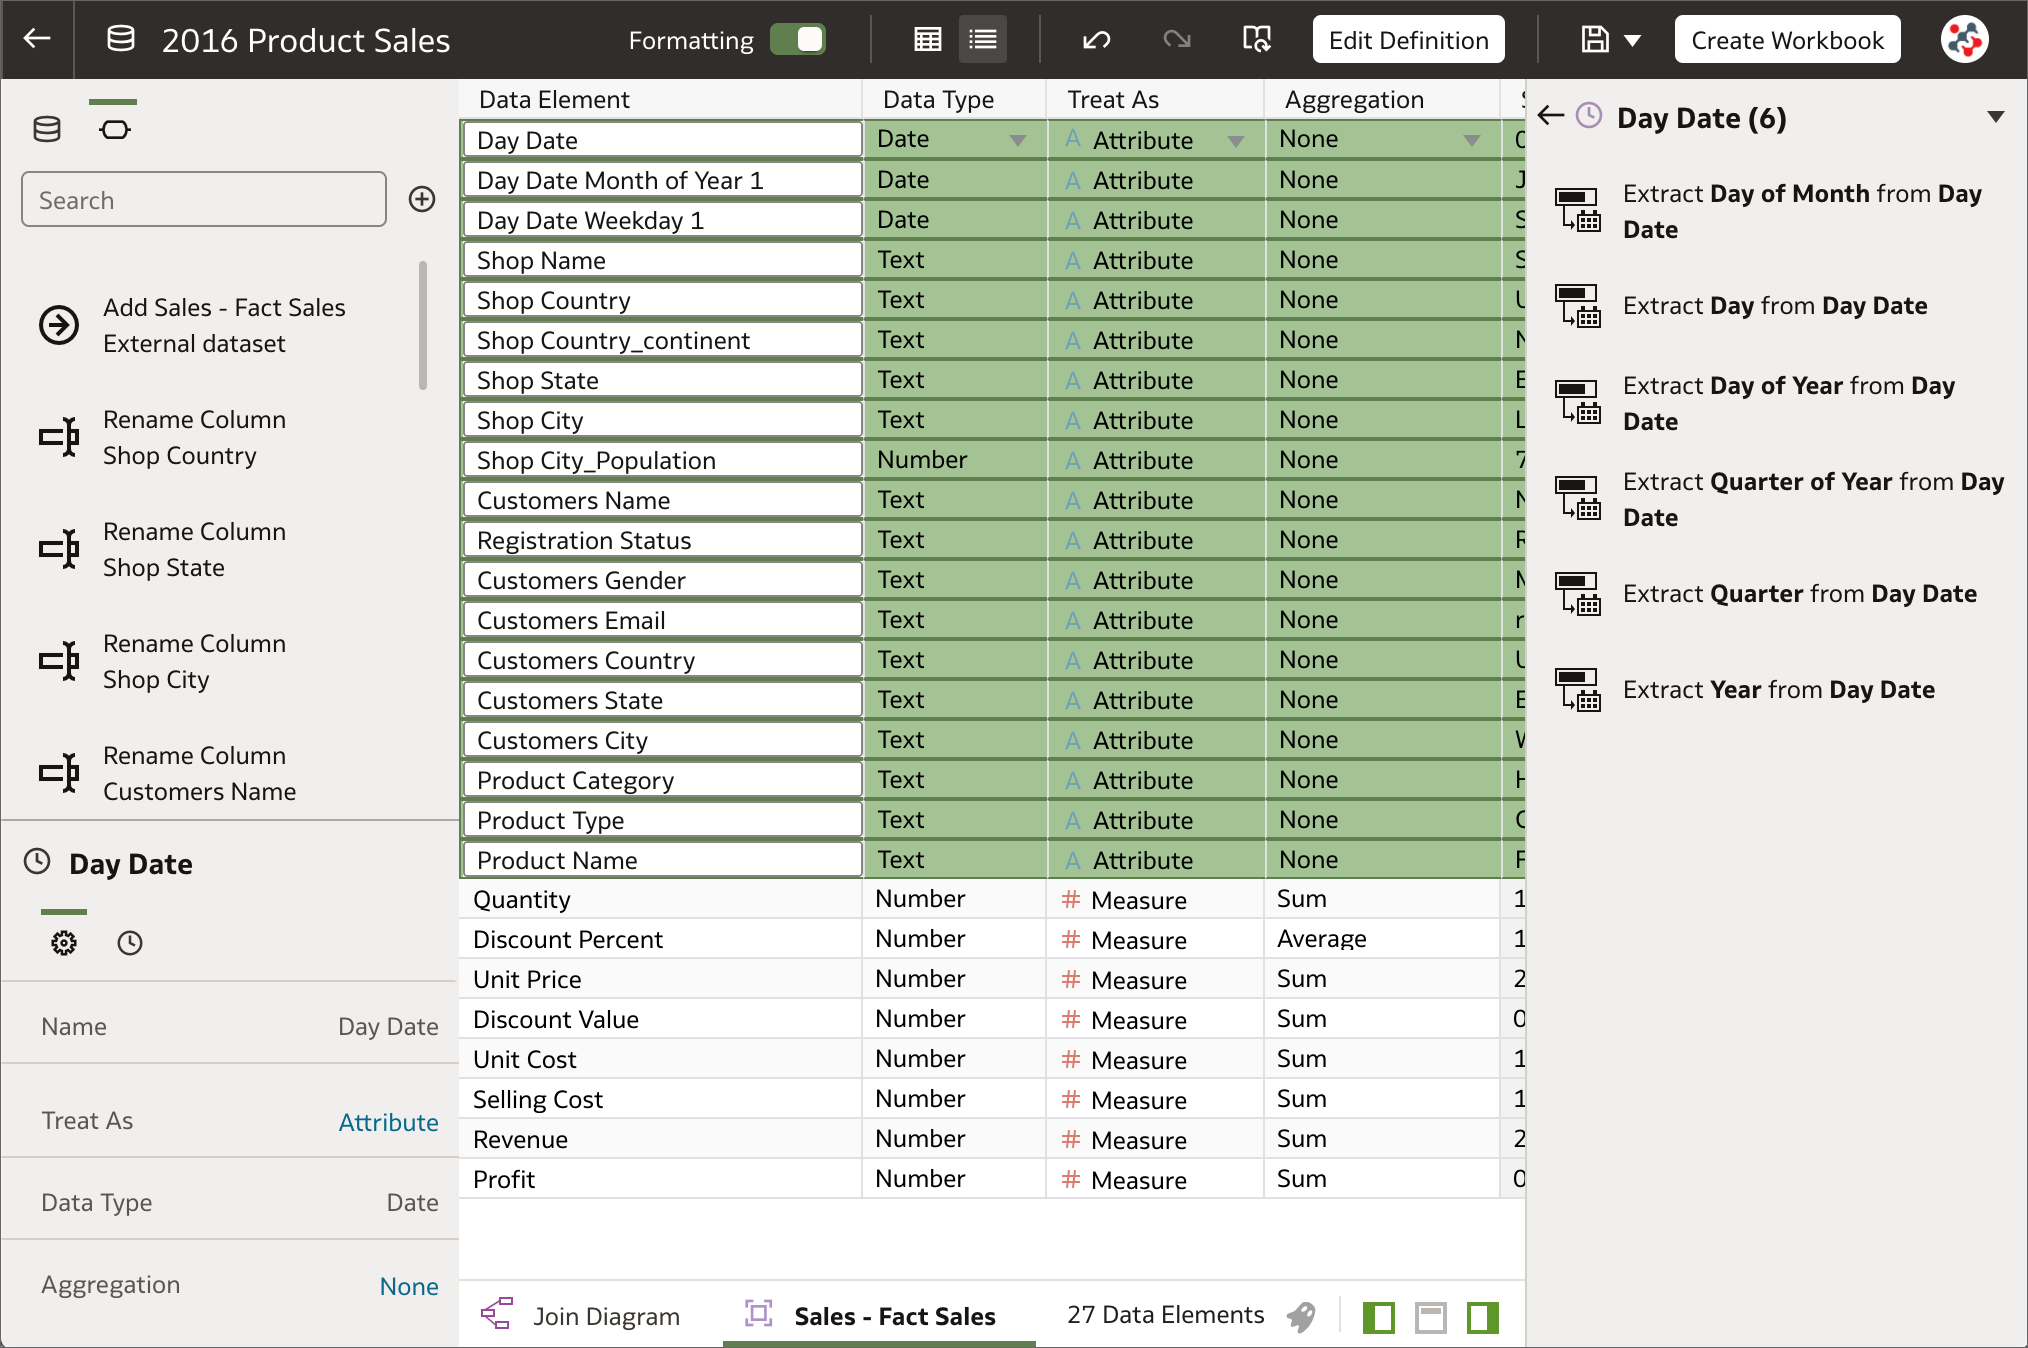
In the Metadata view of the Dataset Editor multiple columns can be selected to change settings (Data Type, Treat As, Aggregation and Hide) for more than one column at once. This is not yet possible in the Data view, properties of one column at a time can be configured. In a similar way, multiple visualizations can be selected on a workbook to easily change shared properties, copy and paste, and delete them. These two new features will surely allow users to save time when changing settings for multiple objects.
7. Automatic refresh of visualizations
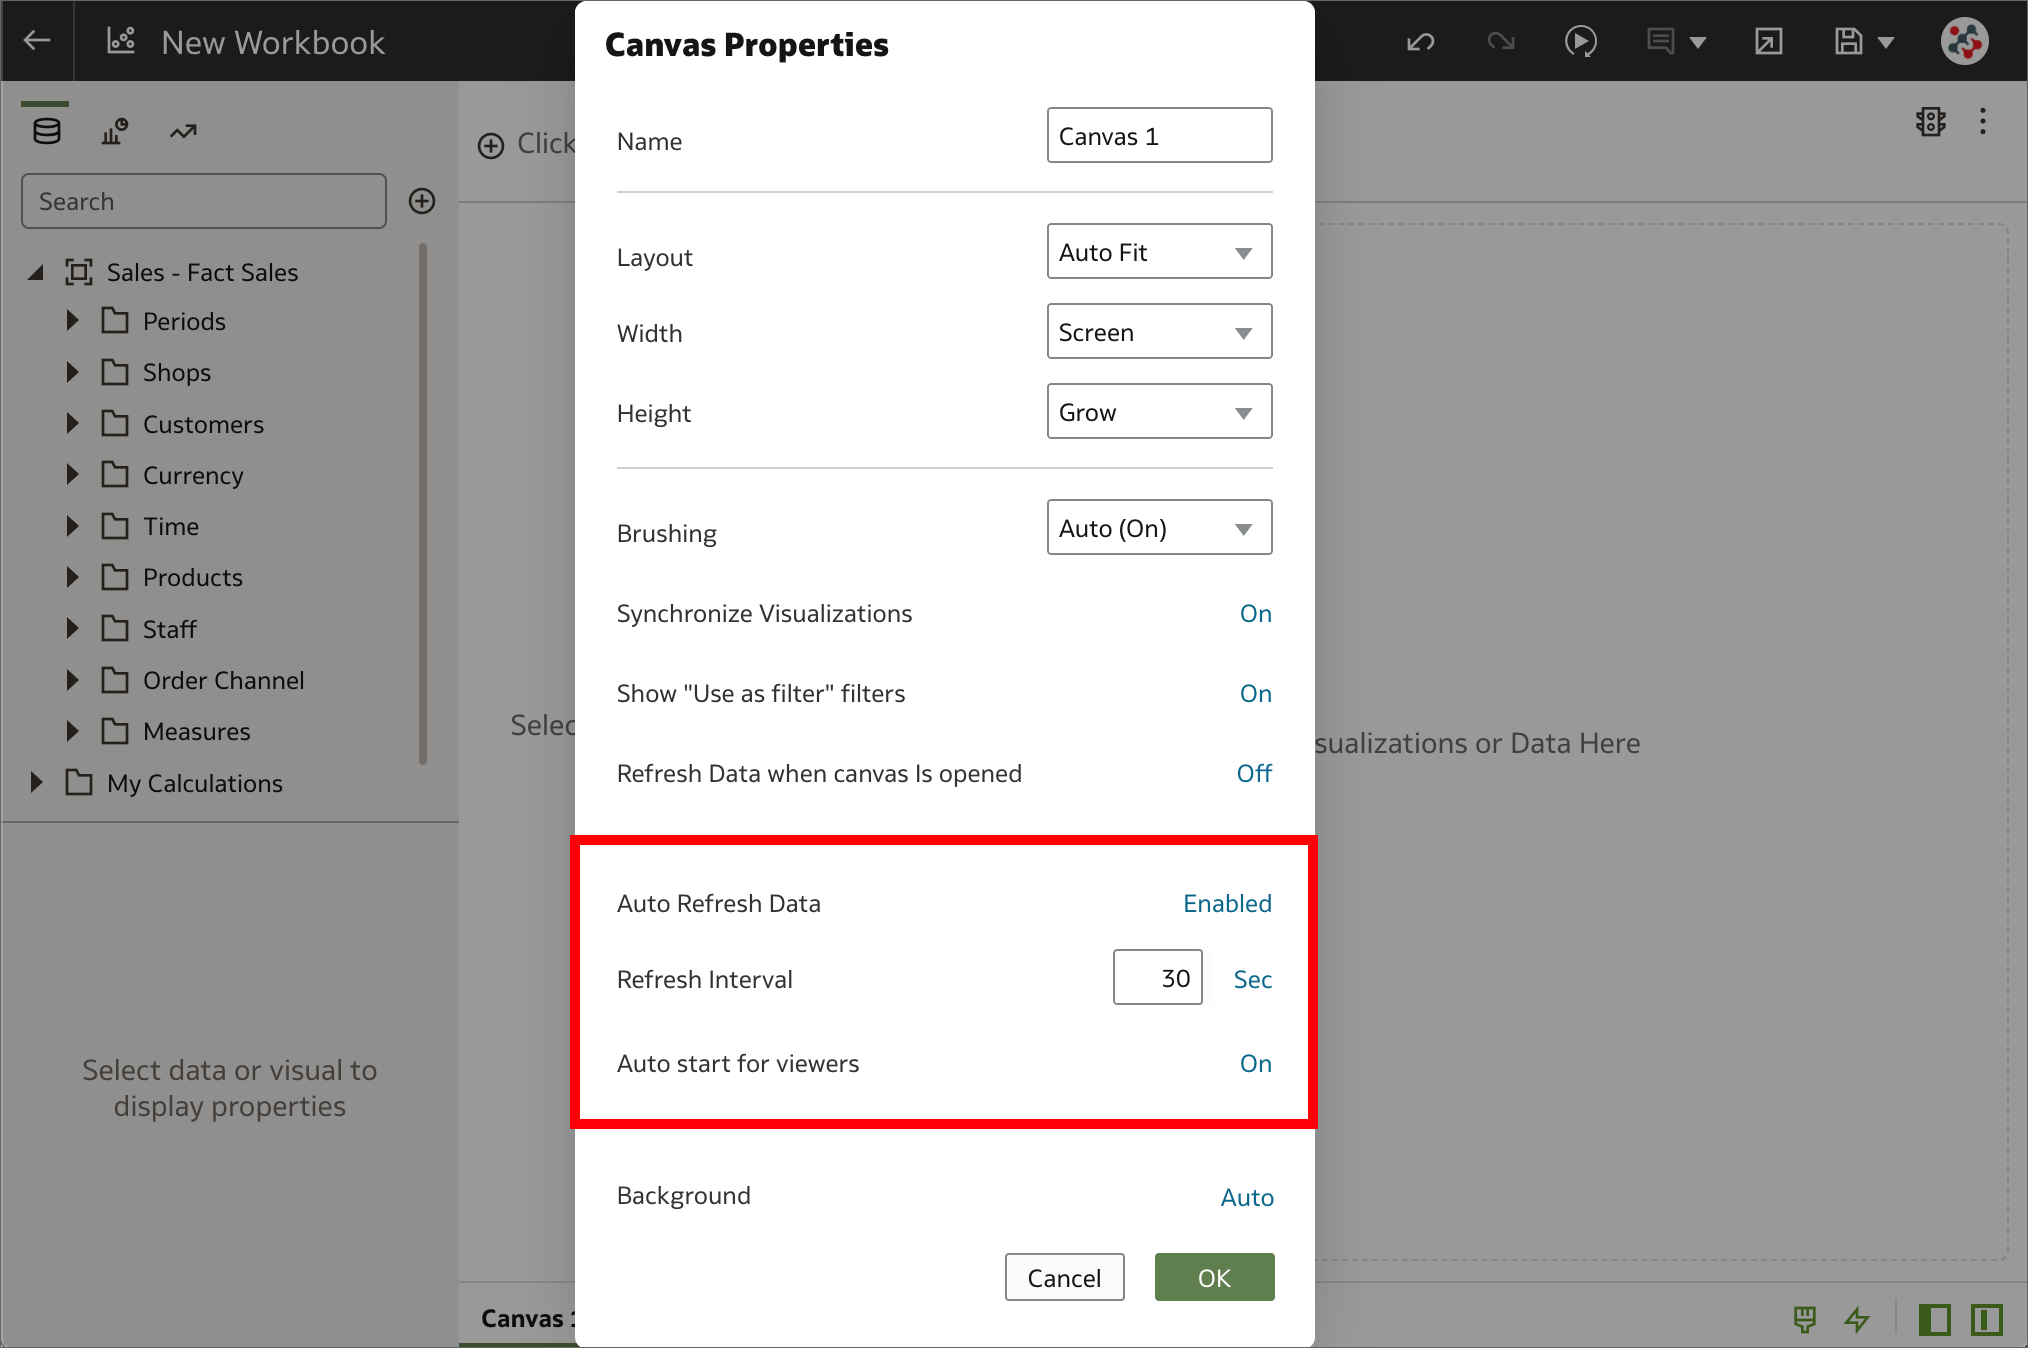
Data in workbooks can now be automatically refreshed at a specified interval to ensure that the visualizations contain the most current data. It's sufficient to right-click on a canvas tab, select Canvas Properties and set Auto Refresh Data to Enabled to automatically refresh the data using a given Refresh Interval. Please note that this operation does NOT trigger a data cache reload. If a dataset table's access mode is set to Automatic Caching, then the table re-queries the cached data that could be stale.
6. Custom knowledge recommendations
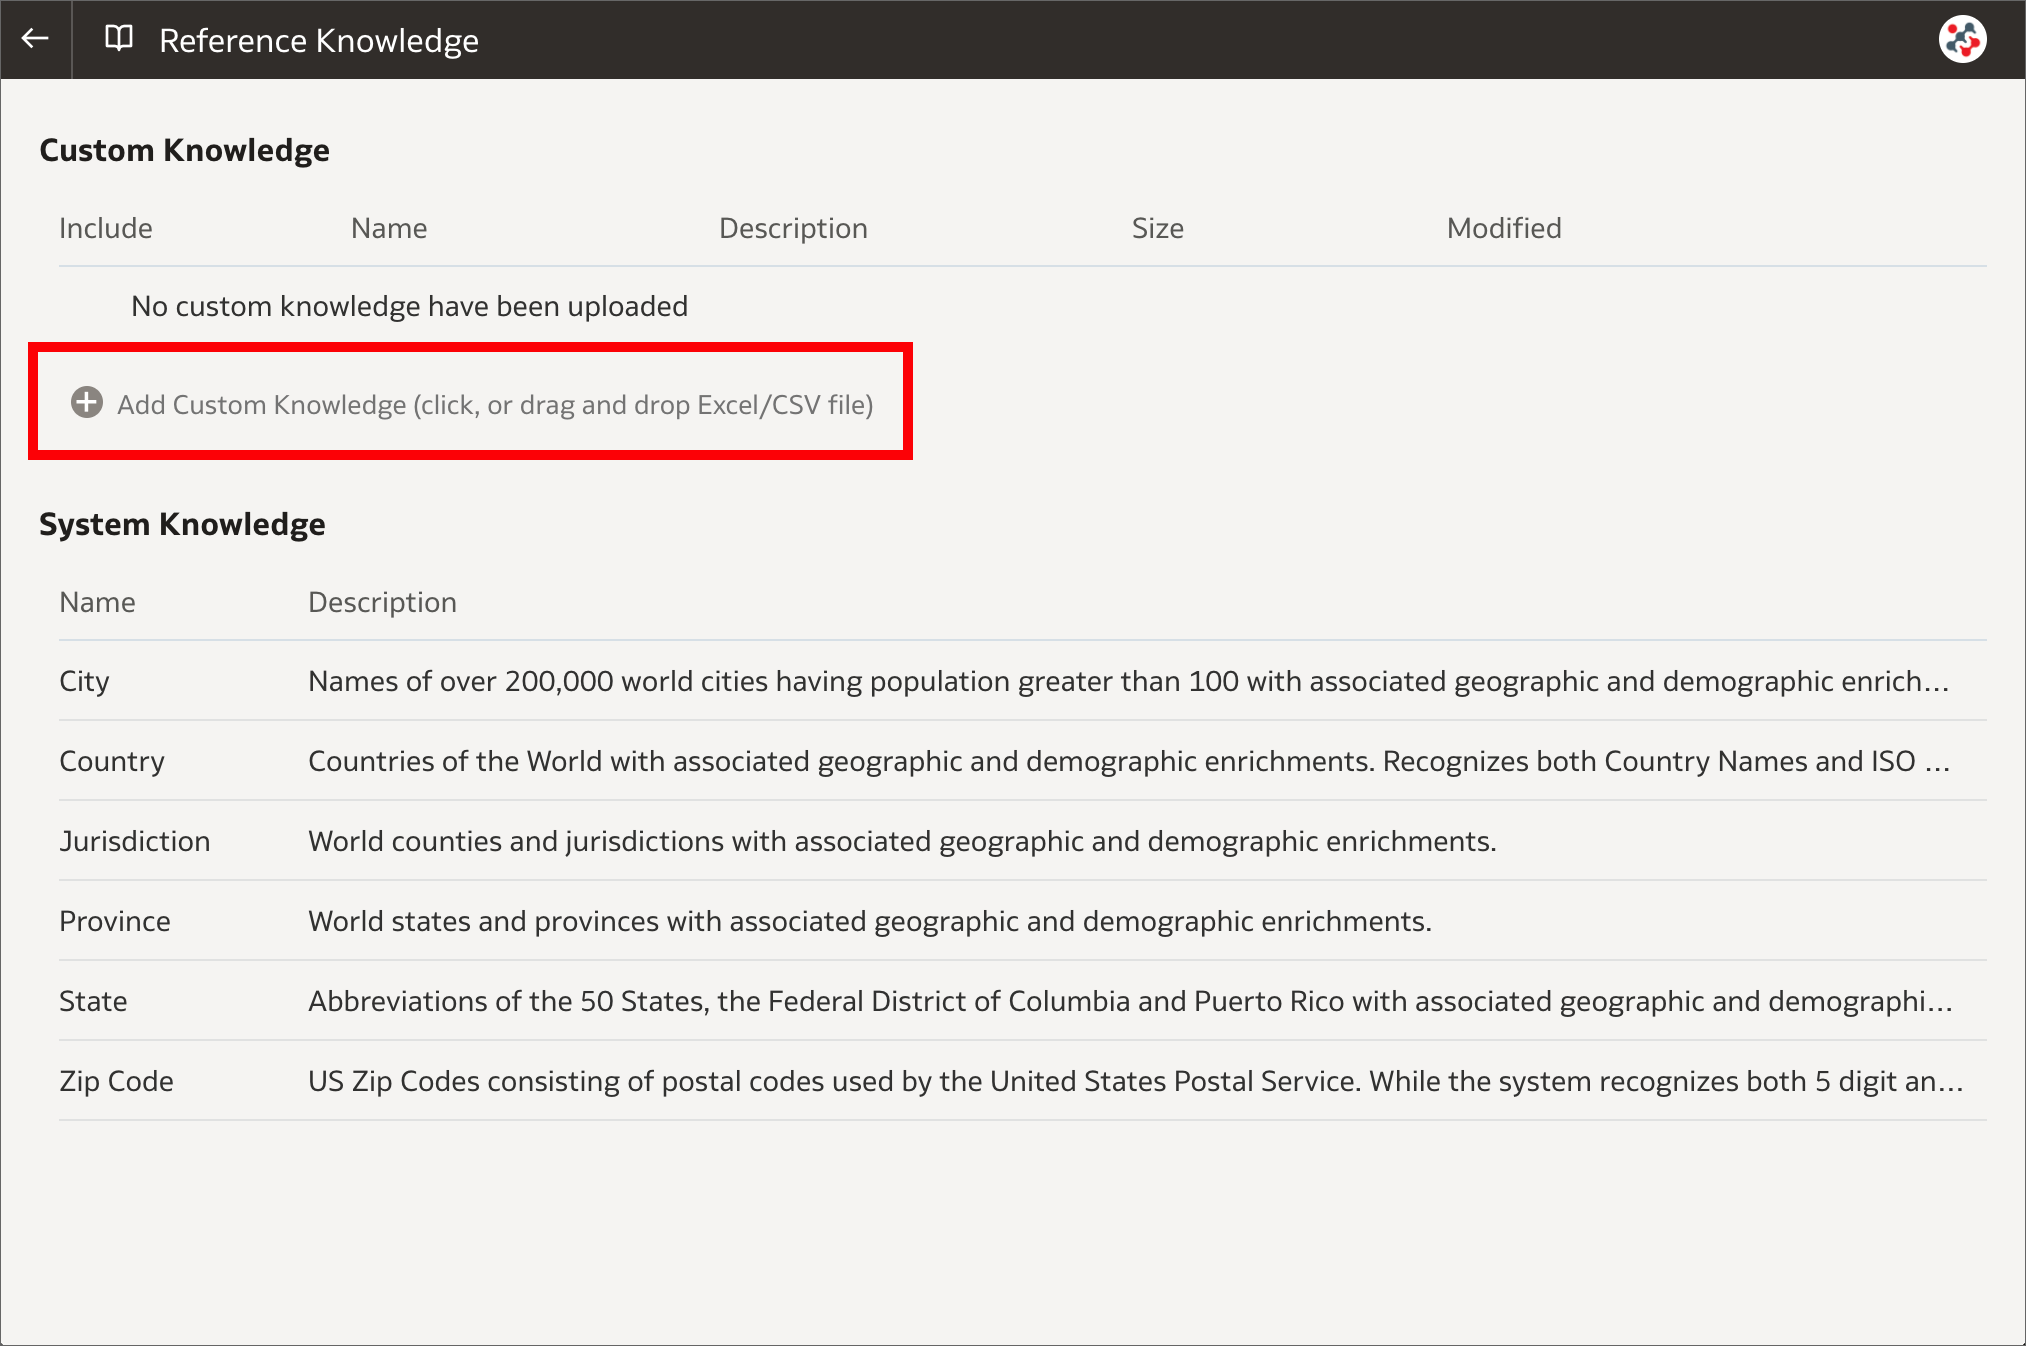
After creating a dataset, the dataset undergoes column-level profiling to produce a set of semantic recommendations to enrich the data. These recommendations are based on the system automatically detecting a specific semantic type (such as geographic locations or recurring patterns) during the profile step. In OAS 6.4 custom knowledge recommendations can be used to augment the system knowledge by identifying more business-specific semantic types and making more relevant and governed enrichment recommendations. System administrators can upload custom knowledge files using the new Reference Knowledge section in Data Visualization Console. Custom knowledge files must be in CSV or Microsoft Excel (XLSX) format, contain keys to profile the data in the first column, and enrichment values in the other columns.
5. Data quality insights
OAS 6.4 automatically analyzes the quality of the data in the Dataset Editor, and provides a visual overview known as a quality insight in a tile above each column. Quality insights allow to explore data in real time using instant filtering, evaluate data and identify anomalies and outliers, replace or correct anomalies and outliers, and rename columns.
4. Developer Options
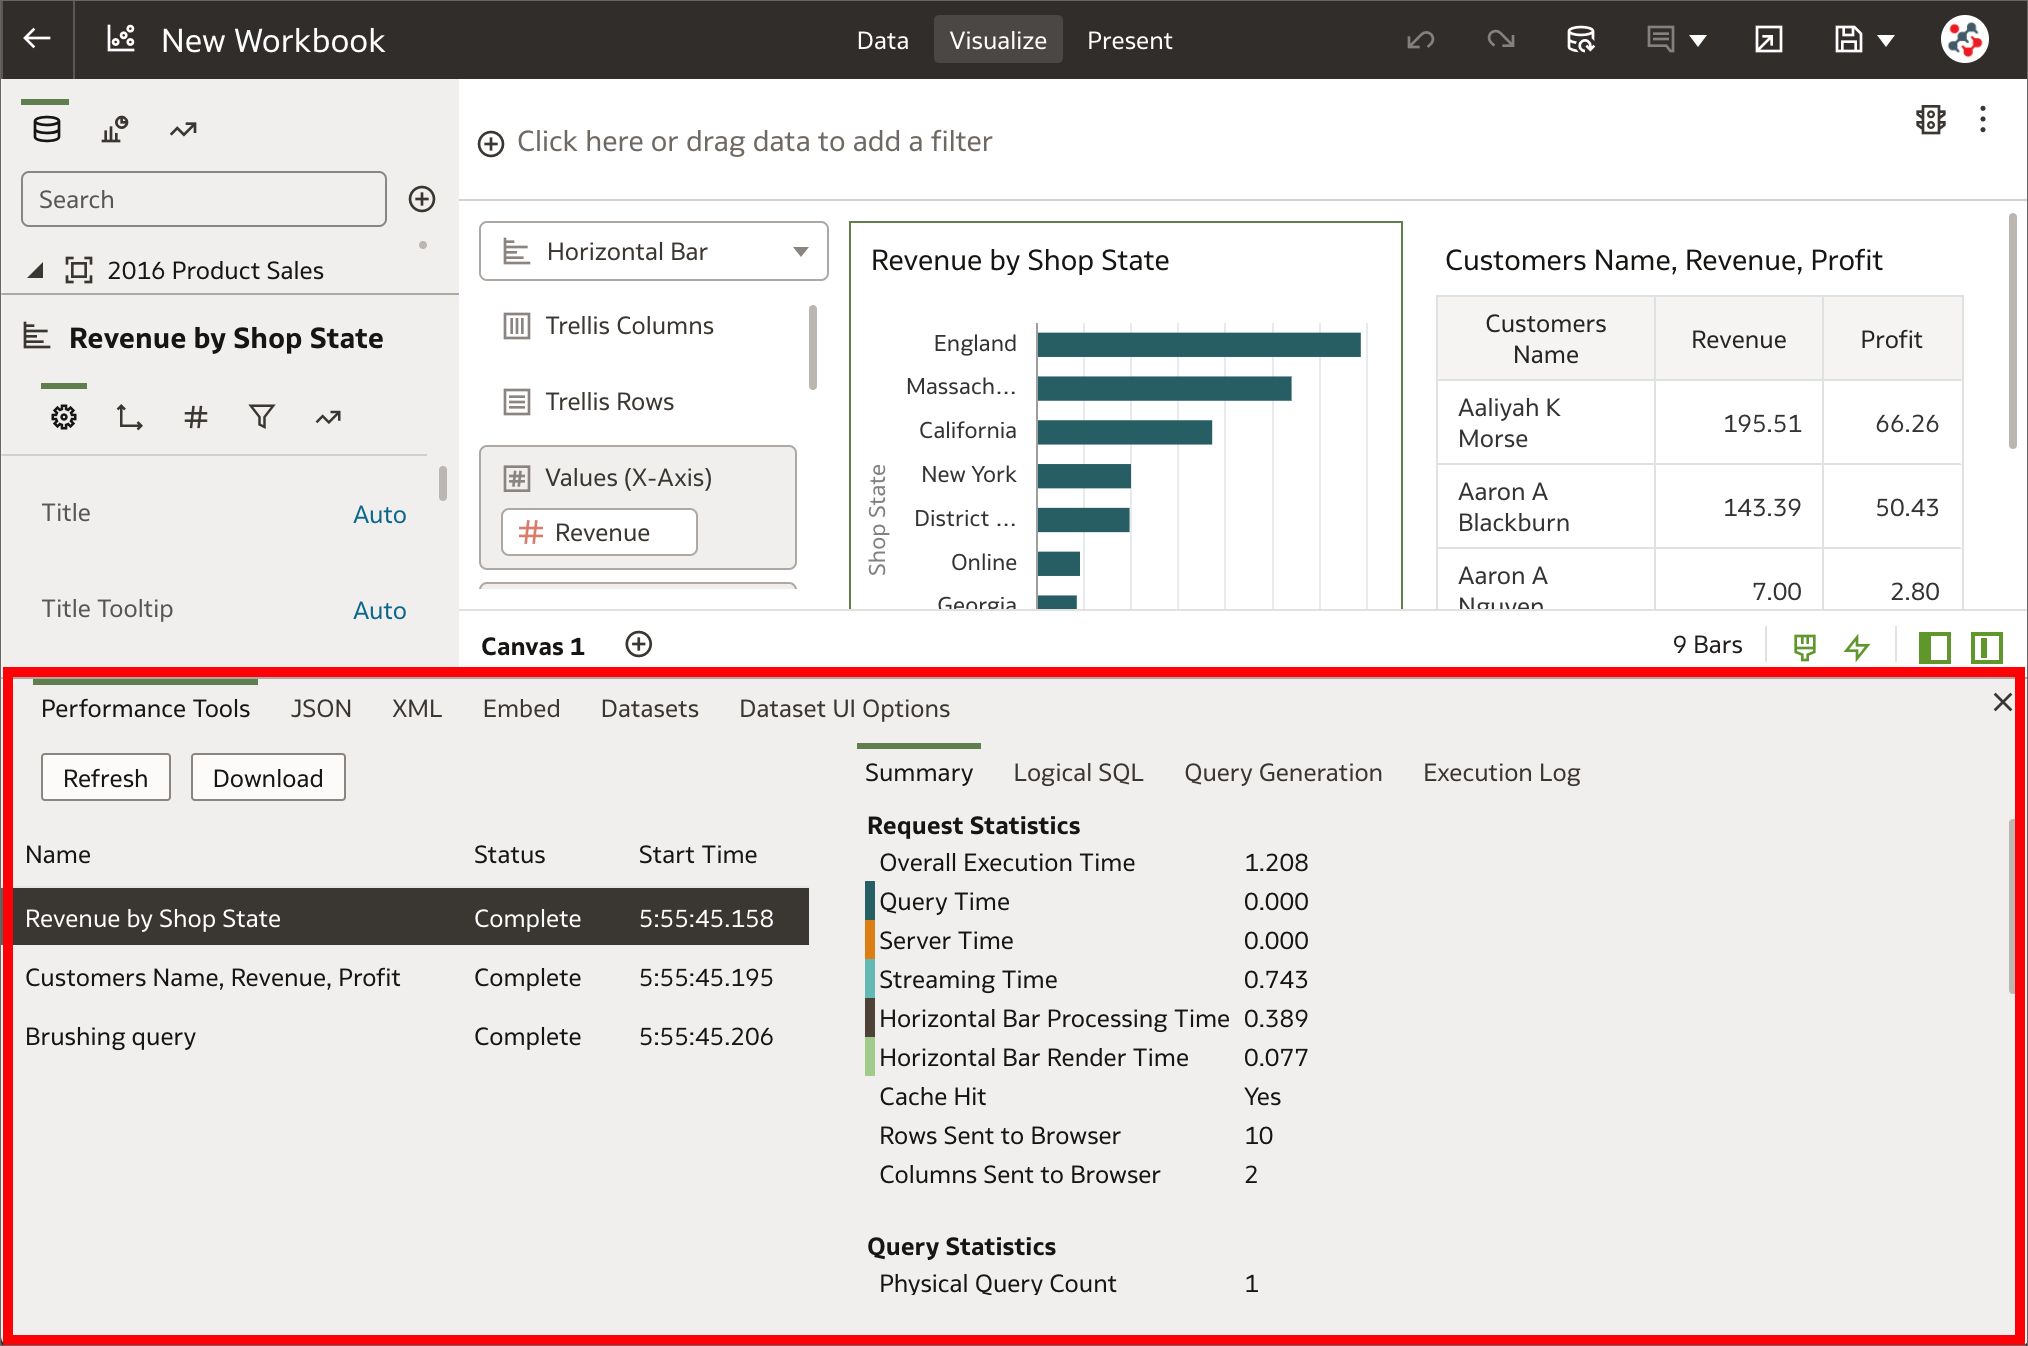
In Data Visualization, built-in developer options are now available to embed content in other applications and analyze statistics such as query time, server, and streaming time for visualizations in workbooks. Users with administrator or content author privileges can display developer options by appending &devtools=true to the URL of a workbook in the browser.
3. Conditional formatting
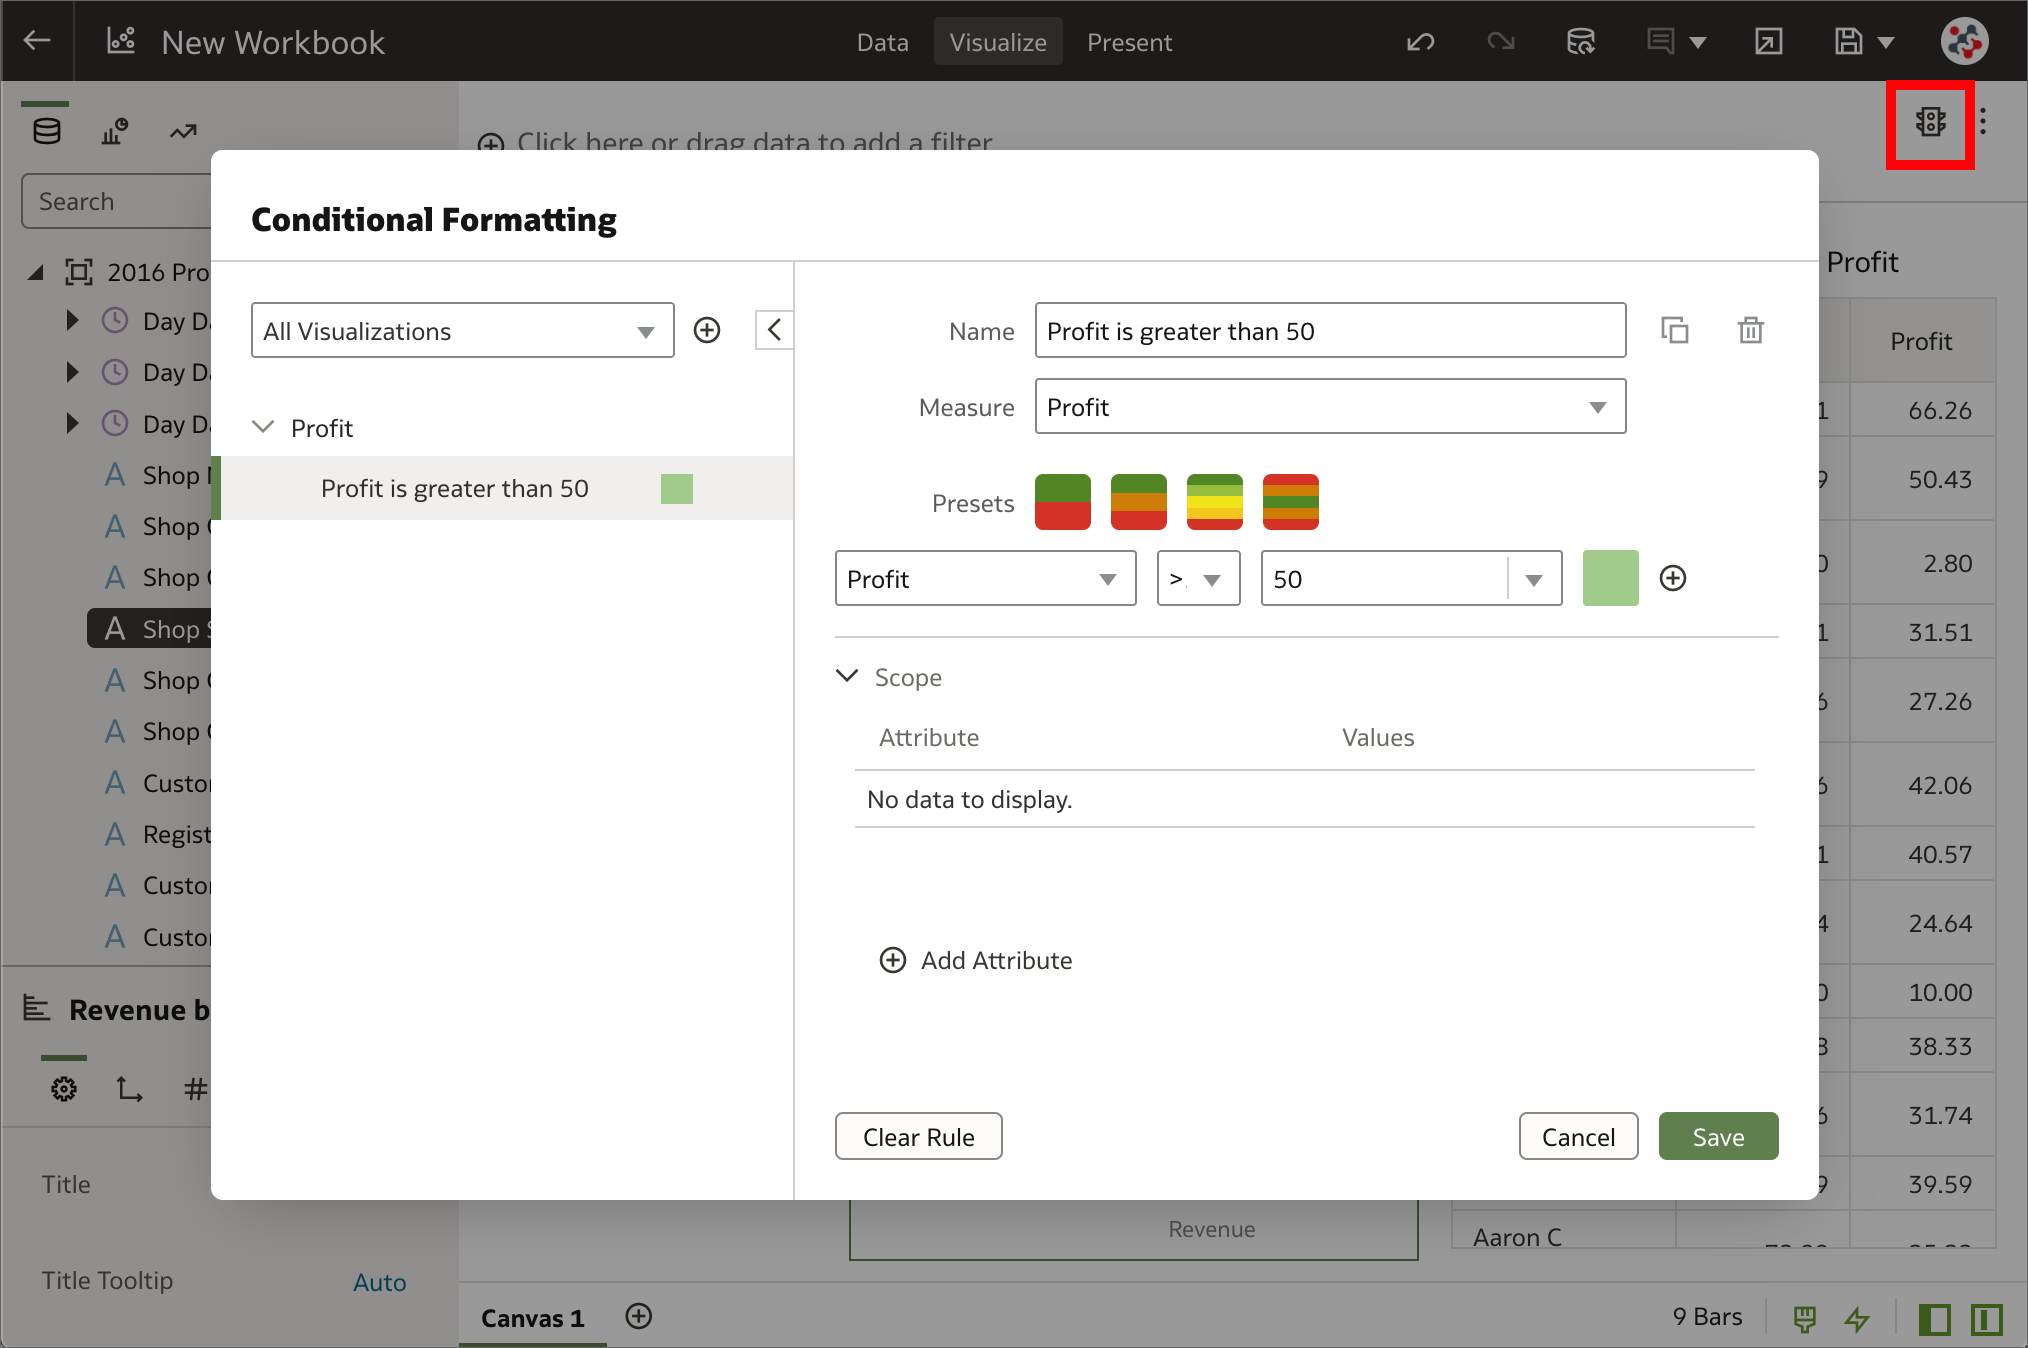
How can conditional formatting be applied to workbooks in Data Visualization similar to the way it can be applied to analyses in Analytics (Classic)? This is frequently asked in Data Visualization training and the answer used to be that the feature was not available - a workaround was required to achieve something similar (e.g. by dragging a conditional expression to the color drop target and changing the color assignments as required). In OAS 6.4 it's now possible to highlight important events in data in a proper manner by clicking on the Manage Conditional Formatting Rules icon in the visualization toolbar.
2. Reload datasets on a schedule
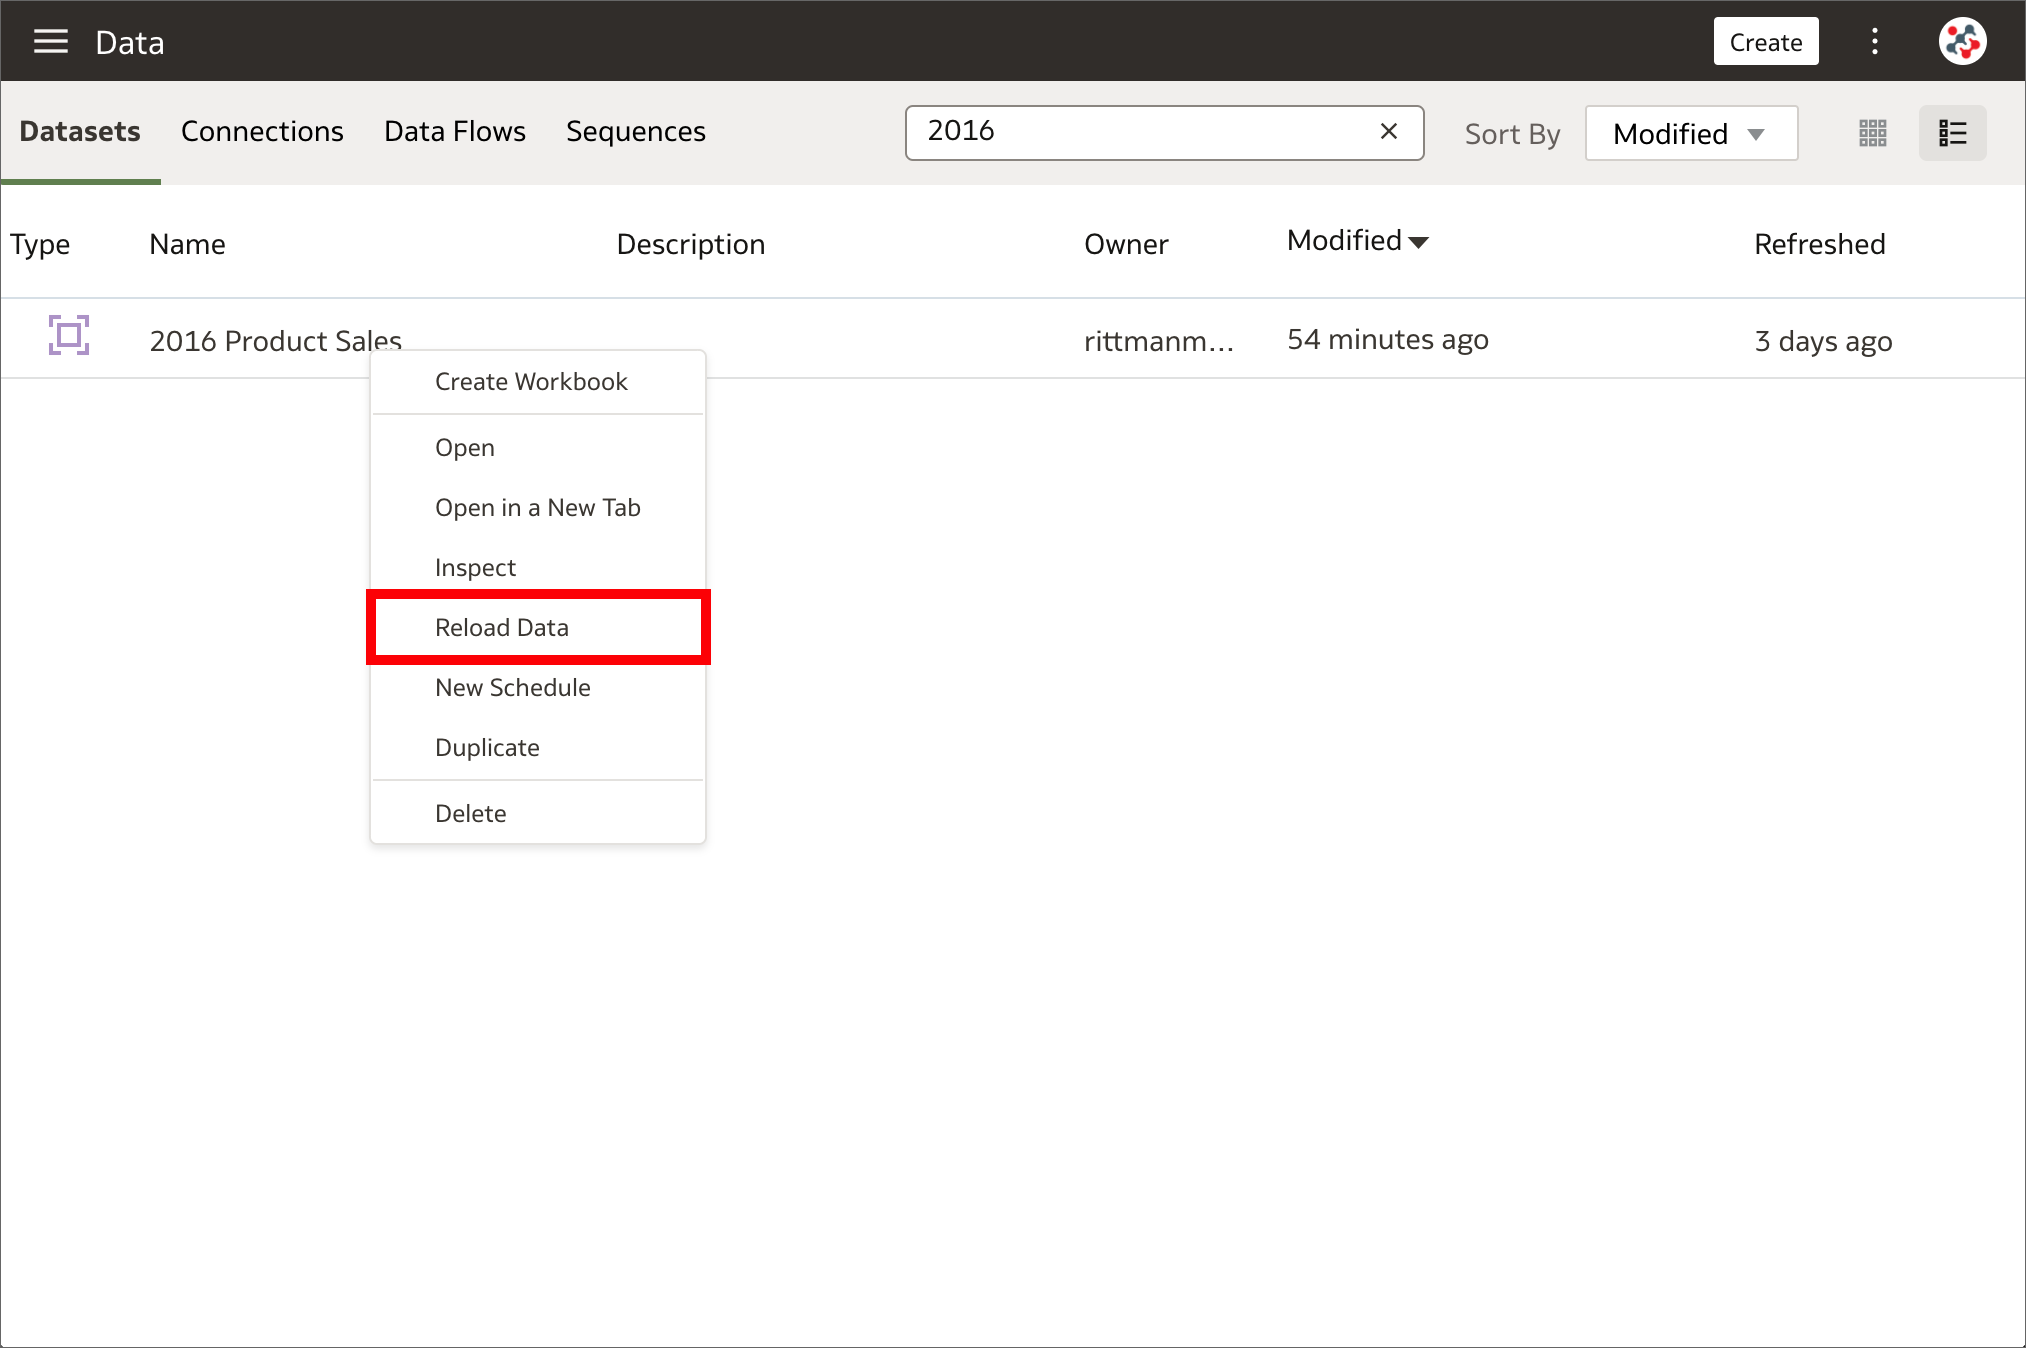
Reloading datasets ensures that they contain current data. When a dataset is reloaded and it contains one or more table with the Data Access property set to Automatic Caching, the dataset's SQL statements are rerun and the current data is loaded into the cache to improve performance. This has always been a manual process in the past, but now it can be automated by creating a one-time or repeating schedule to reload a dataset's data into the cache. The New Schedule option has been added to the Actions Menu which appear by right-clicking on a dataset in the Data page. This option is NOT available for datasets that use only files or when data access for all tables is set to Live.
1. Datasets with multiple tables
In OAS 5.9 it was possible to create a dataset only with a single entity from a data source connection or a local subject area. This could have been a set of columns from a single table, when the Select Columns option was selected, or a more complex query with joins and native functions, when the Enter SQL option was used instead.
As downsides:
- Users without any SQL knowledge were not able to join tables in a dataset, or they had to run a data flow to join multiple datasets to achieve a similar result.
- It was always necessary to retrieve all columns from all tables in a complex query, even when only one was included in a visualization, and this resulted in potential performance issues.
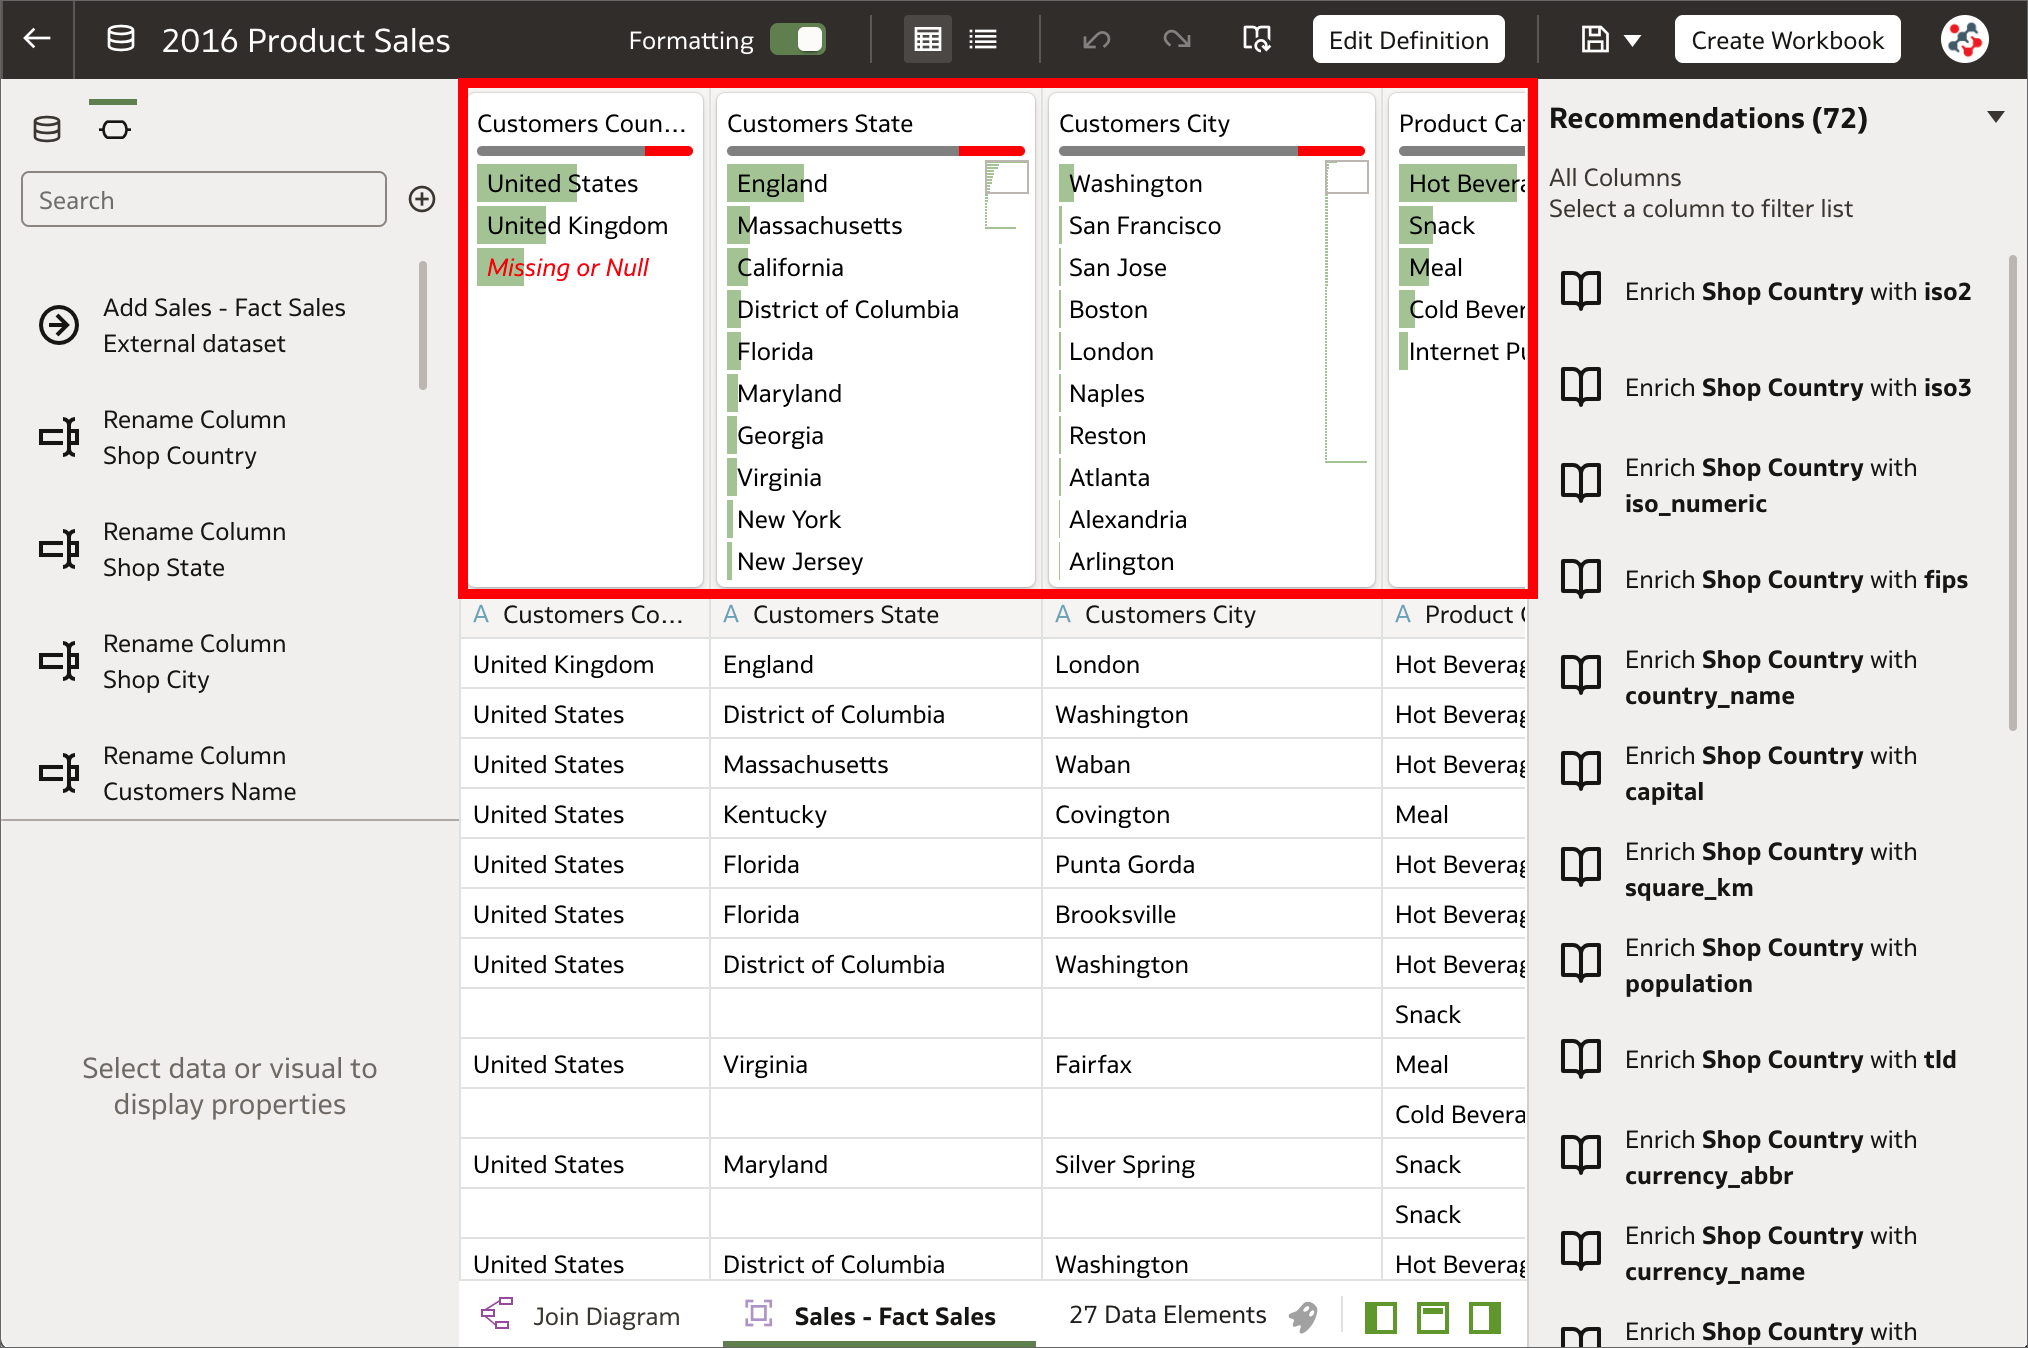
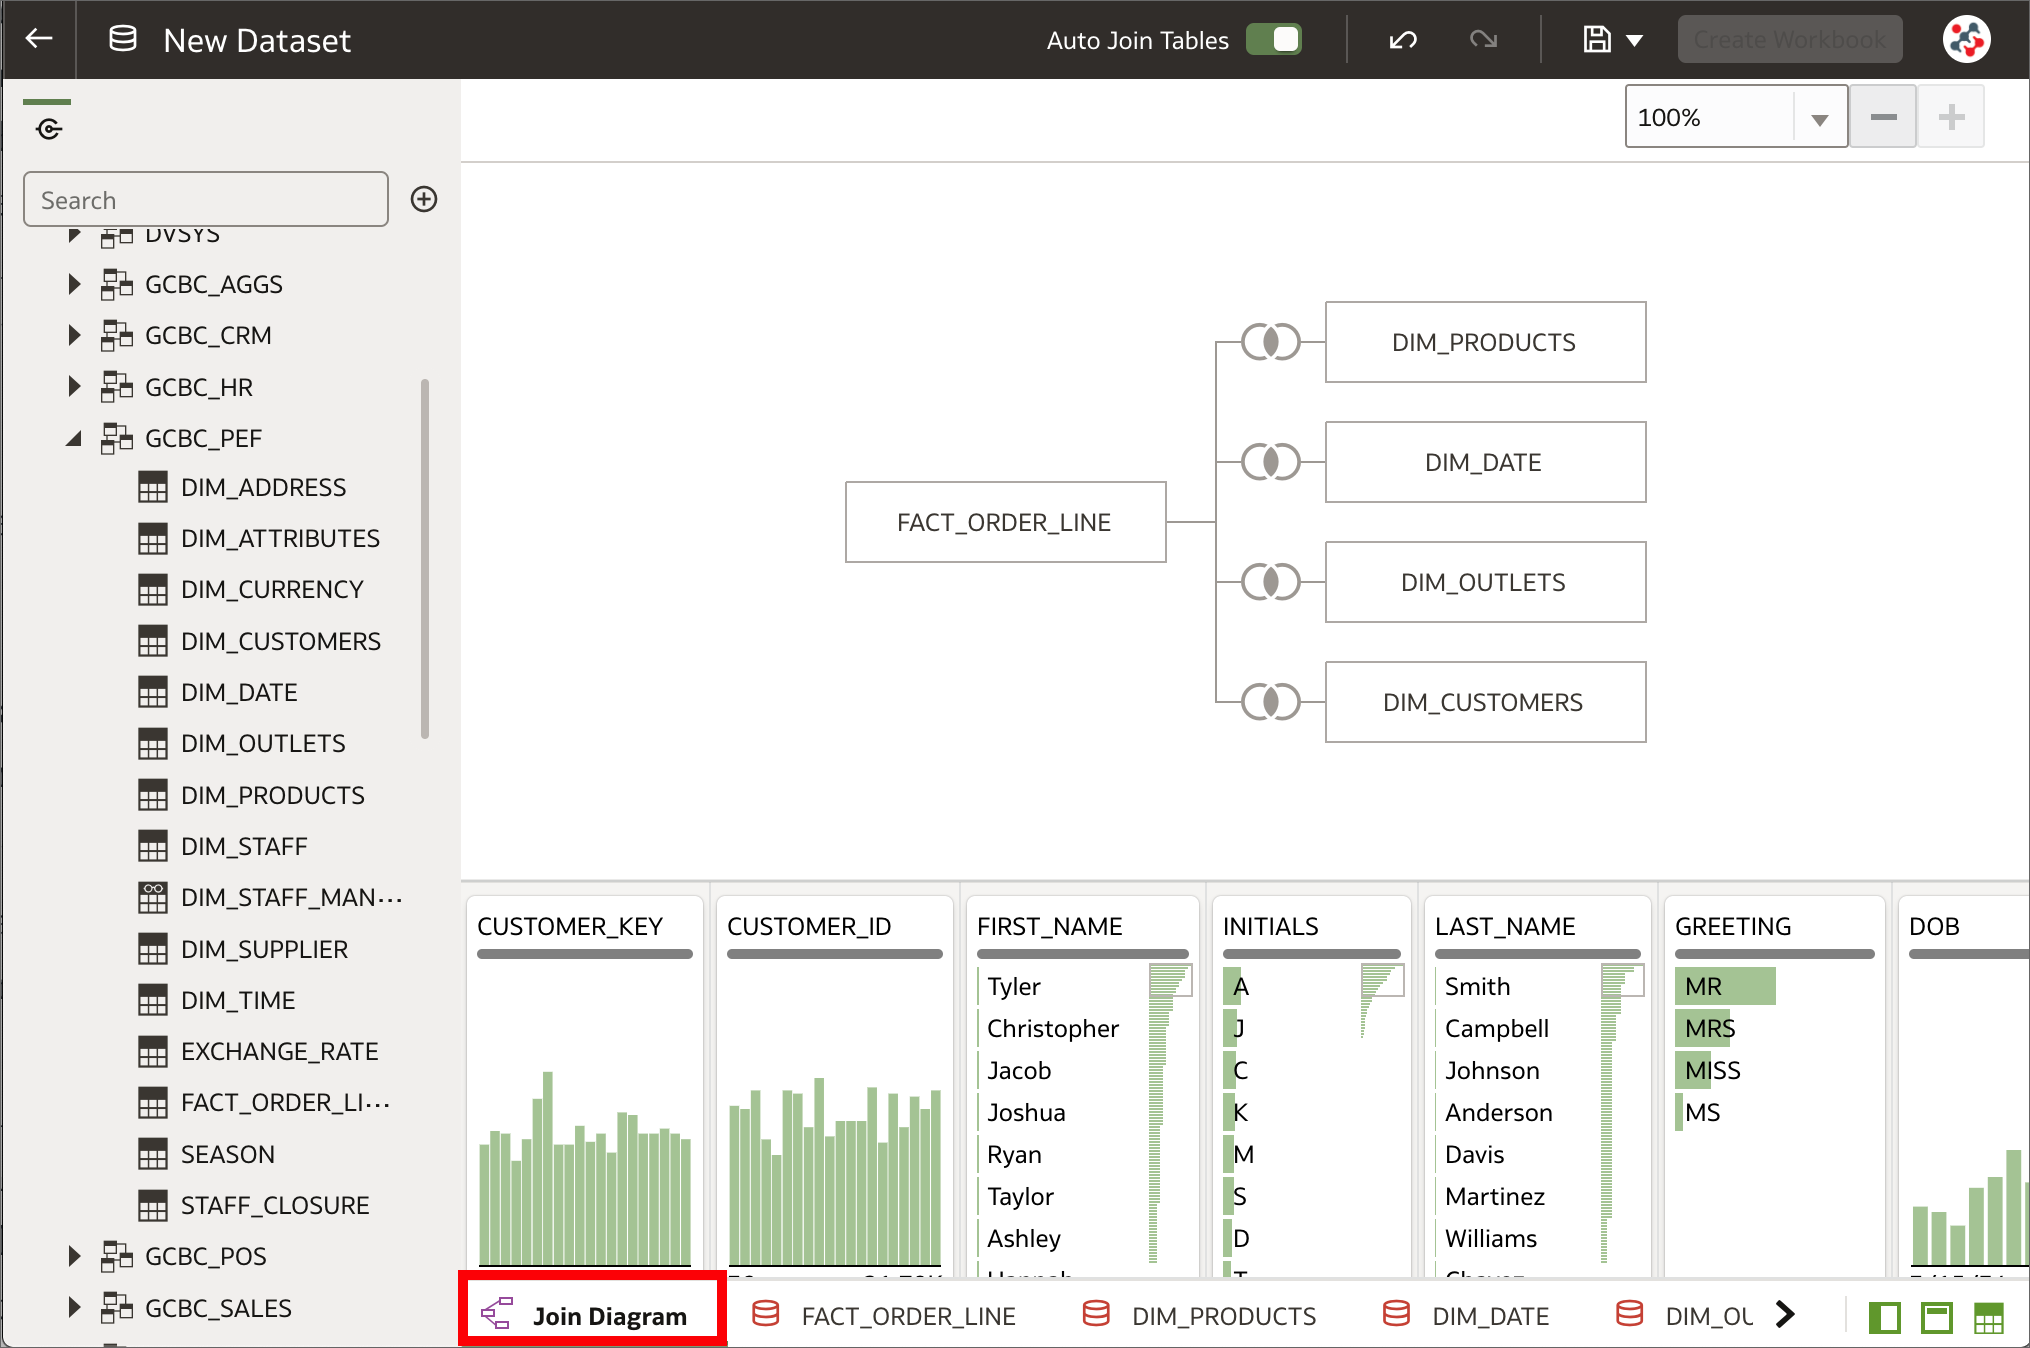
OAS 6.4 allows to perform self-service data modeling with datasets by adding multiple tables to a dataset from one or more relational data source connections or local subject areas. Not all the supported data sources can be used to create datasets with multiple tables. Please refer to Data Sources Available for Use in Datasets Containing Multiple Tables for a comprehensive list.
The Dataset Editor contains a new Join Diagram pane which displays all of the tables and joins in the dataset. When tables are dragged and dropped to the Join Diagram, joins are automatically added if they are already defined in the data source and column name matches are found between the tables. It's possible to prevent this default behaviour and define joins manually by switching off the Auto Join Tables toggle button in the Dataset Editor.
When creating datasets with multiple tables, Oracle recommends to:
- Add to the dataset the most detailed table first (a fact table when data are dimensionally modeled) and then all remaining tables that provide context for the analysis.
- Create a dataset for each star schema and use data blending to analyze data based on two star schemas.
OAS 6.4 treats datasets with multiple tables as data models in that only the tables needed to satisfy a visualization are used in the query. This is surely the best new feature of this release and represents a valid alternative to model data in the Metadata Repository (RPD) for users interested only in the Data Visualization tool.
Conclusion
OAS 6.4 includes an incredible amount of new features and the Data Visualization tool has been significantly improved. The support to datasets with multiple tables alone is worth the upgrade as it allows to define complex and structured datasets without impacting performance.
If you are looking into OAS 6.4 and want to find out more, please do get in touch or DM us on Twitter @rittmanmead. Rittman Mead can help you with a product demo, training and assist within the upgrade process.