OAS / DV & HR Reporting (A Learning Experience Part 2)

Until recently as a relative newbie to Oracle Analytics Server (OAS) and Oracle Data Visualisation (DV) myself, I was keen to share with you this learning experience.
If you are a HR professional, or you work supporting HR with data and reports, this blog is aimed at you. My intention was, that you could use these two blogs (part 1 and part 2) as a guide to get your own local working OAS copy. You could also load in your own HR data into the system to make the experience more relatable. You could start working with HR data and quickly create some HR data visualisation reports. You could begin to build a business case for moving any current OBIEE system to OAS based on your findings. Even if you don't use OBIEE, OAS may well be worth a look.
This is not a sales pitch for OAS, more to show how you can get OAS up and running with some HR data and make up your own mind about it. You can also to use the system to engage with others who may be interested. In addition the content should freely available to you if you have My Oracle Support.
Firstly as a recap, in Part 1 of this blog, I created a stand alone Oracle database and OAS system using Docker. I connected my local OAS instance to an Oracle database which contained an Oracle HR sample schema. Using the HR schema, I created an OAS HR dataset. I then used the HR dataset (the actual data!) to create some Basic HR visualisations (reports!). In Part 1 of the blog I focused on the newer business intelligence Data visualisation tools and data self-serve facility OAS (akin to Microsoft Power BI Desktop).
Hopefully if all that makes sense, so far so good!
Is this blog (Part 2) I am going old school. What if I want to leverage my existing HR OBIEE developments and recreate / migrate my existing BI subject areas to OAS and write the BI reports in OAS with the same interface OBIEE uses. What if i want to move my current HR BI Publisher reports into OAS? In addition what if i want to mix and match all the visualisations and BI reports in OAS. DV/Classic BI/BI Publisher etc on a BI Dashboard.
Can I do all of this?
Answer: Yes
In this blog are the the steps I took to prove it.
Firstly, how can I re-use an existing OBIEE schema and data in OAS?
The HR professionals my be less interested in the BI technical side might glaze over in this part of the blog! however, they will be interested in knowing if they have existing BI reports, these are going to transition and work fine in OAS with the minimum of fuss. Assuming I already use OBIEE, and have already have my HR subject areas set up. How do I get these into OAS so I can report on it?
Maybe I want to create new OAS visuals using this HR subject area to get some additional functionality thrown in for the effort involved.
1) My existing OBIEE repository is currently working against a local OBIEE 12c install and local Oracle database instance I created a while ago. We have already used this same HR Oracle sample schema in Part 1 of the blog to create visualisations in OAS. It would be interesting to see once I get the HR subject area working in OAS and write the reports that they reconcile back to the OAS reports that i created in Part 1 of the blog! after all I don't want to remodel the data again thats the point of doing this exercise and the same may be the case for you if you are thinking of a move from OBIEE to OAS.
Firstly I needed to get hold of the OAS repository from the OAS server copied locally. Then I can edit it with the BI Administration tool and add in the HR schema from my existing OBIEE repository.
To get access to the OAS642 container in docker
Docker exec -it oas642 bash
Then cd /opt/oracle/config/domains/bi/bitools/bin
Run the datamodel download script to get hold of the OAS repository.
./datamodel.sh downloadrpd -O /home/oracle/oas642.rpd -W Admin123 -SI ssi -U weblogic -P Admin123
Now I can locate oas642.rpd in home/oracle.
I renamed the original OAS repository before I made any changes to it just so I retained an original copy locally.
mv oas642.rpd oas642orig.rpd
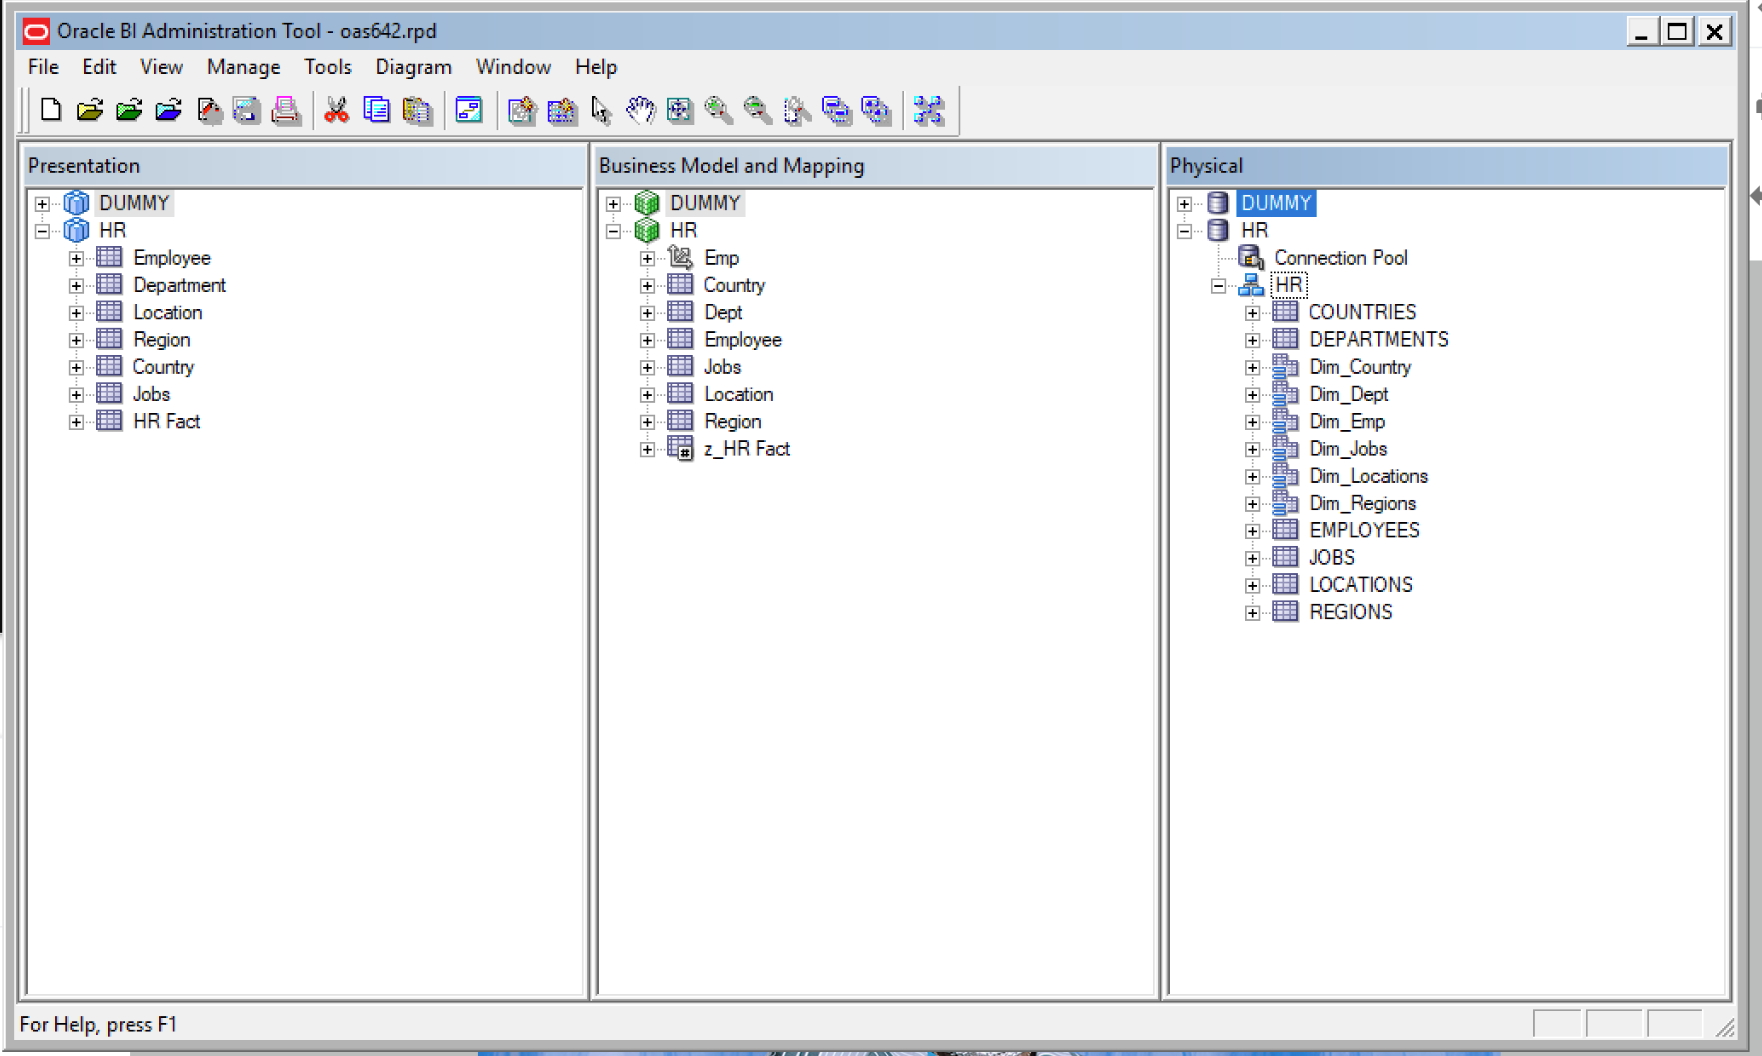
2) Next I edited the oas642 repository in the BI Administration tool to add in the HR physical/logical and presentation layer of the HR Subject Area. OK so here I had a slight issue in that my local BI Admin tool could not open the OAS repository as it complained it was a newer version than the local client BI Admin tool. I installed a newer BI client version using setup_bi_client-12.2.1.3.0-win64.exe and I installed this in windows 8 in compatibility mode. I am using windows 10 and if I didn't do this, the BI admin tool would not work!
I cut and pasted the physical/logical and presentation layer between one session of the BI Admin tool (one OBIEE repository the other the OAS repository). There are other ways to get the the HR Subject Area into the OAS repository (repository merge etc) but, for now, I wanted to keep things simple. Once the elements were copied over I ran a consistency check on the OAS repository and made sure there were no errors with the copied HR subject area.
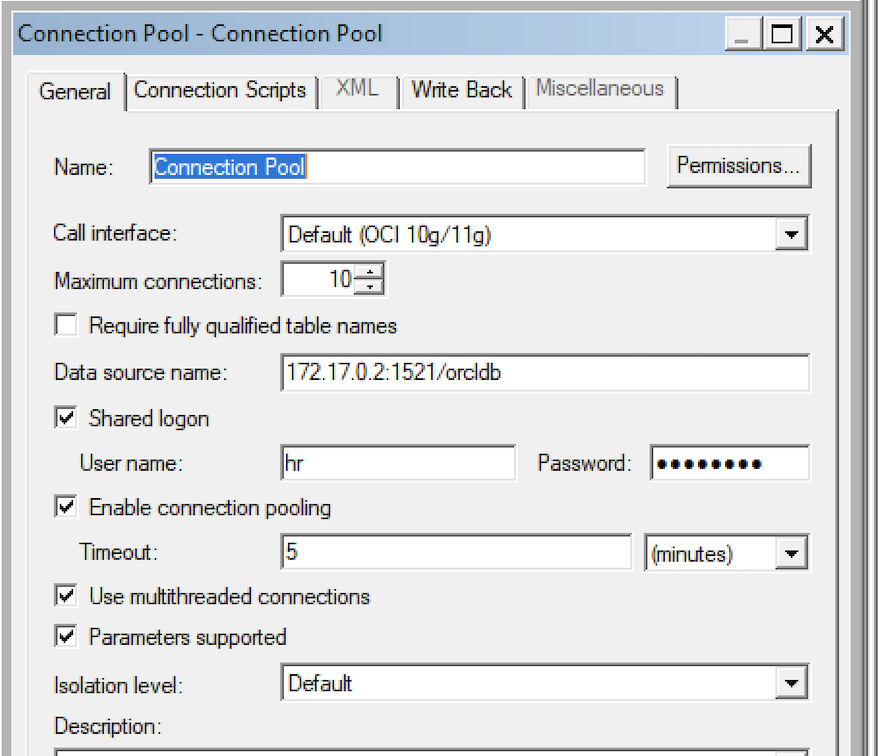
I changed the HR database connection pool to point to my docker container oracle database rather than my local database instance (the HR sample schema and data is identical in both databases). Note the Data source name IP in image below is the docker container IP for OAS (as identified in part 1 of this blog) not my local machine IP.
3) Next step was to upload the updated OAS repository with the HR subject area to the Docker OAS server container.
To upload the OAS repository from the directory /opt/oracle/config/domains/bi/bitools/bin
./datamodel.sh uploadrpd -i /home/oracle/oas642.rpd -si ssi -u weblogic -p Admin123
Message returned on command line was 'RPD upload completed successfully'.
4) In OAS I navigated to the Datasets menu, and saw a new Dataset 'HR'. The purple box icon (below) denotes this is a OAS subject area.
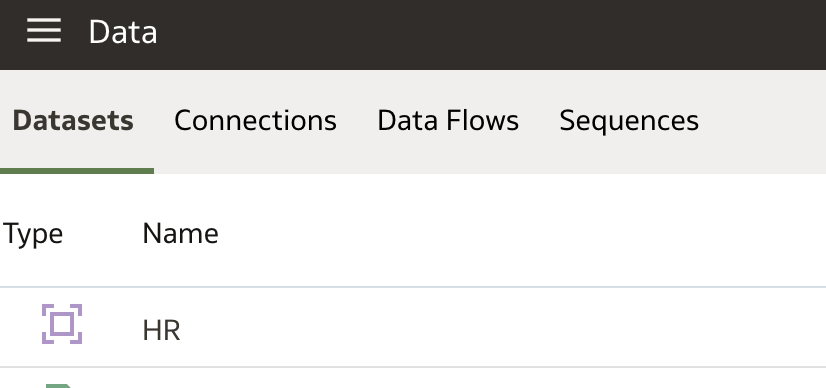
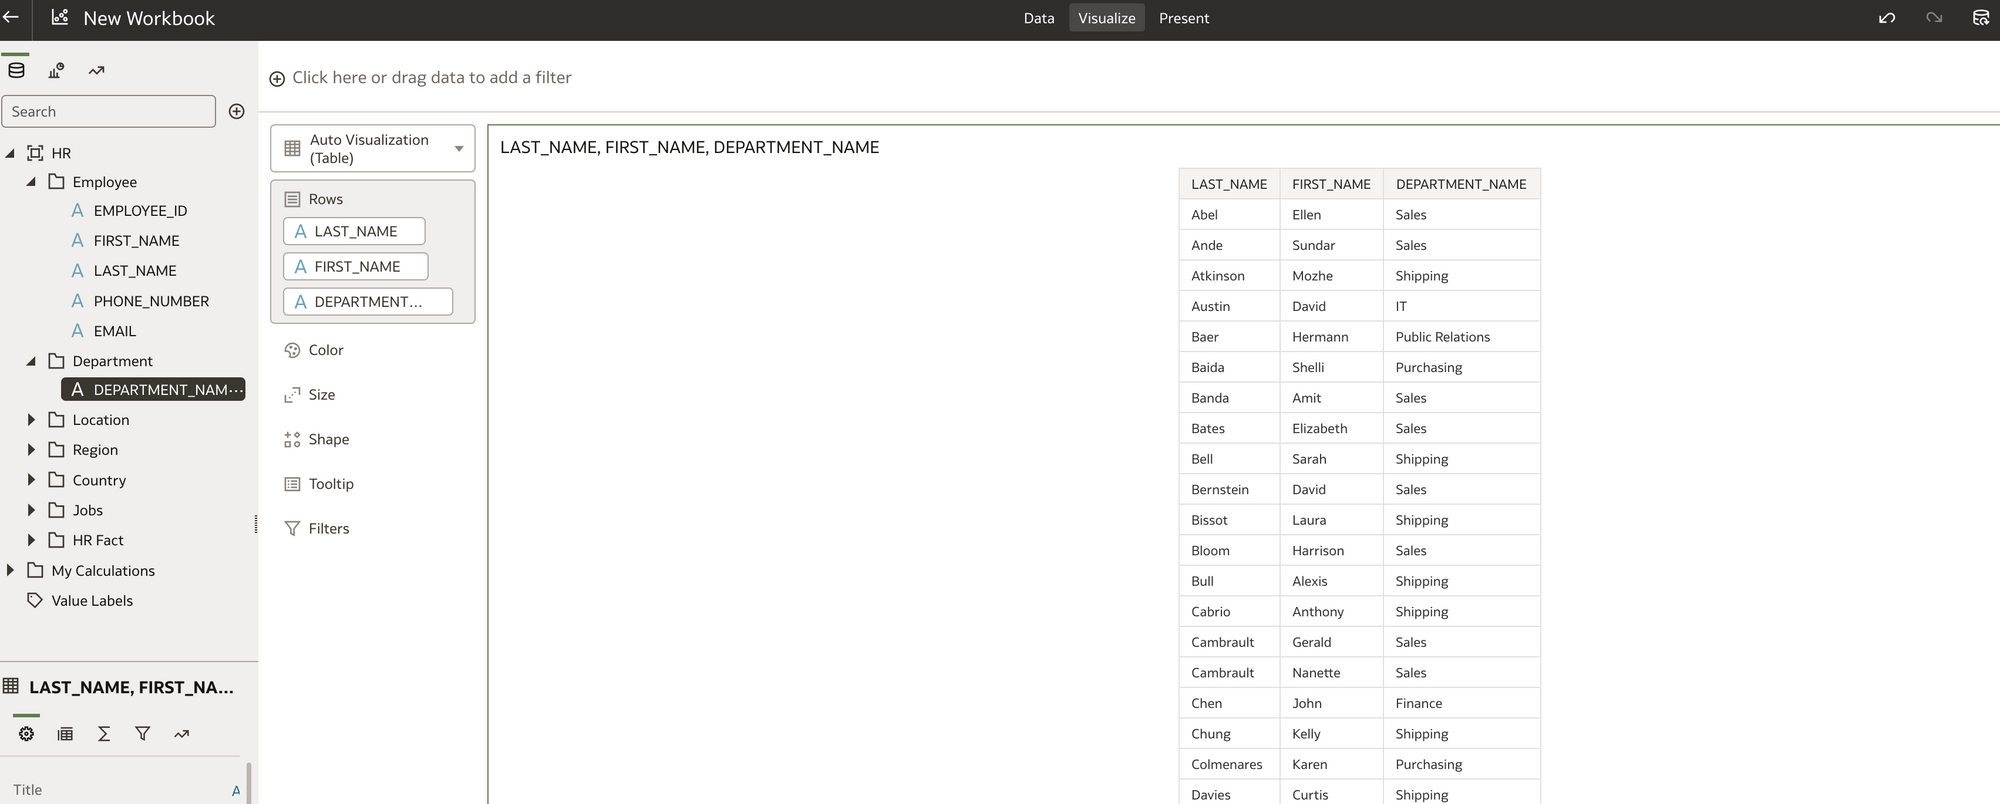
I clicked on the icon and I can begin to build OAS visualisations using the HR Subject area. I could see the dimension folders and the HR Fact folder which all looked familiar.
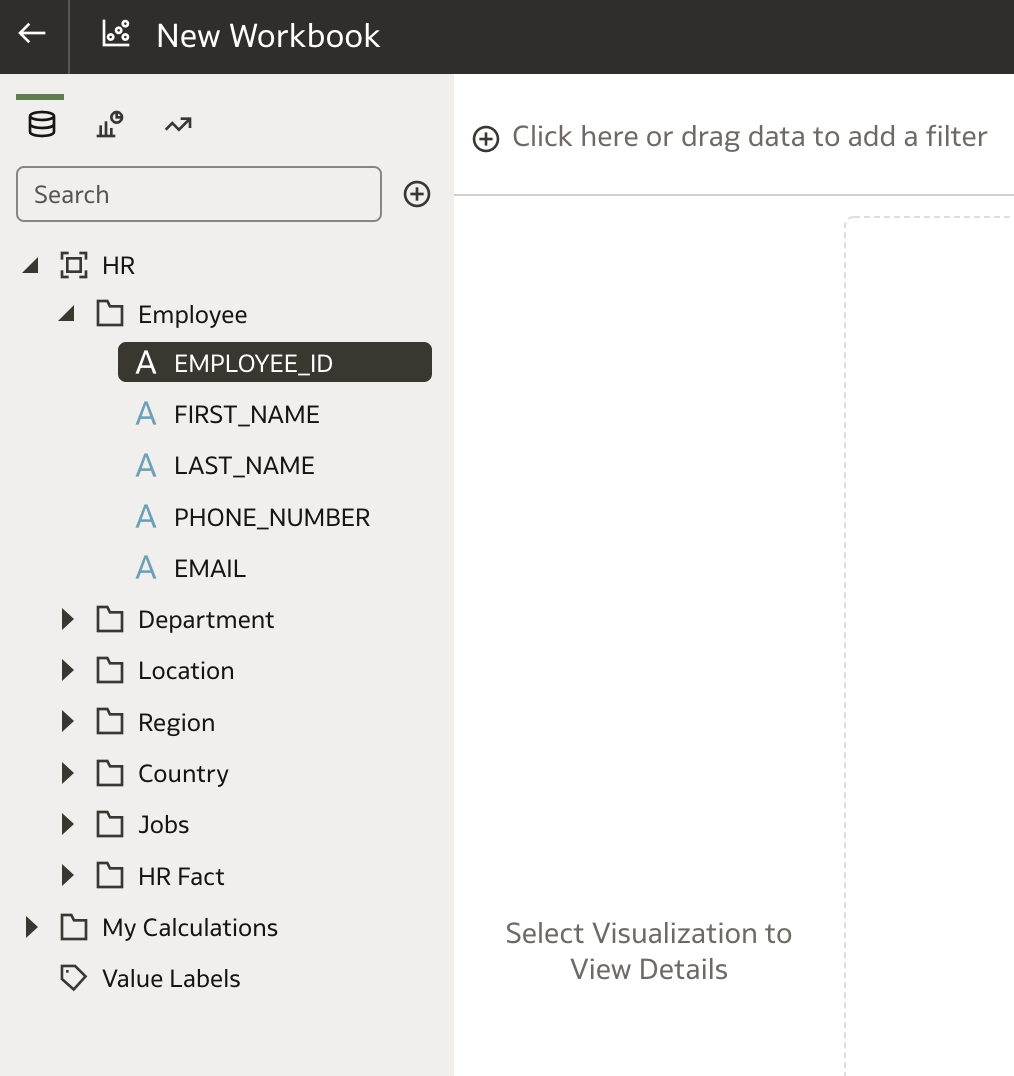
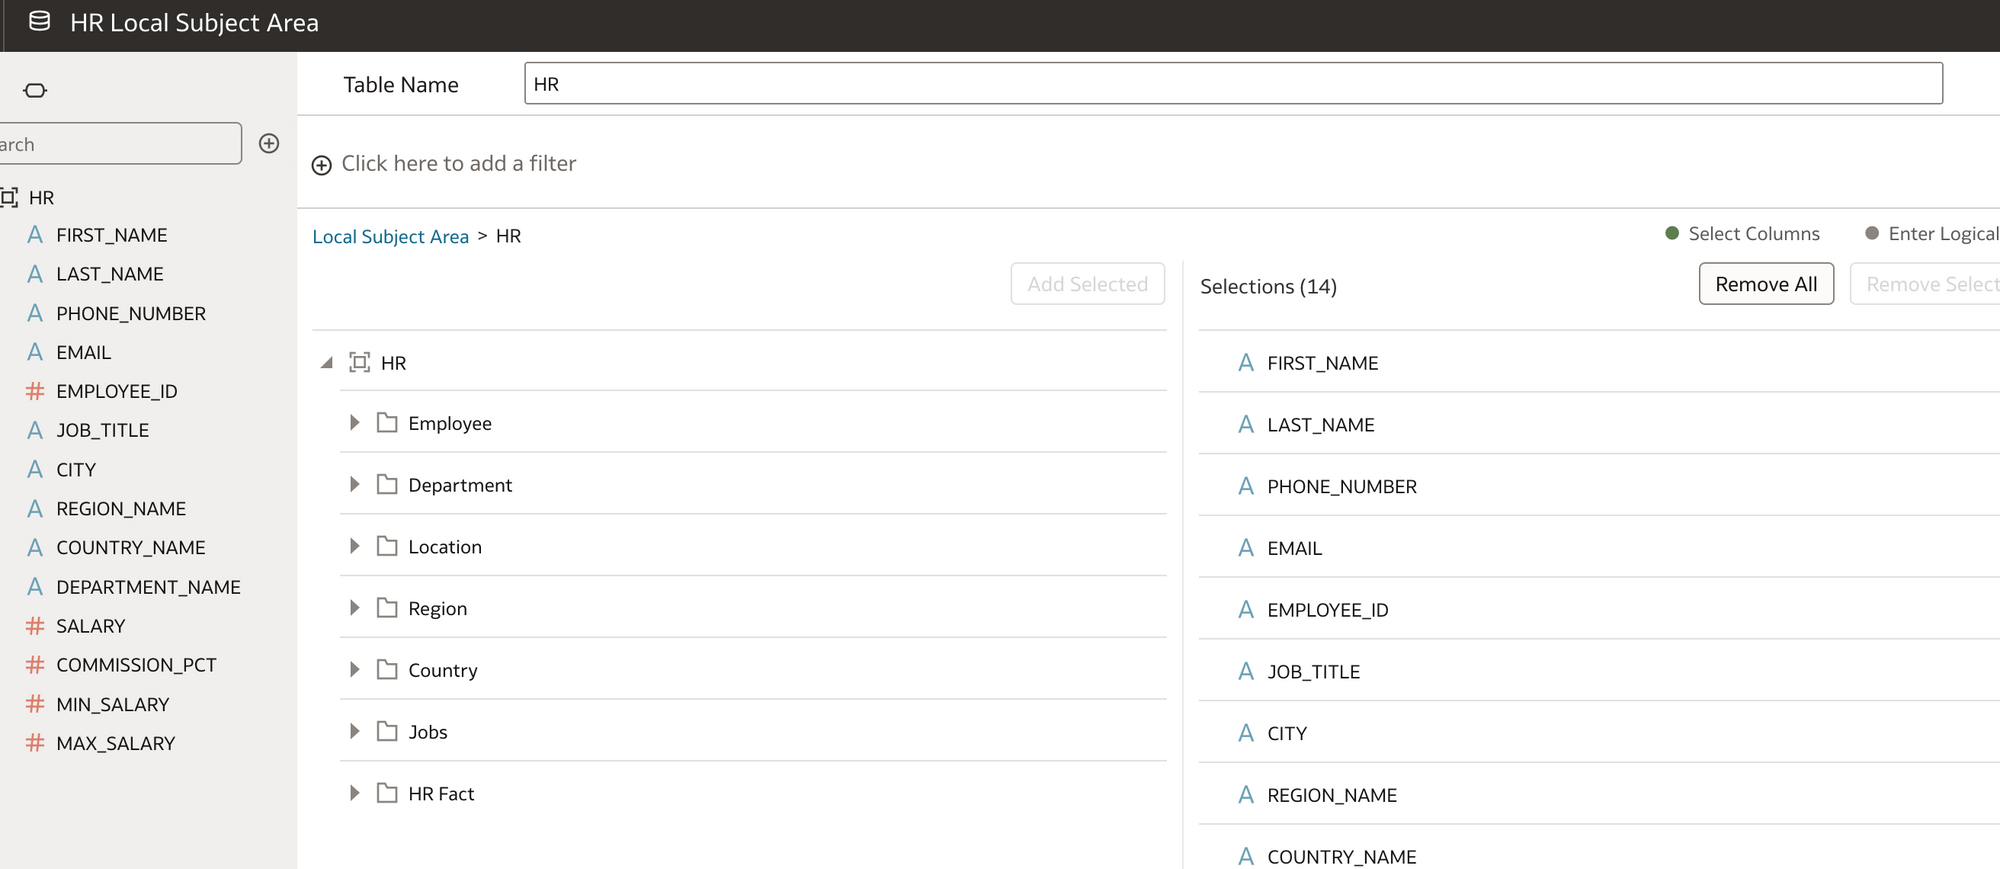
In addition to the complete HR subject area, I also created another Dataset called 'HR Local Subject Area' based on a subset of the complete HR subject area. Why do this? I wanted to see if i could cherry pick elements of the HR subject area just to include the columns I needed to replicate the OAS visualisations that I created in Part 1 of the blog (which were written directly against the database). This process helps simply the report writing. Not so much required for this small HR subject area used in the examples, but, in the real world often very large subject areas get confusing to users who don't know which dimensions to use and they only need certain elements of the data. Also they may not be permitted to see all the data elements. You can tailor the dataset to a specific set of requirements and add other calculated columns if required at this stage.
5) OK so now to create the visualisations in OAS against the HR local Subject Area Dataset!
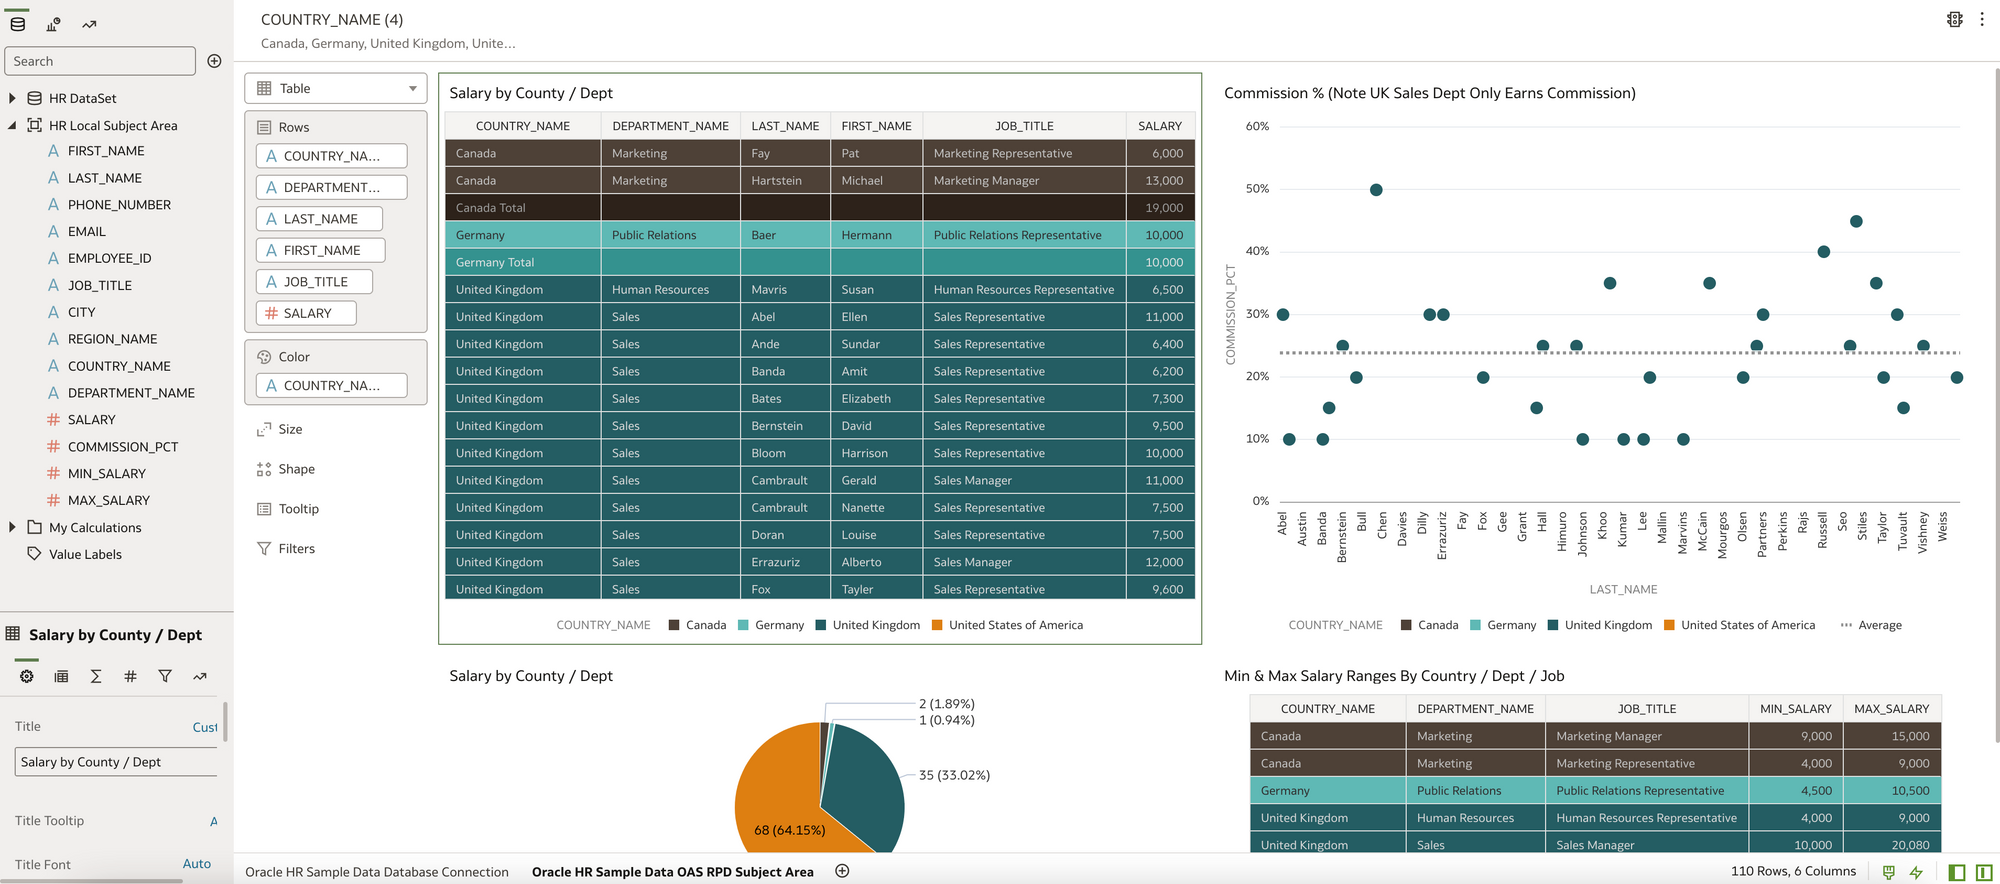
This was pretty straight forward to do, there were a couple of issues with data types but nothing that didn't take more that a couple of minutes to fix. The main thing was the data reconciled exactly to the visualisations written against the database connection which gave confidence that the move from the OBIEE repository to the OAS repository was successful.
6) What if I want to present the OAS data visuals on a BI Dashboard and also write some additional reports the old fashioned OBIEE way. Then combine these on a Dashboard.
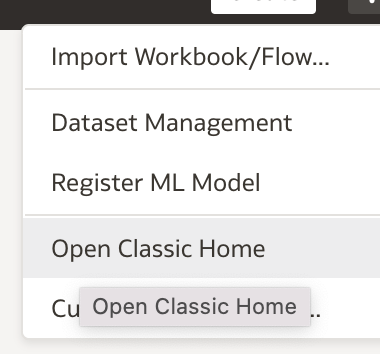
I click on Open Classic home
I go to My Dashboard and Edit. I drag my DV workbook into the dashboard and as I have two OAS canvas, I choose display canvas1 (show view) this was the Oracle database connection visuals. Note Canvas2 was the HR Subject Area visuals I just created.
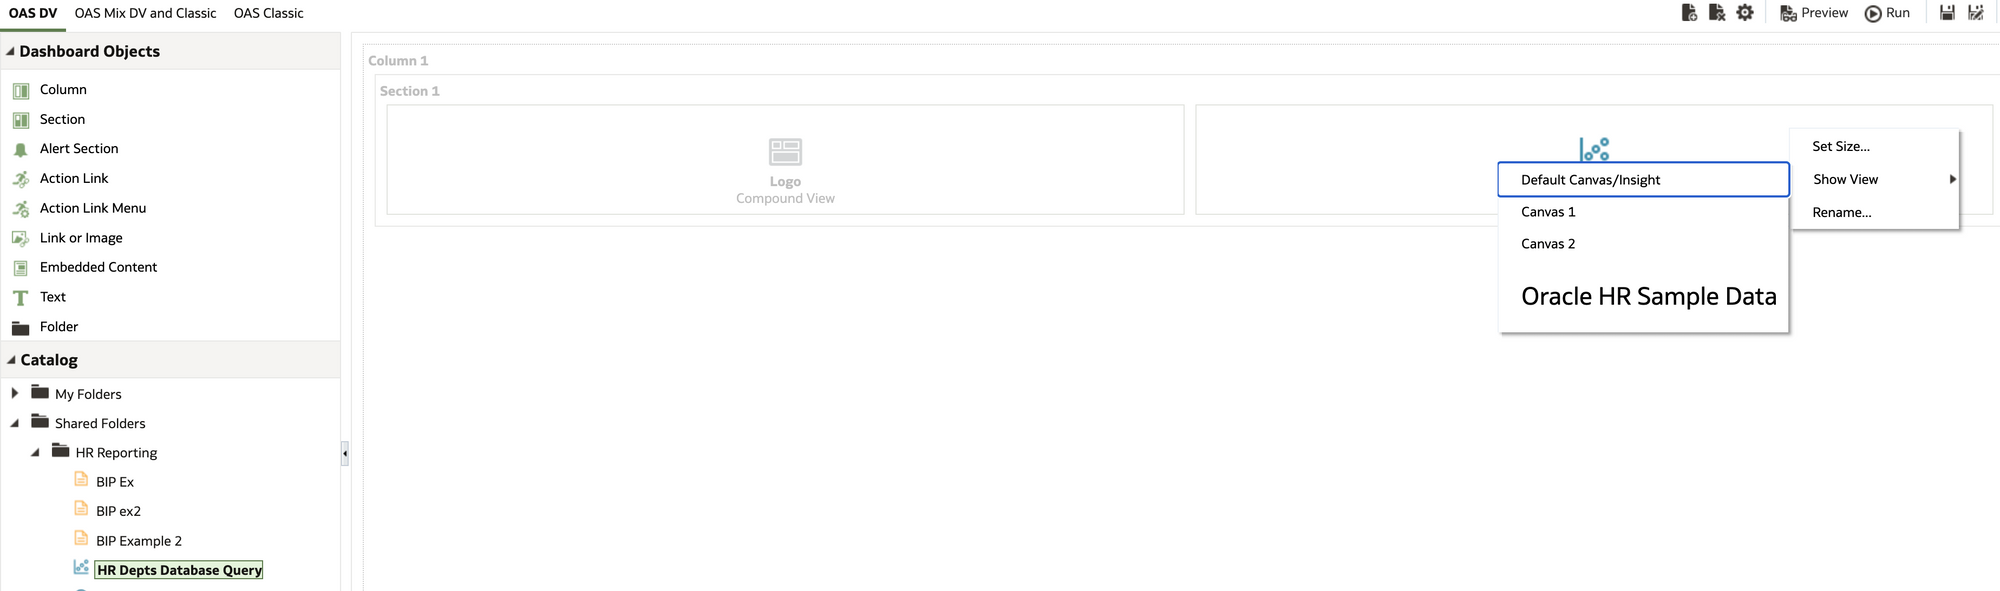
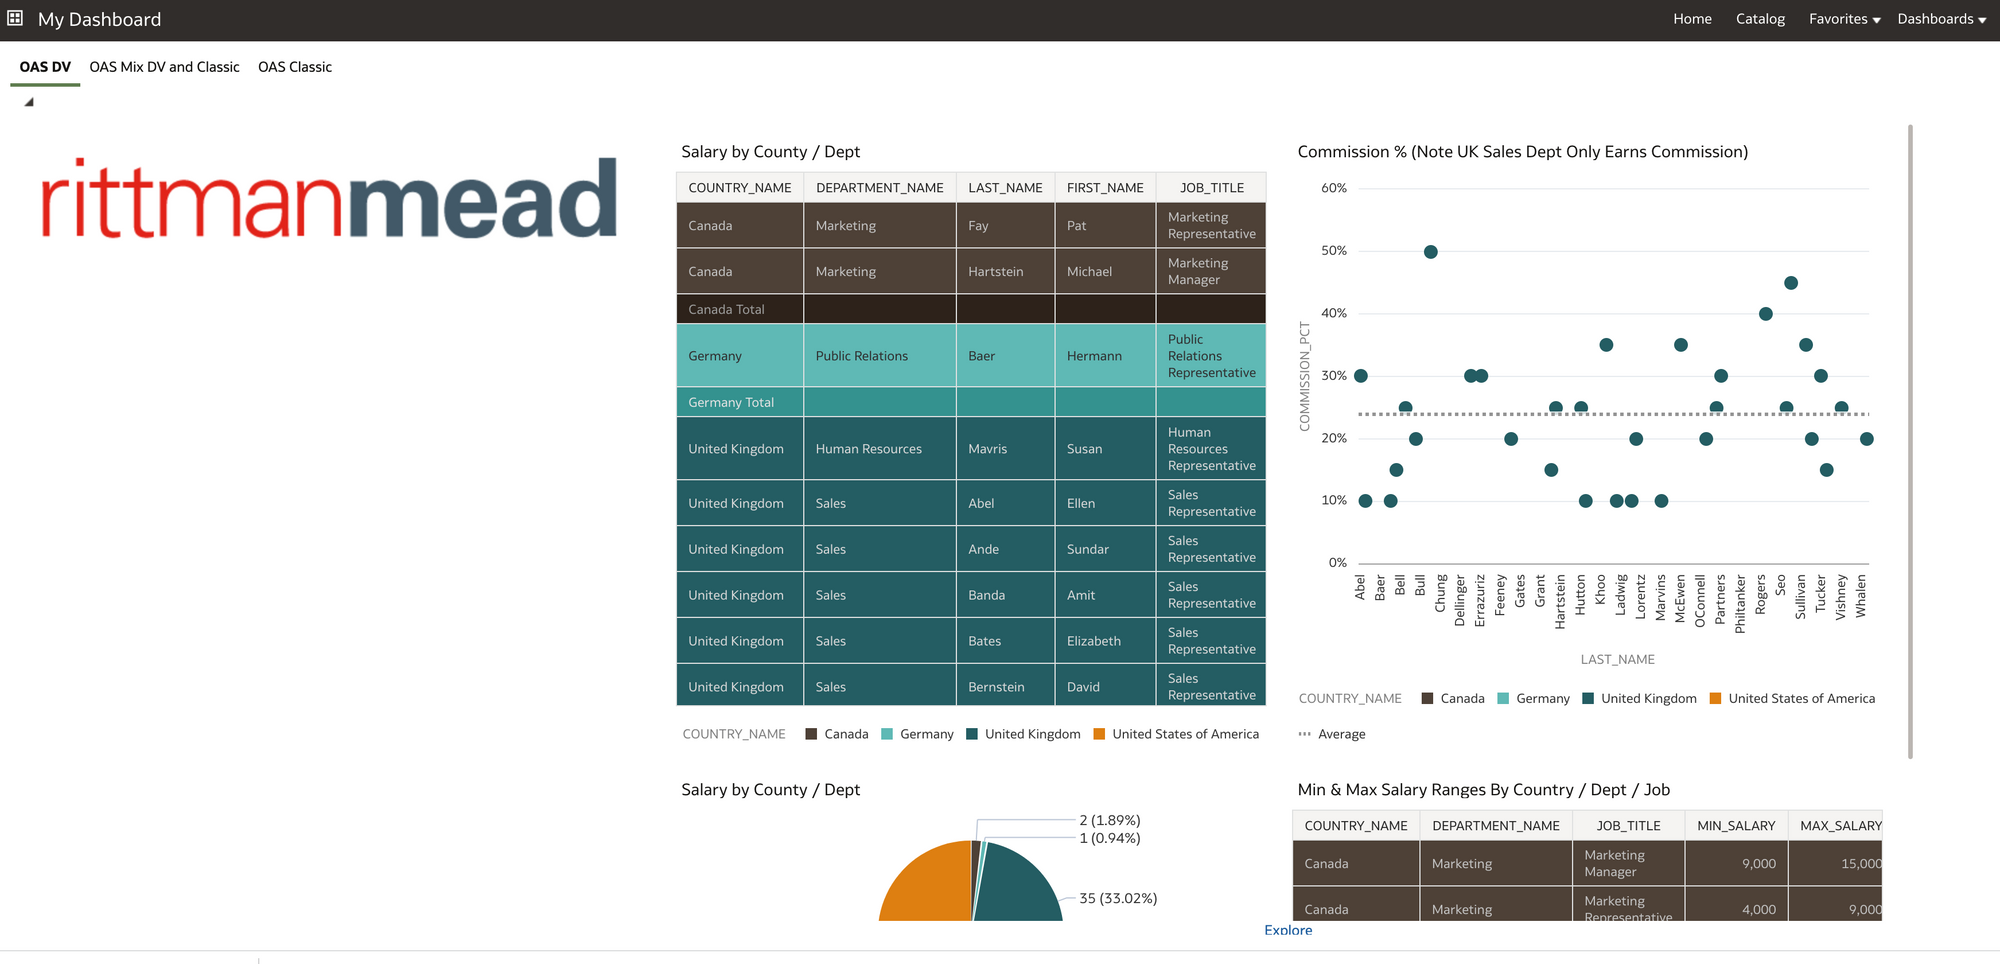
I also added in a logo. I saved My Dashboard and had a look at it.
Quite happy with that view!
For the new BI Classic content, I clicked on create and choose Analysis.
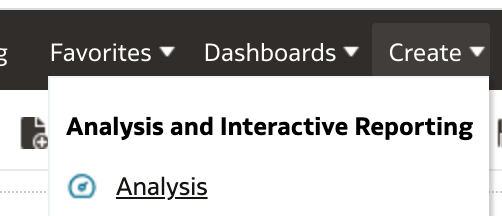
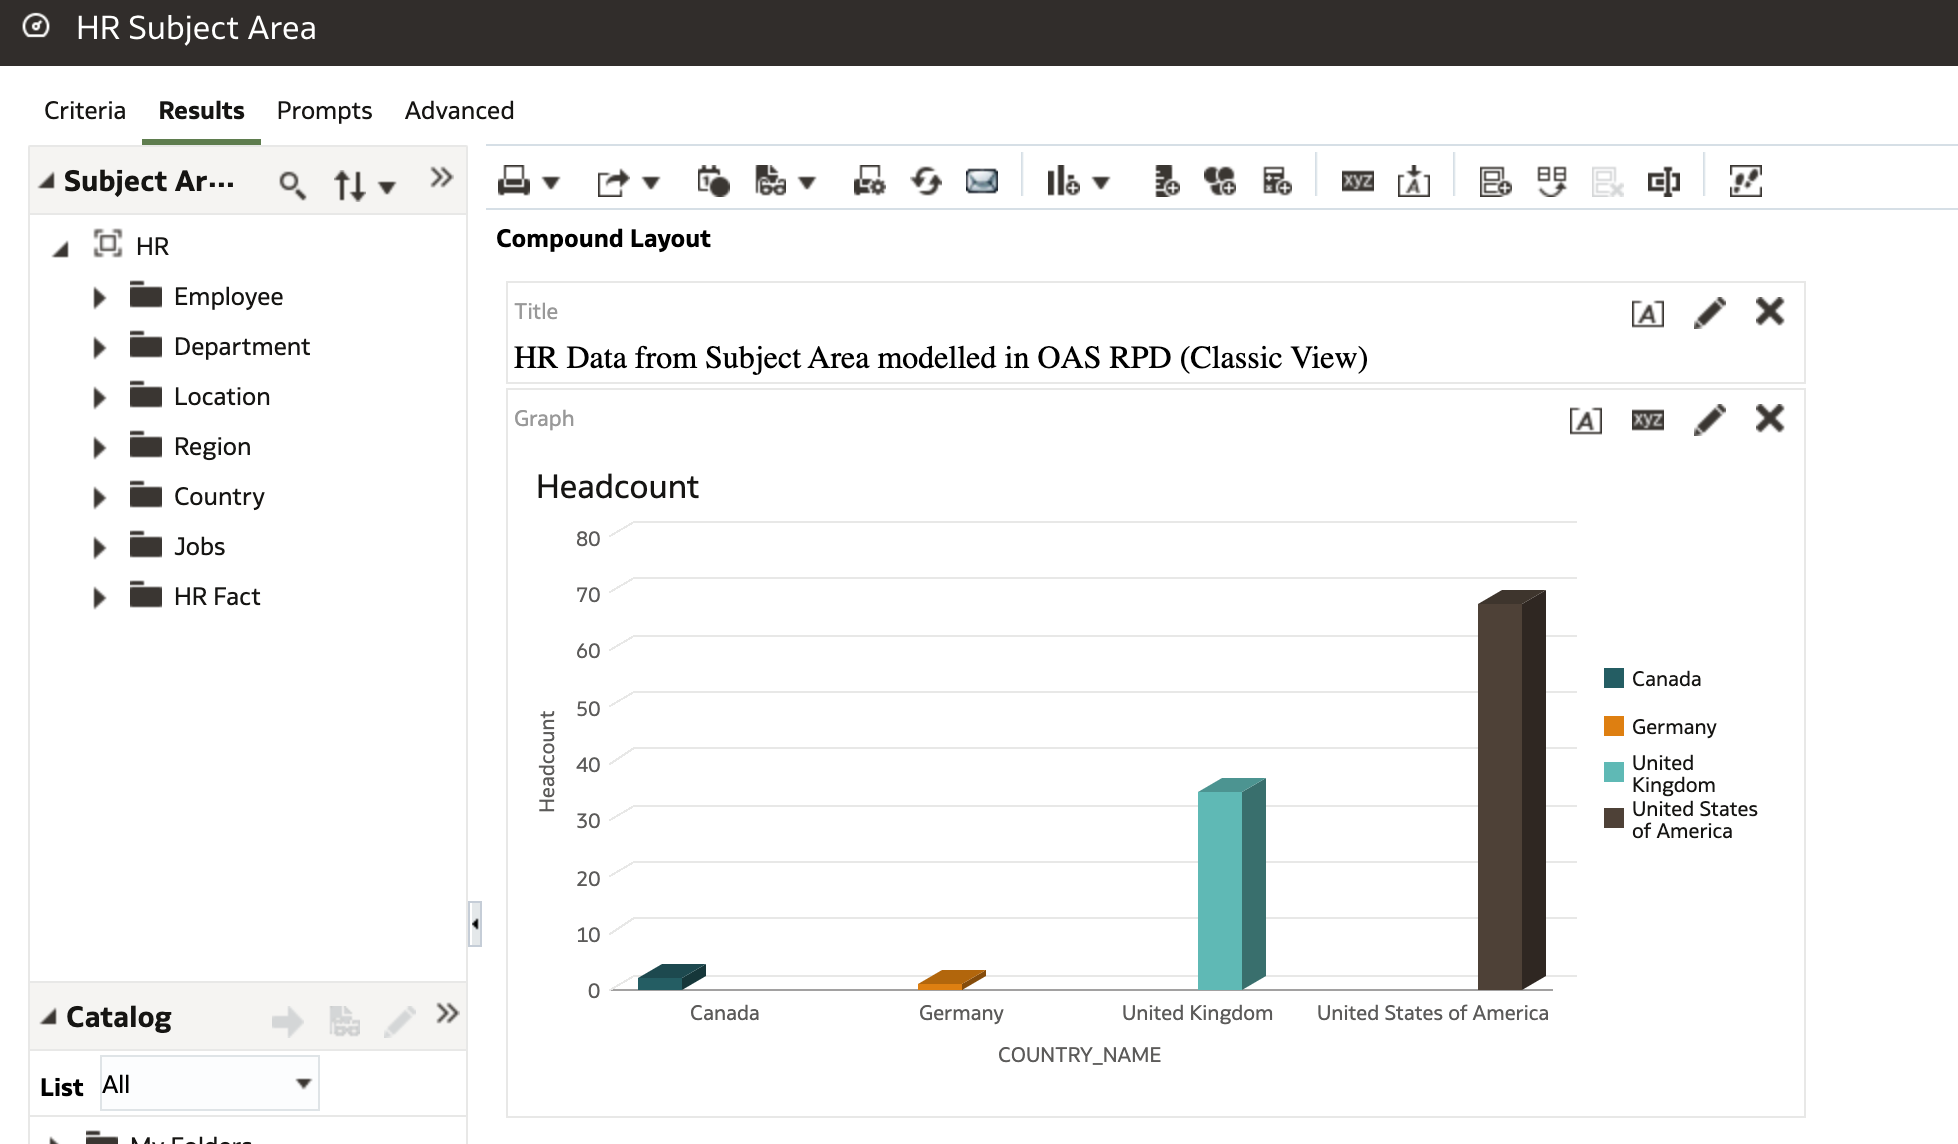
With the Criteria tab I could now create my OBIEE reports with the familiar interface using the HR Subject Area.
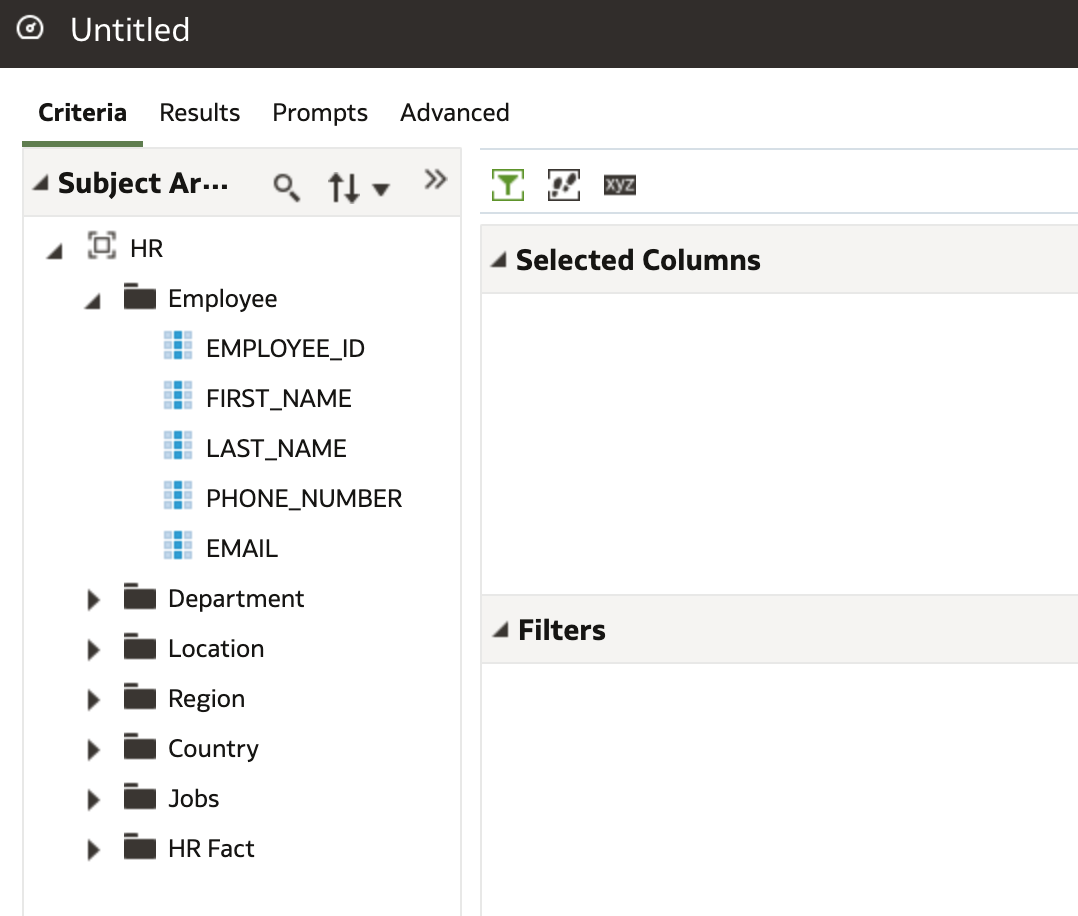
I knocked together a quick report. Note I could have also used the HR Local Subject Area Dataset I created to write the analysis.
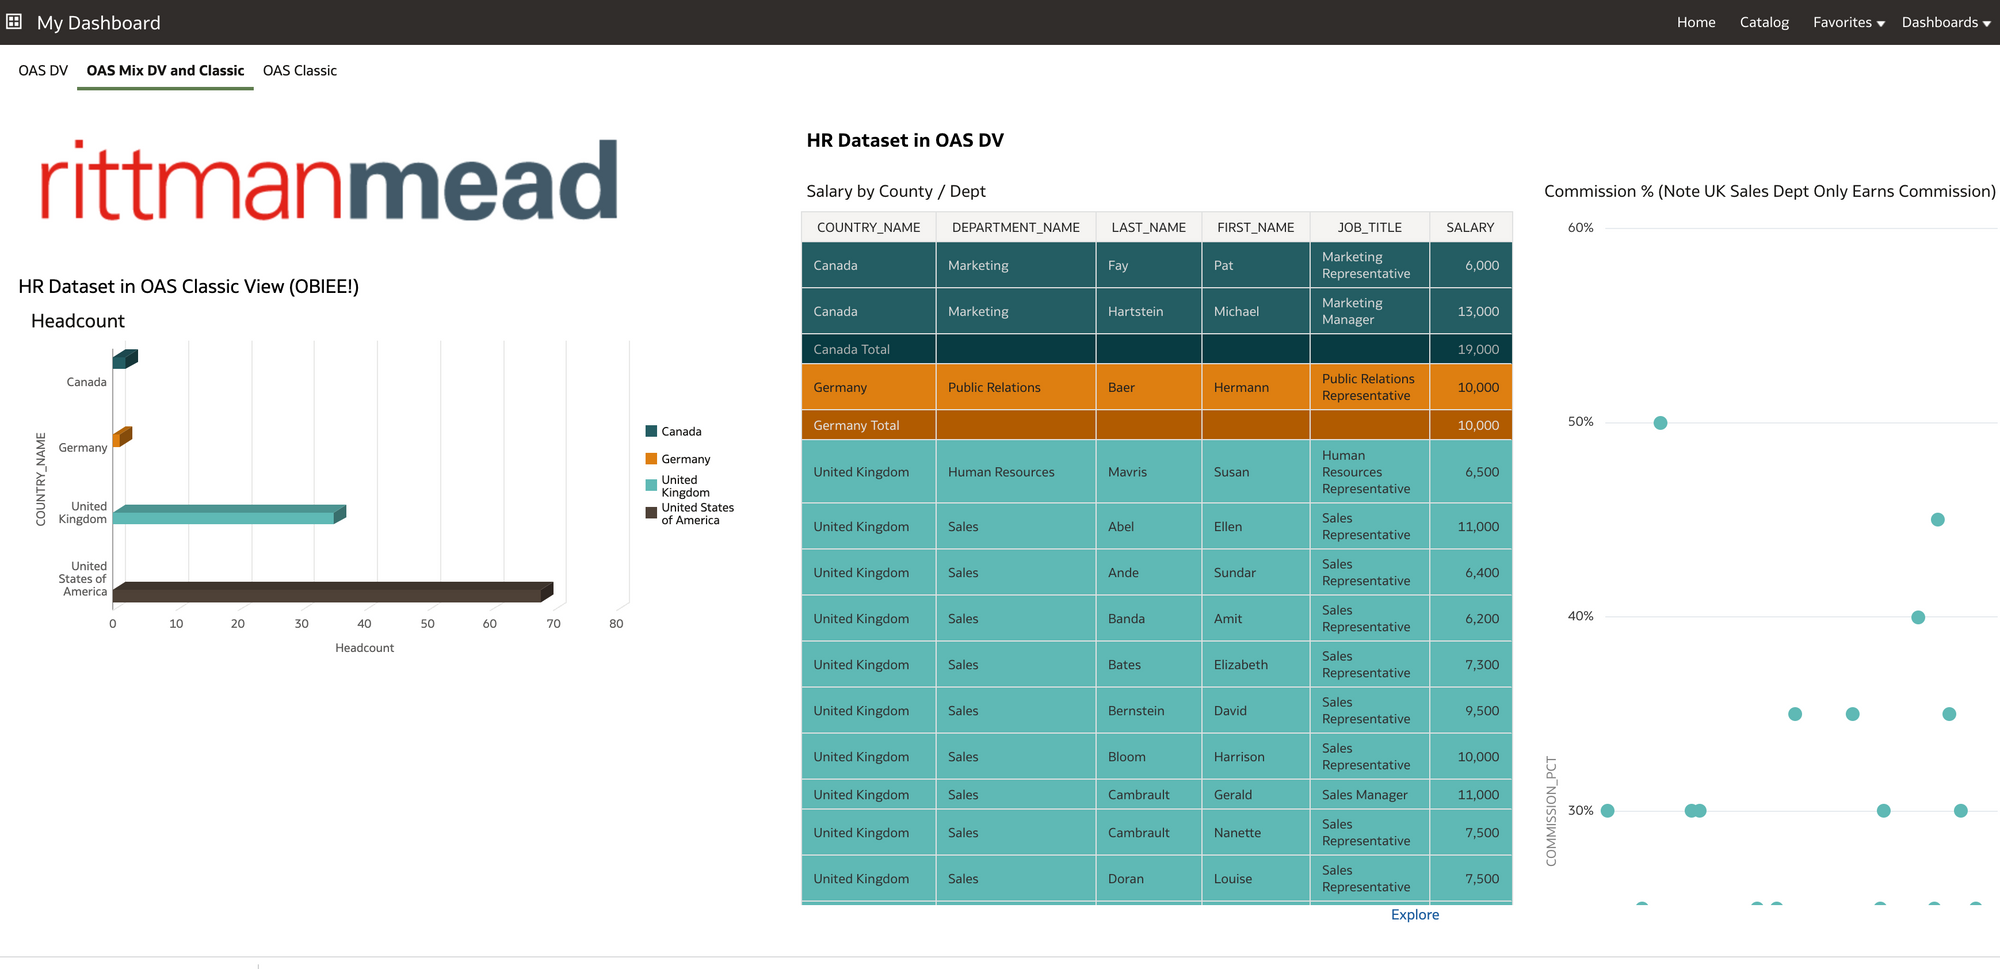
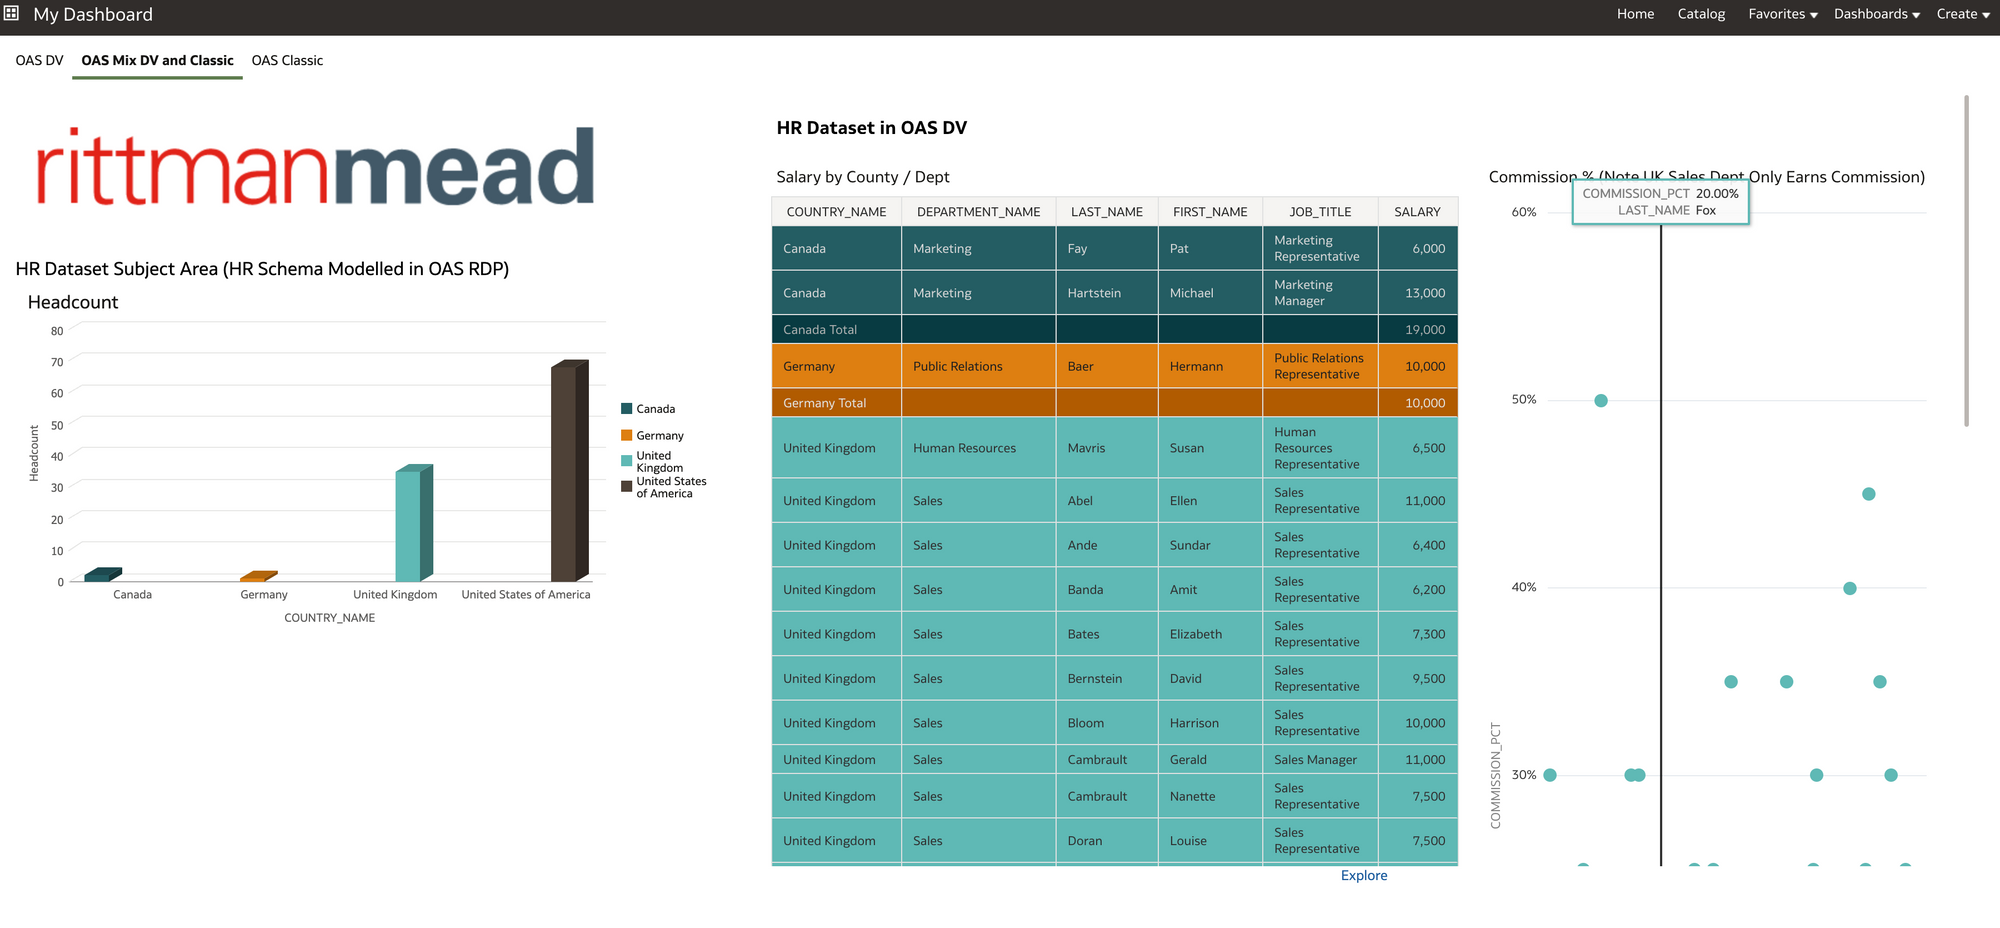
I added the new Analysis to my dashboard and combined with the OAS Data visualisations to get this view (below).
Again I was pretty happy with that view.
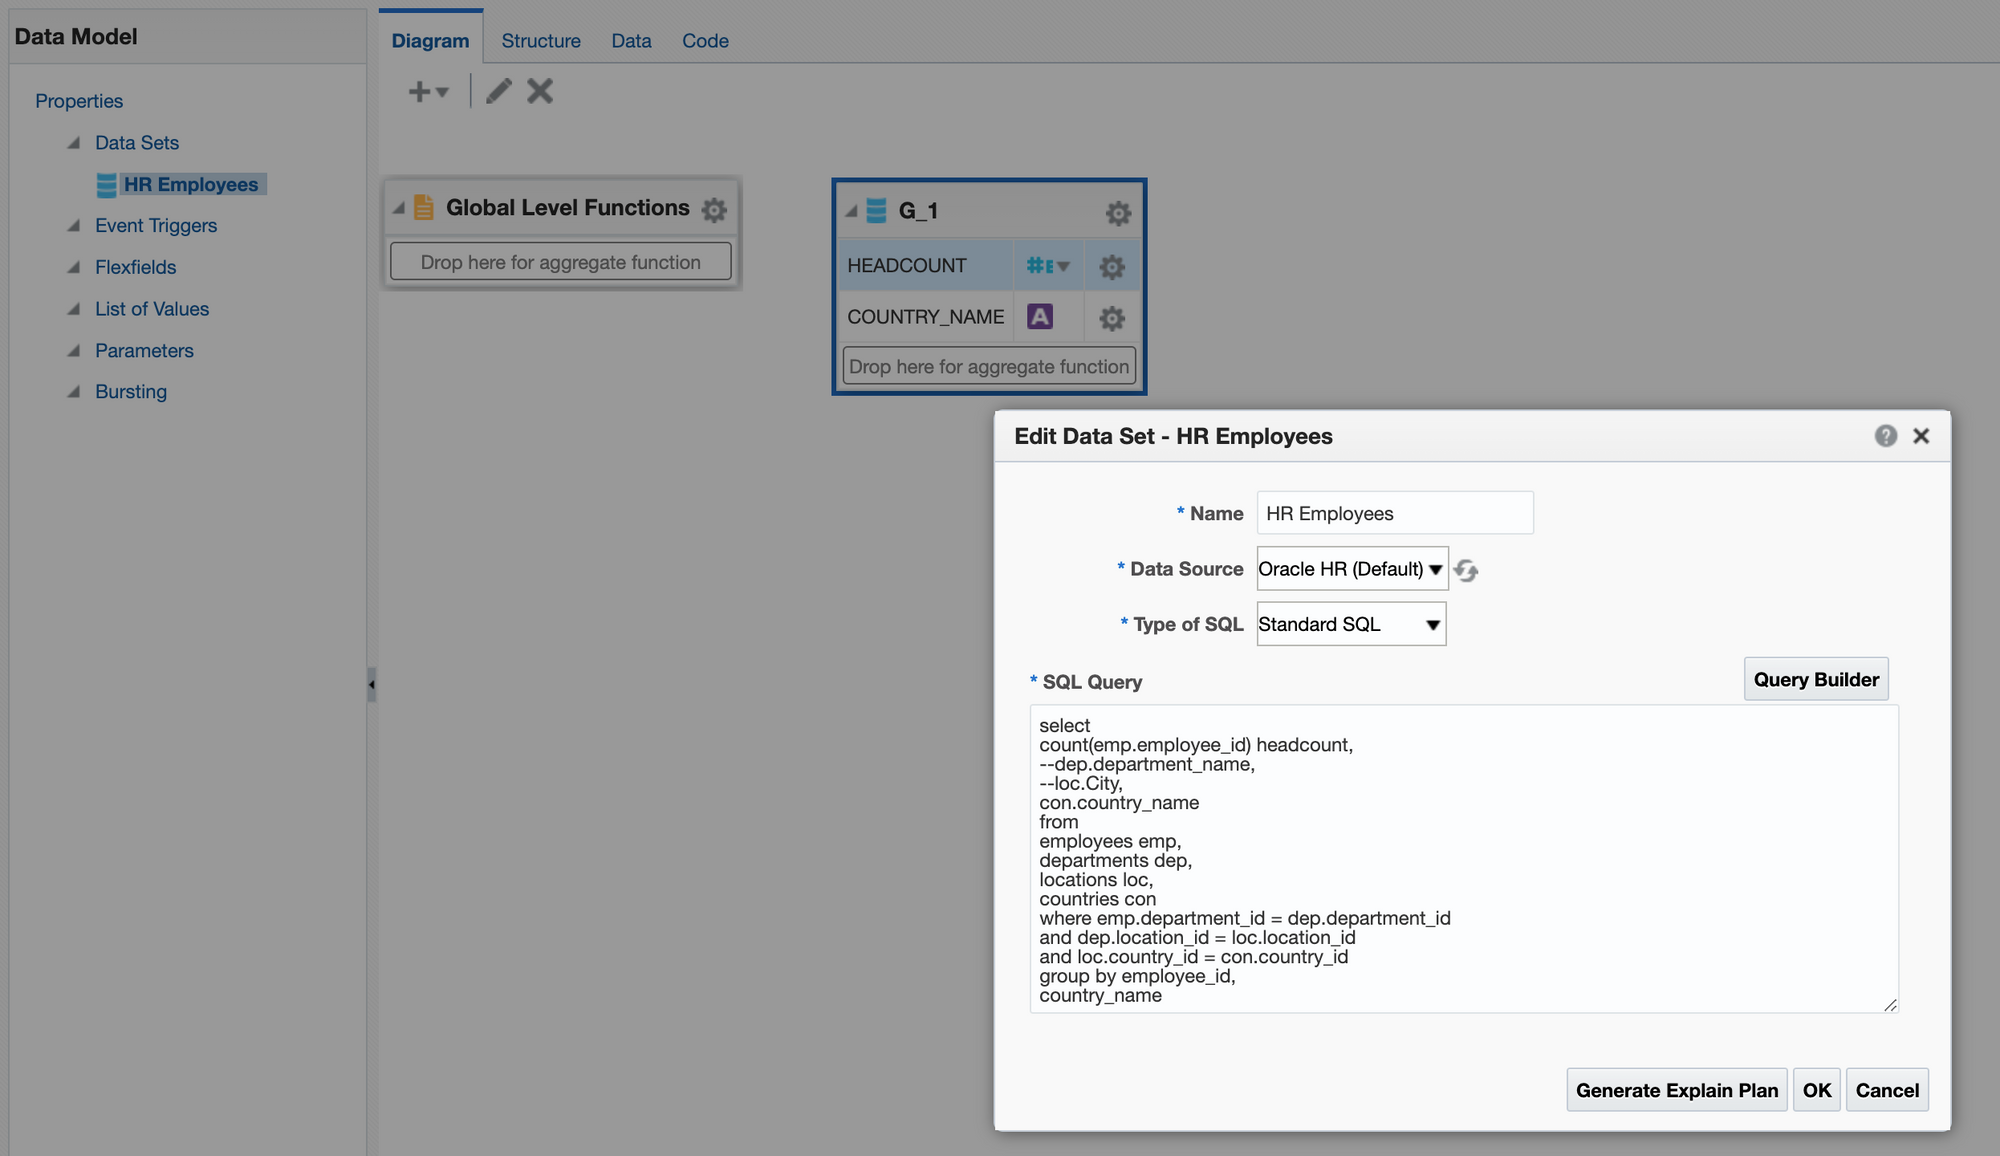
7) Finally, I wanted to create a couple of basic BI Publisher reports in OAS as a way of proving I could migrate HR BI Publisher content to OAS should I wish.
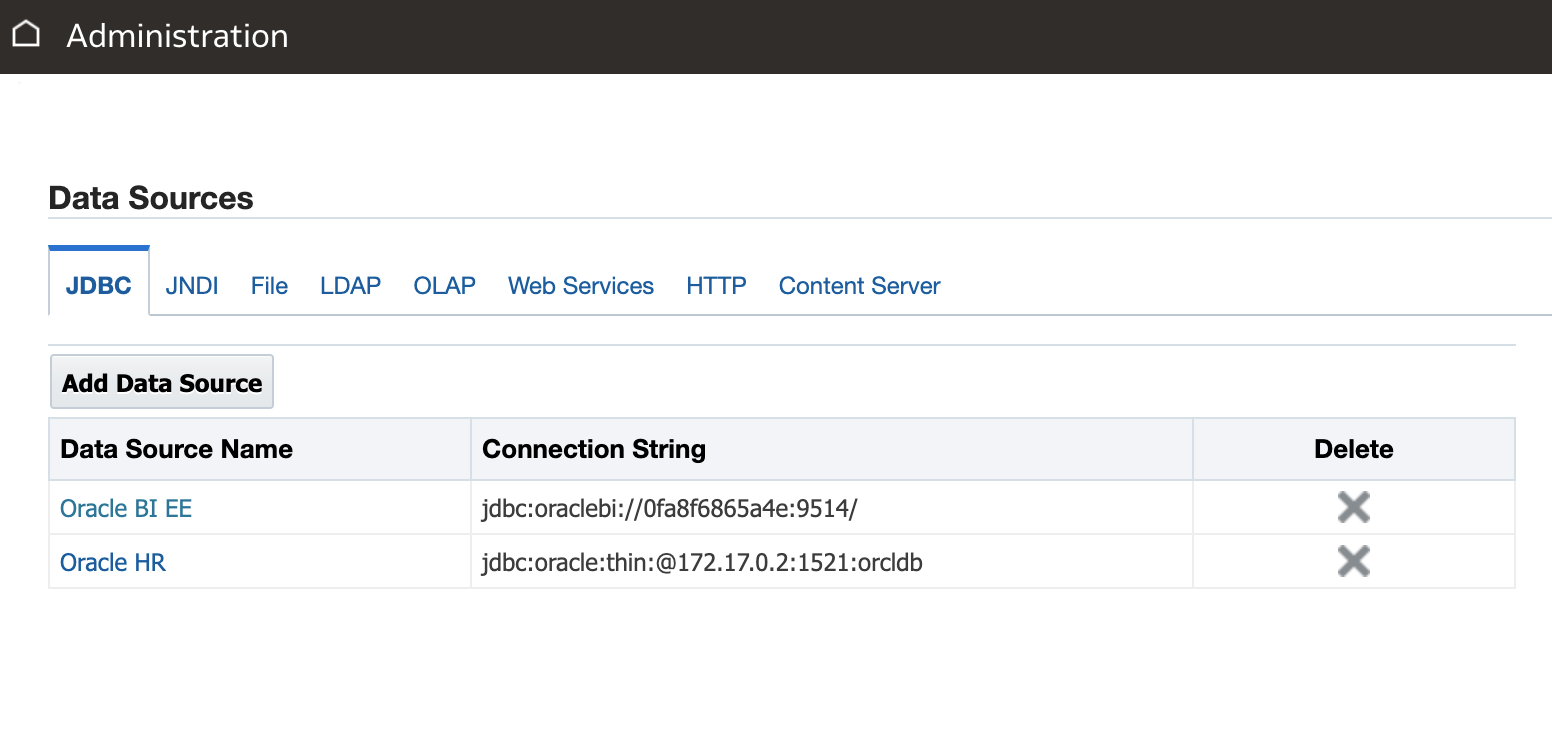
In OAS I created a BIP Data Source connection to the HR schema database so I could get to the data.
For this I needed to go into Administration page of BI Publisher in OAS and create a new JDBC connection.
Then I created my data model, in this case with a bit of SQL (below). I also used the HR subject area to create another BI publisher HR salary report as its useful to be able to demonstrate both methods .
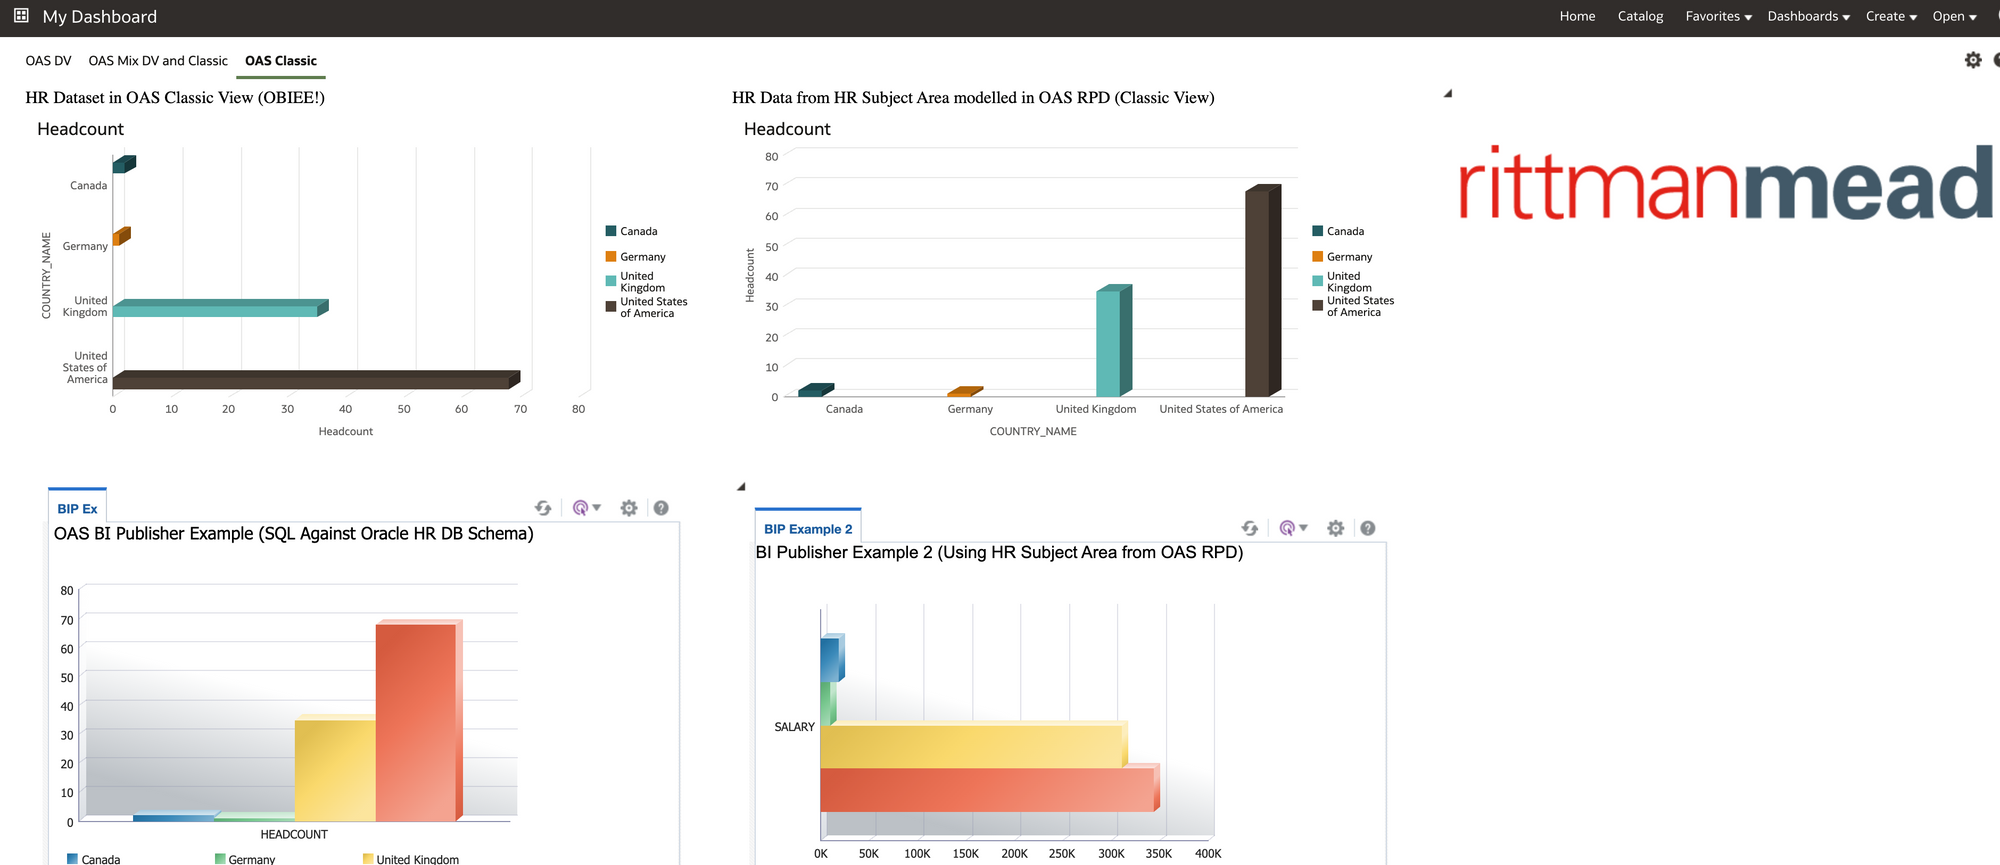
Once I wrote my reports using the BI Publisher report interface, I presented them with my other Classic views on a BI dashboard.
Job done!
Conclusion
During this exercise the penny dropped regarding OAS.
I have worked in organisations where certain departments felt trapped into the traditional approach taken to BI. Basically that BI is a technical product that should be administered directly from IT (obviously this may be less relevant to you if you have already moved away from this model).
Essentially OAS moves you to a platform where you can start to involve users from the business and get them fully engaged in preparing and curating data through to writing visuals and reports. Once connections to data sources are set up a certain level of ownership of data and reporting can be passed over to the business from IT OAS also gives the business users the chance to create their own datasets based on data they may have in 3rd party systems or spreadsheets. Working alongside other departments in the business, all which have similar aspirations and requirements for data, then OAS has an enterprise ready feel to it.
As well as the OAS Data visuals and interface it was reassuring to see that you could continue with the older BI technology and re-use content and Subject Areas/reports from OBIEE, also BI Publisher data models/reports should you have these.
In the real world with OAS, I can see HR departments sticking to having certain more complex HR reporting datasets written for them by more technical people in the OAS stack, but, certainly the flexibility is there to have one or two people within the HR department creating OAS datasets and visuals with complete autonomy. These individuals could also have SQL skills and work with the OAS Administrator to fast track content into the system. The OAS Administrator for HR content could also sit within the HR department. A blended approach is always the best in my opinion.
As a real world example, it's worth mentioning, I am currently working for a Rittman Mead client who are moving a number of on premise OBIEE repositories to OAS in the cloud (migrating to one consolidated OAS repository). Phase 1 of the project involves replicating and enhancing current OBIEE dashboard and analytics in OAS classic. This phase of the project is being handled by a team specifically set up for this purpose. Phase 2 of the project is to push out the OAS Data Visualisation tool for adoption by business users, who will be trained to create and design datasets and workbooks. In addition the business unit users will receive training to maintain and develop further OAS analytics and dashboards in OAS classic. This is to help facilitate a move to a user reporting self serve model out in the business from the old central IT report writing model.
With Microsoft Power BI Desktop and similar products increasingly being requested by business users that have got tired of waiting for an overstretched IT to address reporting issues, It certainly might be worth looking at OAS as a candidate solution into the mix.
Overall, personally I found this a useful practical learning experience. I hope you may have gained something too, and, if you stuck with it this far then thanks for reading.