Comparison of Tableau vs Power BI vs Oracle Analytics
Introduction
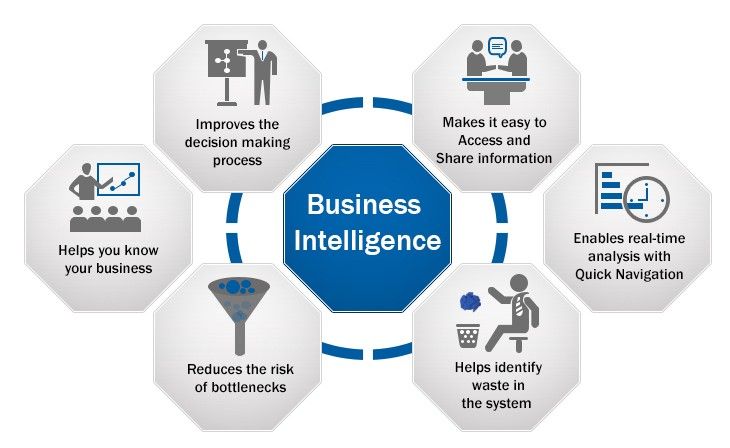
Business Intelligence (BI) tools are a vital part of the data and analytics architecture, as they allow end users to consume the data and help them to take better data-driven, actionable decisions, for example:
- Increasing profitability by analysing customer behaviour
- Eliminate inefficiencies by optimising operations
- Quickly adapt to market or supply changes to spot market trends
- Predict success by comparing data with competitors
Traditionally BI tools were simply reports and dashboards. Recently the functionality of these tools has been greatly extended, providing features like data preparation, data exploration, advanced data visualisation, spatial and maps, augmented analytics and access to machine learning models.
Choosing a BI Tool
According to a report (referenced by Salesforce), published by PricewaterhouseCoopers (PWC), 75% of organisations lack the skills and technology to take advantage of their data.
The solution to this problem lies in choosing the right BI tool. Here are some factors you should consider.
- Ease of Use - usability is crucial for successful adoption. The BI tool must be easy to use, offer a modern interface and have intuitive navigation and customisation capabilities. If dashboards are difficult to create or understand, or visuals created are of poor quality, users will not be able to interpret the data.
- Data Connectivity - a good BI tool needs to connect with a wide variety of data sources. Data is found across a broad range of systems and stored in lots of different formats. Sometimes it is an enterprise database storing thousands of data points about customers; other times, it’s a simple tracking tool that only updates a few data points a few times a day saved in JSON.
- Data Ingestion and Preparation - once connected to the data source, how quickly can the data be consumed and transformed into usable information? Data quality and preparation features can allow users to rapidly view the data, correct errors and perform simple transformations
- Data Visualisation - this is the most critical factor, as it will enable users to draw insights from the data by visualising it in an easy way to consume. Good data visualisation should facilitate exploration and yield the “aha” moment that is so important to data-driven decision-making. You need powerful data visualisation features, such as charts, graphs, and interactive maps, that allow users to interpret and understand data easily. In addition, features such as geographic mapping, heat maps, and infographics will help users gain insights they can quickly act on. Using features like augmented analytics can suggest the best visualisation for end users to select.
- Analysis Features - beyond data visualisations, a good BI platform also needs to offer powerful analysis features, such as segmenting data, filtering, performing calculations, joining and blending data and calculating analytics such as correlations. The BI tool may also include advanced features such as statistical modelling and machine learning.
- Integration and APIs - BI tools should come with a range of integration and API options so they can easily share the insights generated inside and outside the organisation. APIs will enable integration with other systems and help not to create data silos in the organisation.
- Pricing - this is split into three categories: upfront cost, ongoing cost and hidden costs, for example, extra charges based on the volume of data transferred in or out of the system. When looking at pricing, you must look at all of these.
- Scalability - choose a BI tool that can accommodate the amount of data you need today and the amount of processing you may need in the future.
- Security, Governance and Support - last but not least, the BI tool must secure data from unauthorised use. Data can be sensitive and must comply with national or industry regulations such as GDPR; the tool should ensure the data is only viewed and accessed by authorised personnel. Further, the ability to audit data and report access by user and group can be a fundamental feature for data governance.
Comparing the Features
When I started my BI career in 2014, Power BI was the tool of choice in the organisation that I worked for. But later as I moved to various other organisations I used Tableau and most recently at Rittman Mead, I am using Oracle Analytics (OBIEE, OAS and OAC). My experience working with these three BI Tools has helped me analyse the pros and cons in terms of these features.
The table below shows a comparison of the key features available in Oracle Analytics, Power BI and Tableau.
Note - A complete list is attached below the table as an excel file(BI Tools Comparison -Features.xlsx),that can be downloaded.
| Features Available | Oracle Analytics | Microsoft Power BI | Tableau |
|---|---|---|---|
| User Experience | Can be done without reliance on any other third party tools | No third party tools required for data preparation | Excellent tool for centralised data analysis and management |
| Data Connectivity | Supports a wide range of data source connectivity | Supports a wide range of data sources but limited when compared to Tableau | Supports a wide variety of data sources |
| Data Modelling and Preparation | Offers full support with a wide range of in built functions to do the data transformation | Supports a wide range of inbuilt functions with the occasional use of DAX queries | Full support available in no-code visual data preparation and workflows |
Leader or Visionary or Challenger or Niche Player ?
The Gartner Magic Quadrant for Analytics and Business Intelligence Platforms separates each vendor into four categories: Leaders, Challengers, Visionaries, and Niche Players.
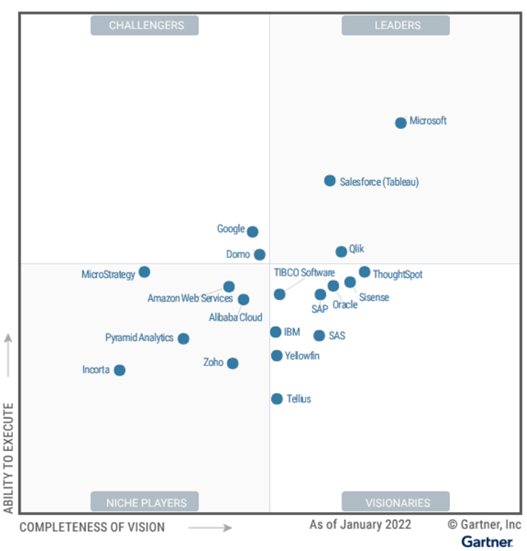
A Magic Quadrant provides a graphical competitive positioning of four types of technology providers, that helps businesses make smarter decisions for their organisations.
- Leaders execute well against their current vision and are well positioned for tomorrow.
- Visionaries understand where the market is going or have a vision for changing market rules, but do not yet execute well.
- Niche Players focus successfully on a small segment, or are unfocussed and do not out-innovate or outperform others.
- Challengers execute well today or may dominate a large segment, but do not demonstrate an understanding of market direction.
Based on the above four categories, Gartner has placed Oracle Analytics as a Visionary, Microsoft Power BI and Tableau as Leaders.
Oracle Analytics (Visionaries)
Gartner praises Oracle for maximising the effectiveness of its platform towards augmented analytics as for some years now, it is been clear that BI technologies concentrate more on augmented analytics. Also Oracle's innovation on the Oracle’s analytic application suite, Fusion Analytics (built using the OAC platform) improve how organisations deploy analytics.These innovations and improvements are some of the key factors for Gartner to name Oracle Analytics as a Visionary.
Microsoft Power BI (Leaders)
Gartner praises Microsoft Power BI for its alignment with Office 365, Teams, and Azure Synapse. With a broad portfolio, which includes visual-based data discovery, augmented analytics, and interactive dashboards , Power BI demonstrates a comprehensive vision and ambition. Market analysts also highlights the price and value of the Microsoft solution as a significant differentiator compared to the rest of the Analytics and Business Platforms in the market.
Tableau (Leaders)
Salesforce cemented its position as a leader, after acquiring Tableau in 2019. In the report published by Gartner, various factors like Integration and Deployment, Service and Support, Product Capabilities were considered to rate Tableau as the leader among the Analytics & Business Intelligence Platforms. Salesforce commends Tableau specifically on allowing users to more easily “access, prepare, analyse and present findings in their data.”
Tableau has been named as a leader in the Gartner Magic Quadrant for Analytics & Business Intelligence Platforms for the 10th consecutive year as of 2022.
Key Highlights
Oracle Analytics
- Talk to your data -Voice to text works with Oracle Analytics Cloud.Simply speak your questions and relevant visualisations will appear.
- Semantic layer of Oracle Analytics is really powerful and not available at the same level in any other tool. Semantic Modeler can be used to create governed semantic models from relational data sources and is a fully-integrated Oracle Analytics Cloud component.
- Oracle Analytics offers analytics search, ask and explain using natural language in 28 languages.
- Auto Insights are a great way to create powerful visualisations using suggestions generated by Oracle Analytics. Fine-tune the insights that Oracle Analytics generates by selecting which data columns to use for Auto Insights. No extra installation required for this feature.
Power BI
- A data engineer is not needed that knows SQL to mash up and clean data from your different systems. Click-through actions on a ribbon and that makes the magic happen creating interactive visualisations.
- Microsoft releases monthly updates to Power BI , so users can always access the latest and greatest features of Power BI.
- Power BI premium features can be purchased on a per user license basis.
- Reports can be accessed from anywhere via iOS, Android and Window devices just with internet connection.
- "Chat in Team’s" feature button for reports lets users within Microsoft Teams in the channel gets notified when a new report is available.
Tableau
- The data visualisations are stunning! A thumbs-up from the design team is guaranteed.
- The drag and drop functionalities are intuitive for creating interactive visualisations.
- The software automatically detects which device(Tablet, Mobile, Desktop) a user is using and adjust the report for optimal viewing on any screen.
- Virtual connections("Vconns" ) are content type that lets data owners share access to groups of tables that can be used across workbooks, data sources or prep flows.
- Revision history feature in Tableau Server maintains the versions of workbooks with numbering starts from last saved revision.
In summary, reasons why you may select one or other of these products include-
Look for Tableau
- There is a need for software that provides stunning data visualisation
- The organisation has an adequate budget
- Business users prefers doing their own business analysis with a drag and drop interface
Look for Power BI
- You are using MS Office and be familiar with Excel
- Having a small budget and are looking for an affordable option
- Value teamwork and the collaboration feature of the software
Look for Oracle Analytics
- For production of high volume reporting with, no need for a separate tool
- For pricing flexibility and simple licensing with transparent pricing
- Comprehensive migration across multiple cloud providers.
Conclusion
While a BI tool can radically improve an organisations's operations, it is important that the right tool is chosen for the organisation. This includes not only the product itself, but the training, support, and expertise the vendor provides for the company. One can easily reap all of the benefits BI has to offer, by choosing the right BI vendor and reporting tool for the organisation’s needs, today and in the future.