Oracle Analytics Cloud May 2023 Update: What's New?

The May 2023 Update for Oracle Analytics Cloud came out a few days ago and in this article I'm going to have a look at the features it includes. If you are also interested in a comprehensive list of the defects fixed by the update, please refer to Doc ID 2919336.1.
Role-based Filters
How can we set up row-level security in Data Visualization? This is a recurring question in any Data Visualization training, and the answer used to be that it was only possible to leverage the rules defined in the repository by creating datasets from subject areas.
The May 2023 Update finally allows us to create filters for datasets based on application roles to ensure that consumers of the datasets in workbooks see only data that's relevant to their role.
To create a role-based filter, select the Join Diagram tab in the dataset editor, and click on the Hide or display the role-based filter bar icon (Figure 1).
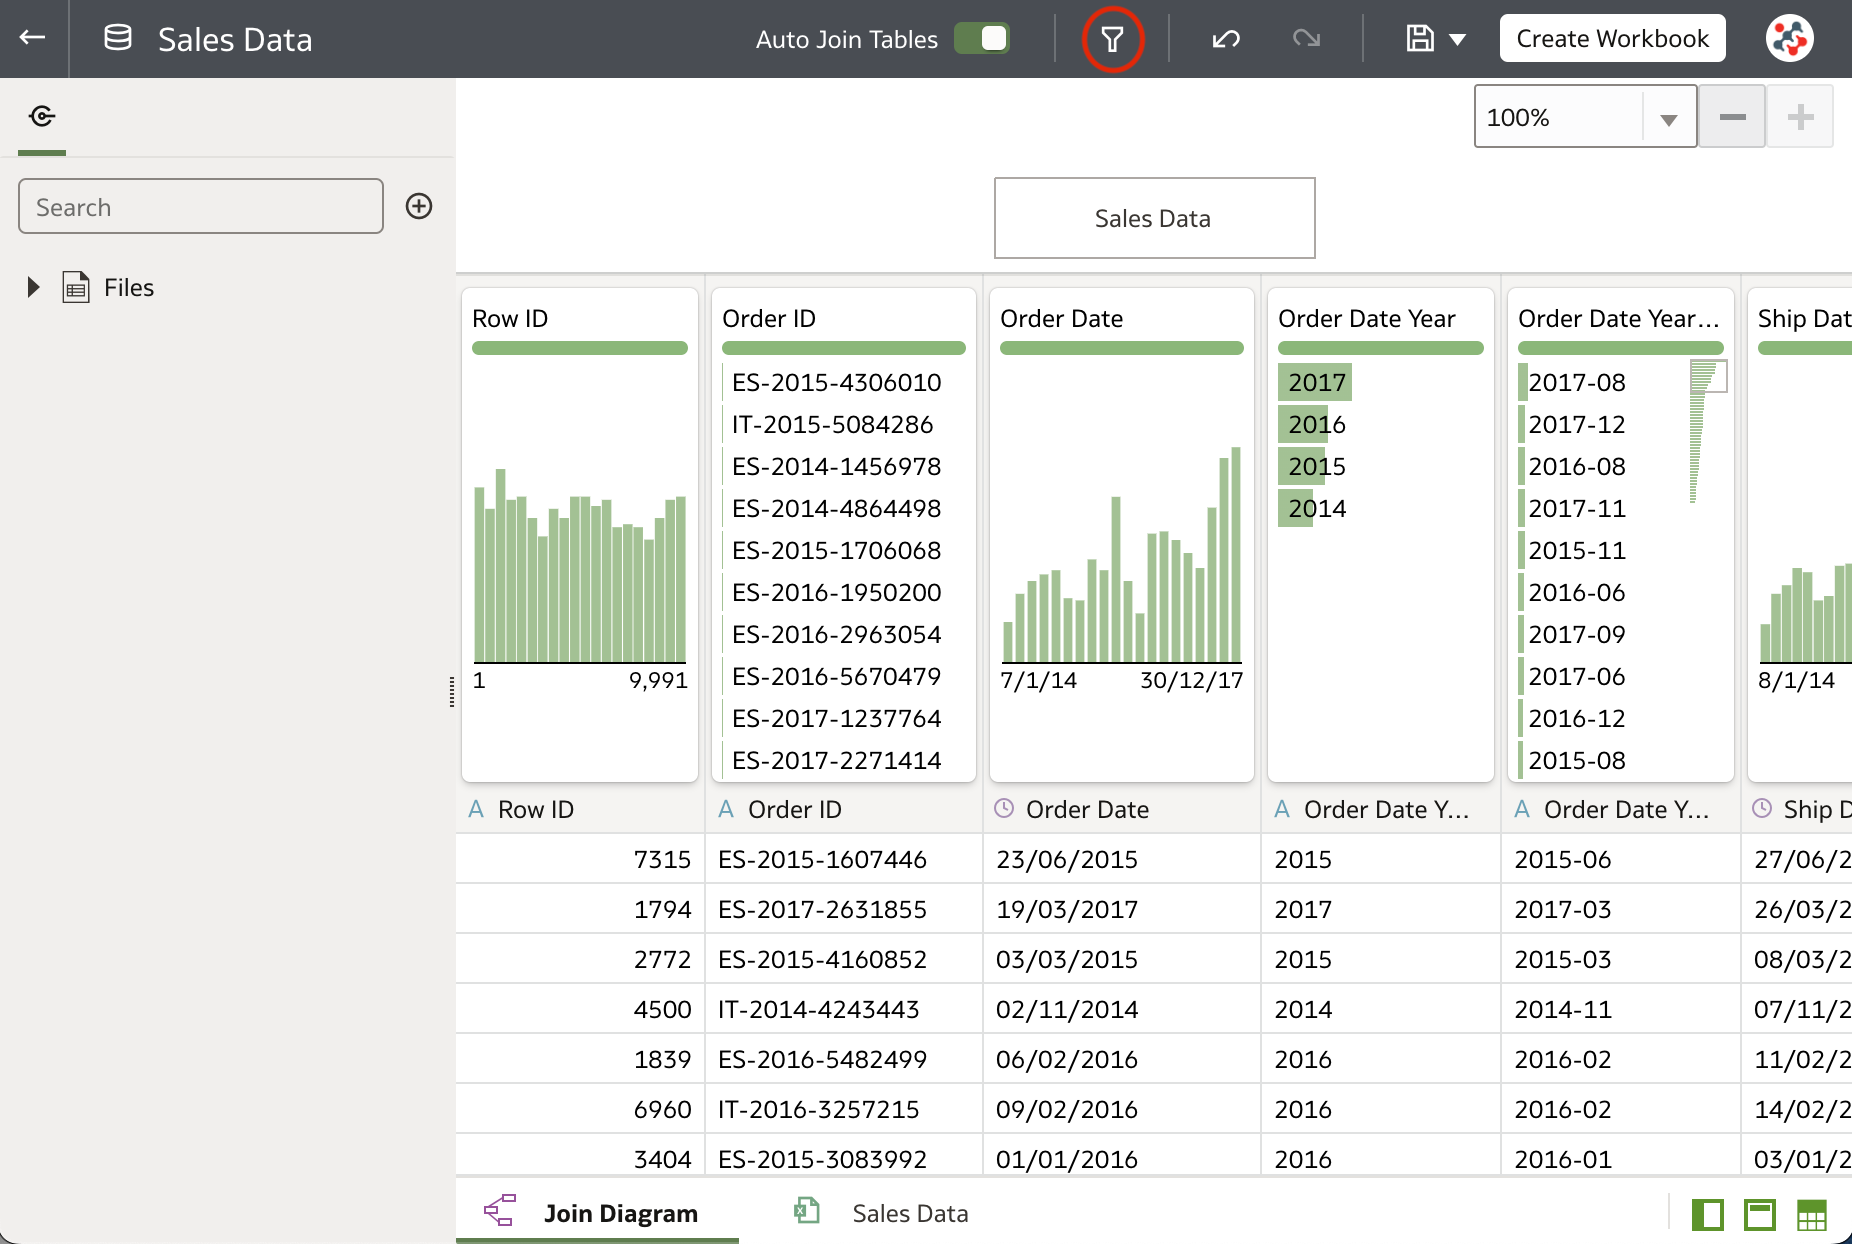
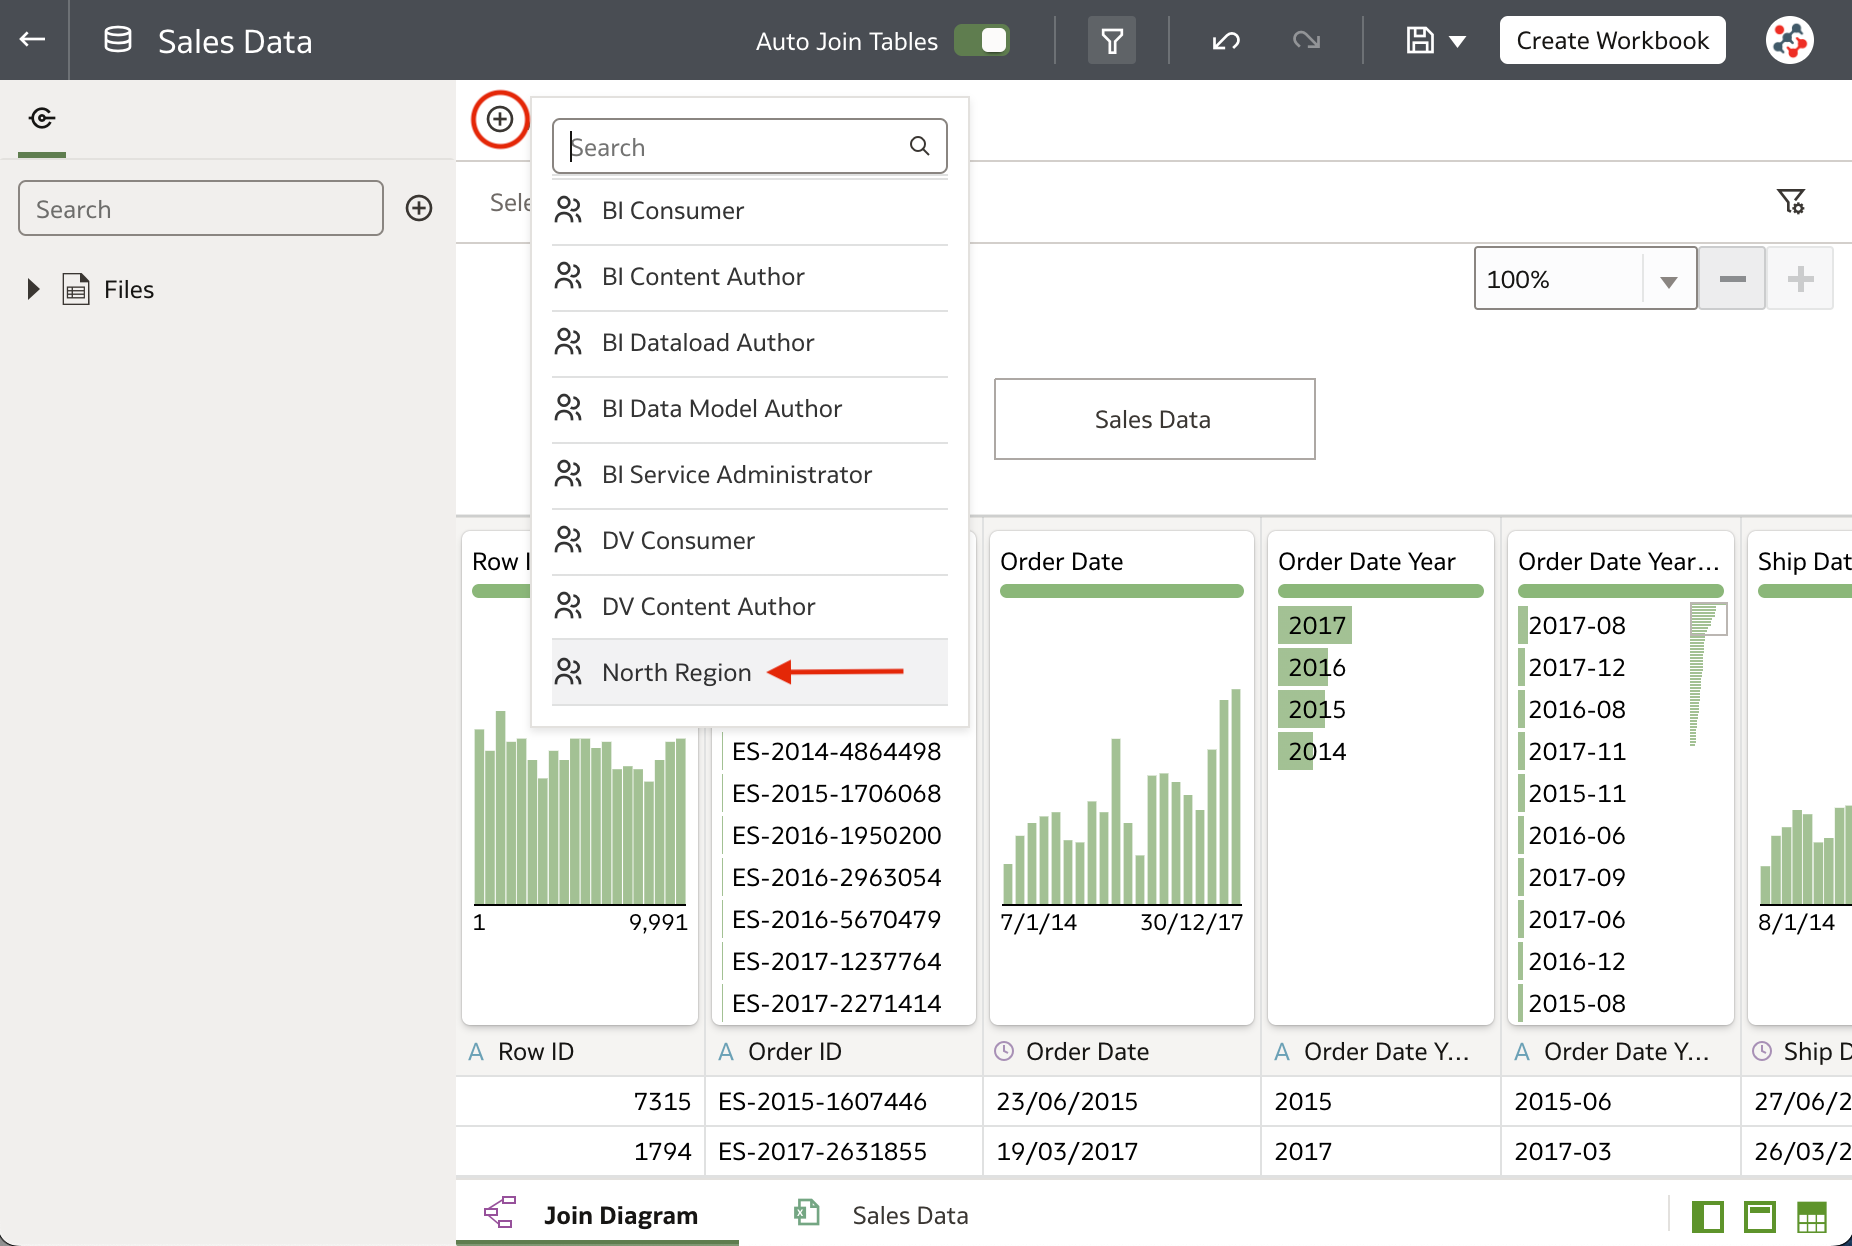
Click on the Add Role icon, and select the application role that you want to use to filter the dataset (Figure 2).
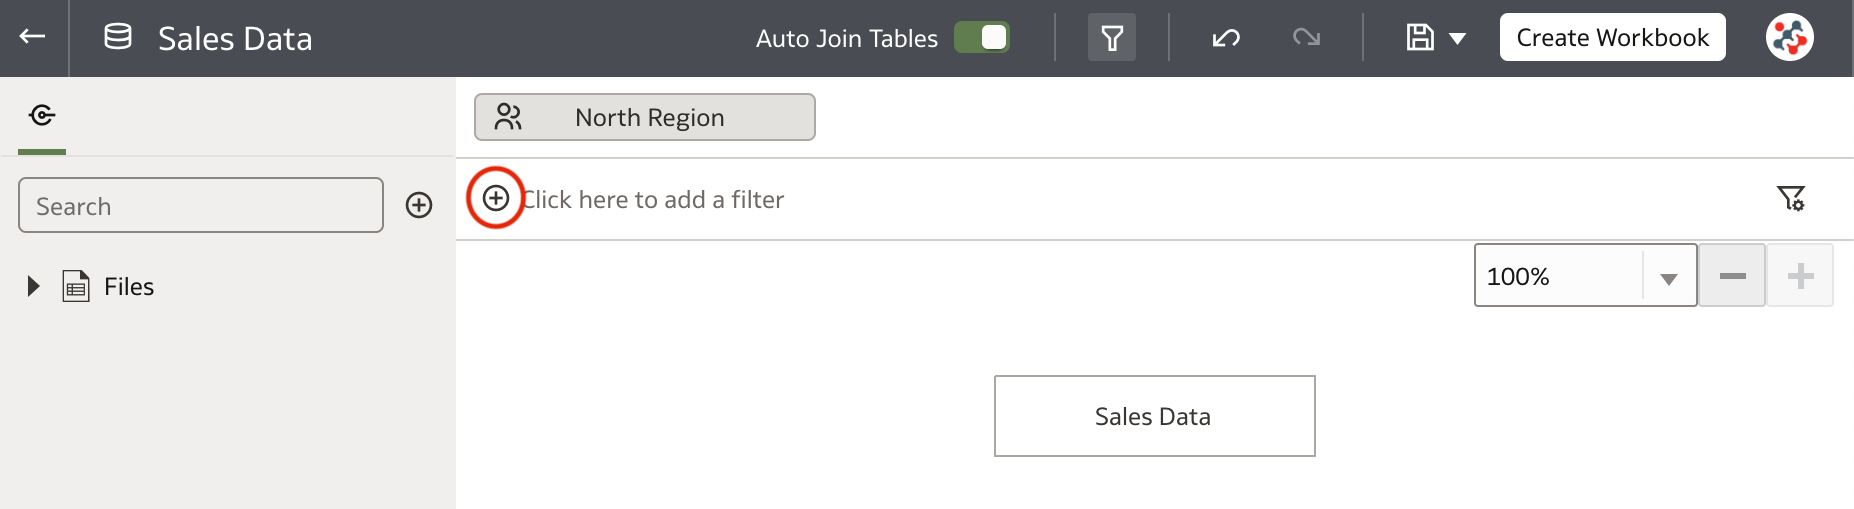
Click on the Add Filter icon (Figure 3).
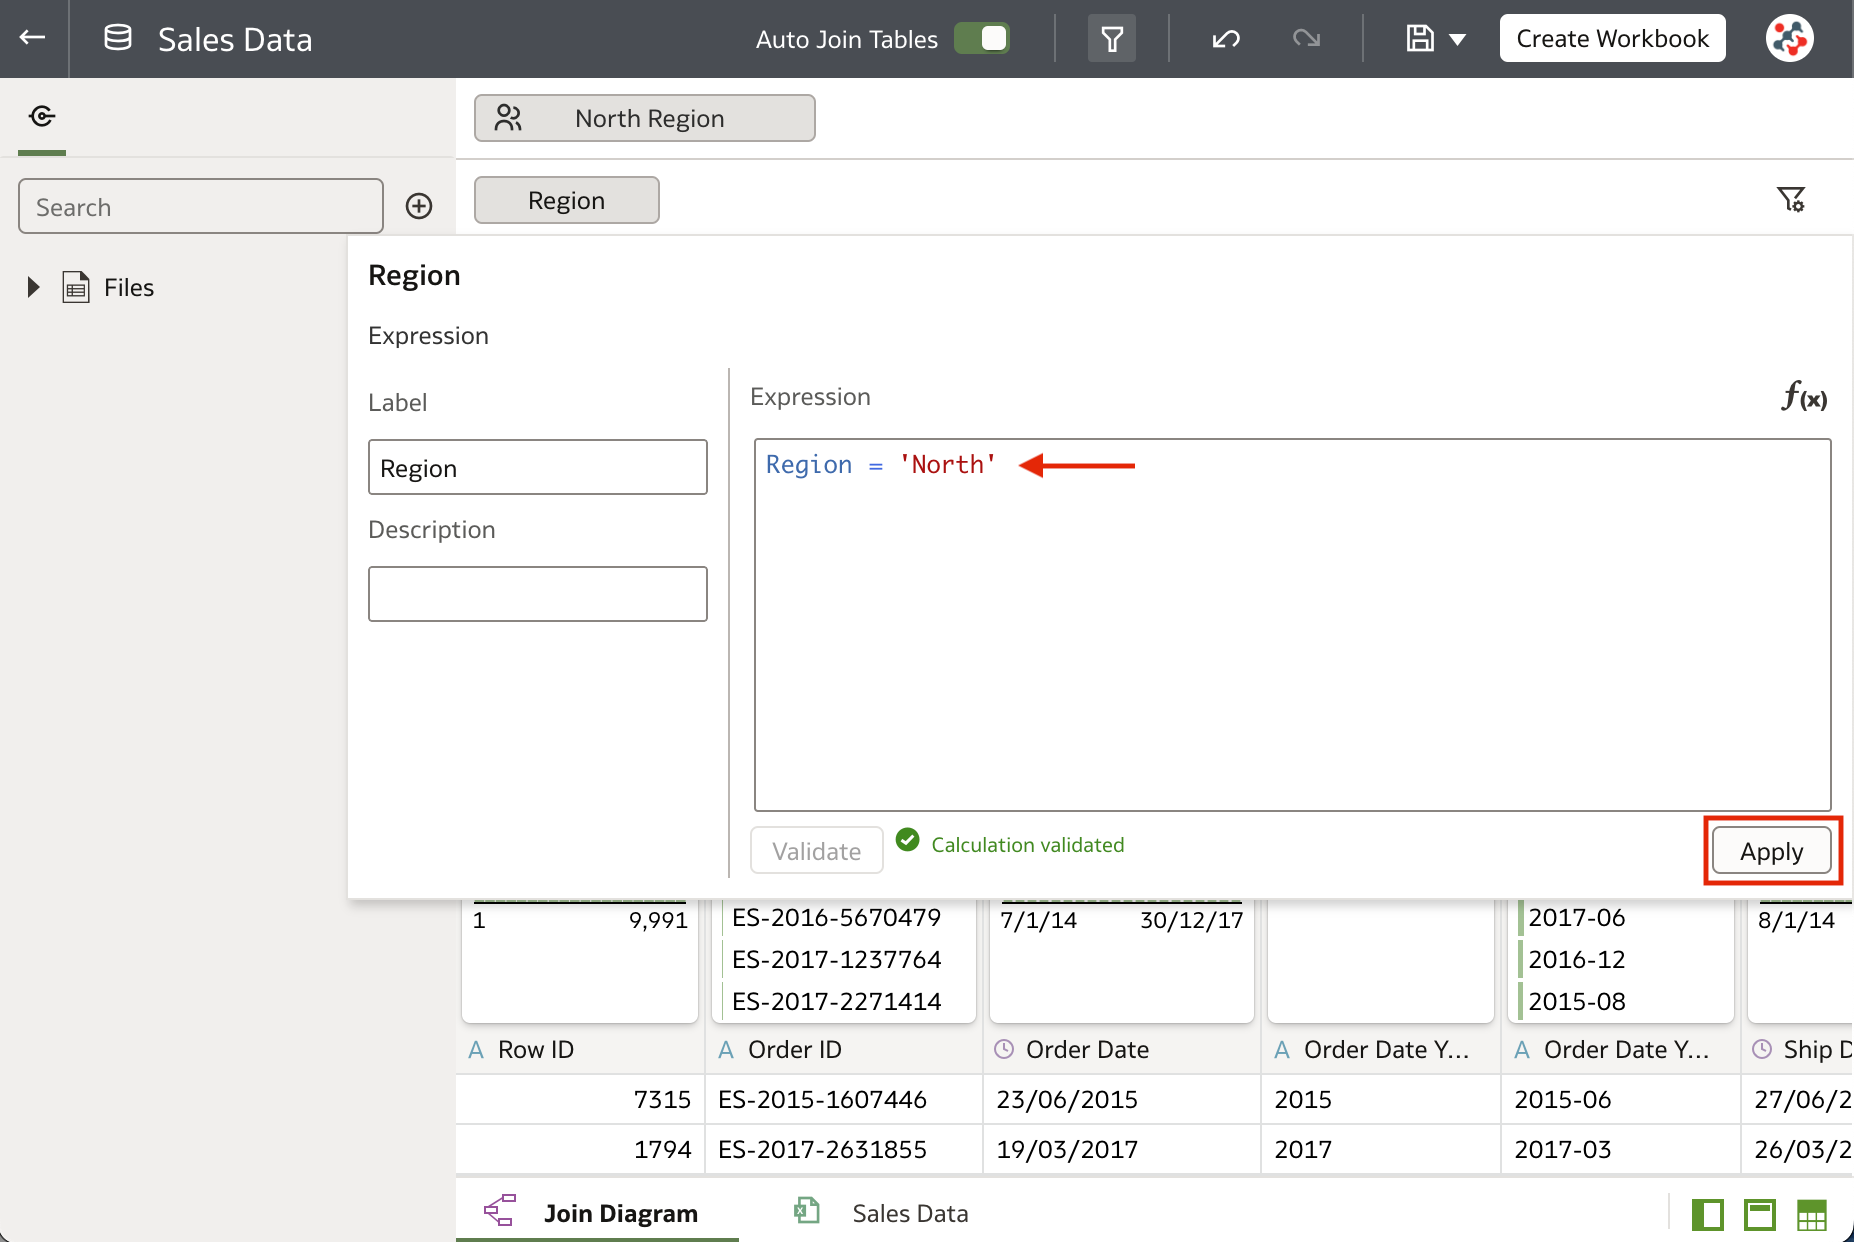
In the Expression Filter editor, enter the logical expression that filters the data, validate it, and click on the Apply button (Figure 4).
Role-based filters are applied when users access the dataset from workbooks or data flows, but they don't affect the preview data displayed in the dataset editor.
Role-based filters may look the same as row-level security rules in the repository at a first sight, but they are quite different. It's worth noting that when you setup a role-based filter on a dataset, any user who does not have that role won't be able to see any data, including the dataset owner! While Oracle recommends to create an additional filter for super users with the expression 1=1 to see all data, this is not consistent with what happens in the repository where any user not covered by a rule is able to see all data. I find the way role-base filters work is not intuitive and will confuse people used to setting up row-level security in the repository. Let's hope that this will be addressed by Oracle in a future update.
Enhanced Parameters
Parameters were the most important feature introduced in the March 2023 Update, and they have been further improved.
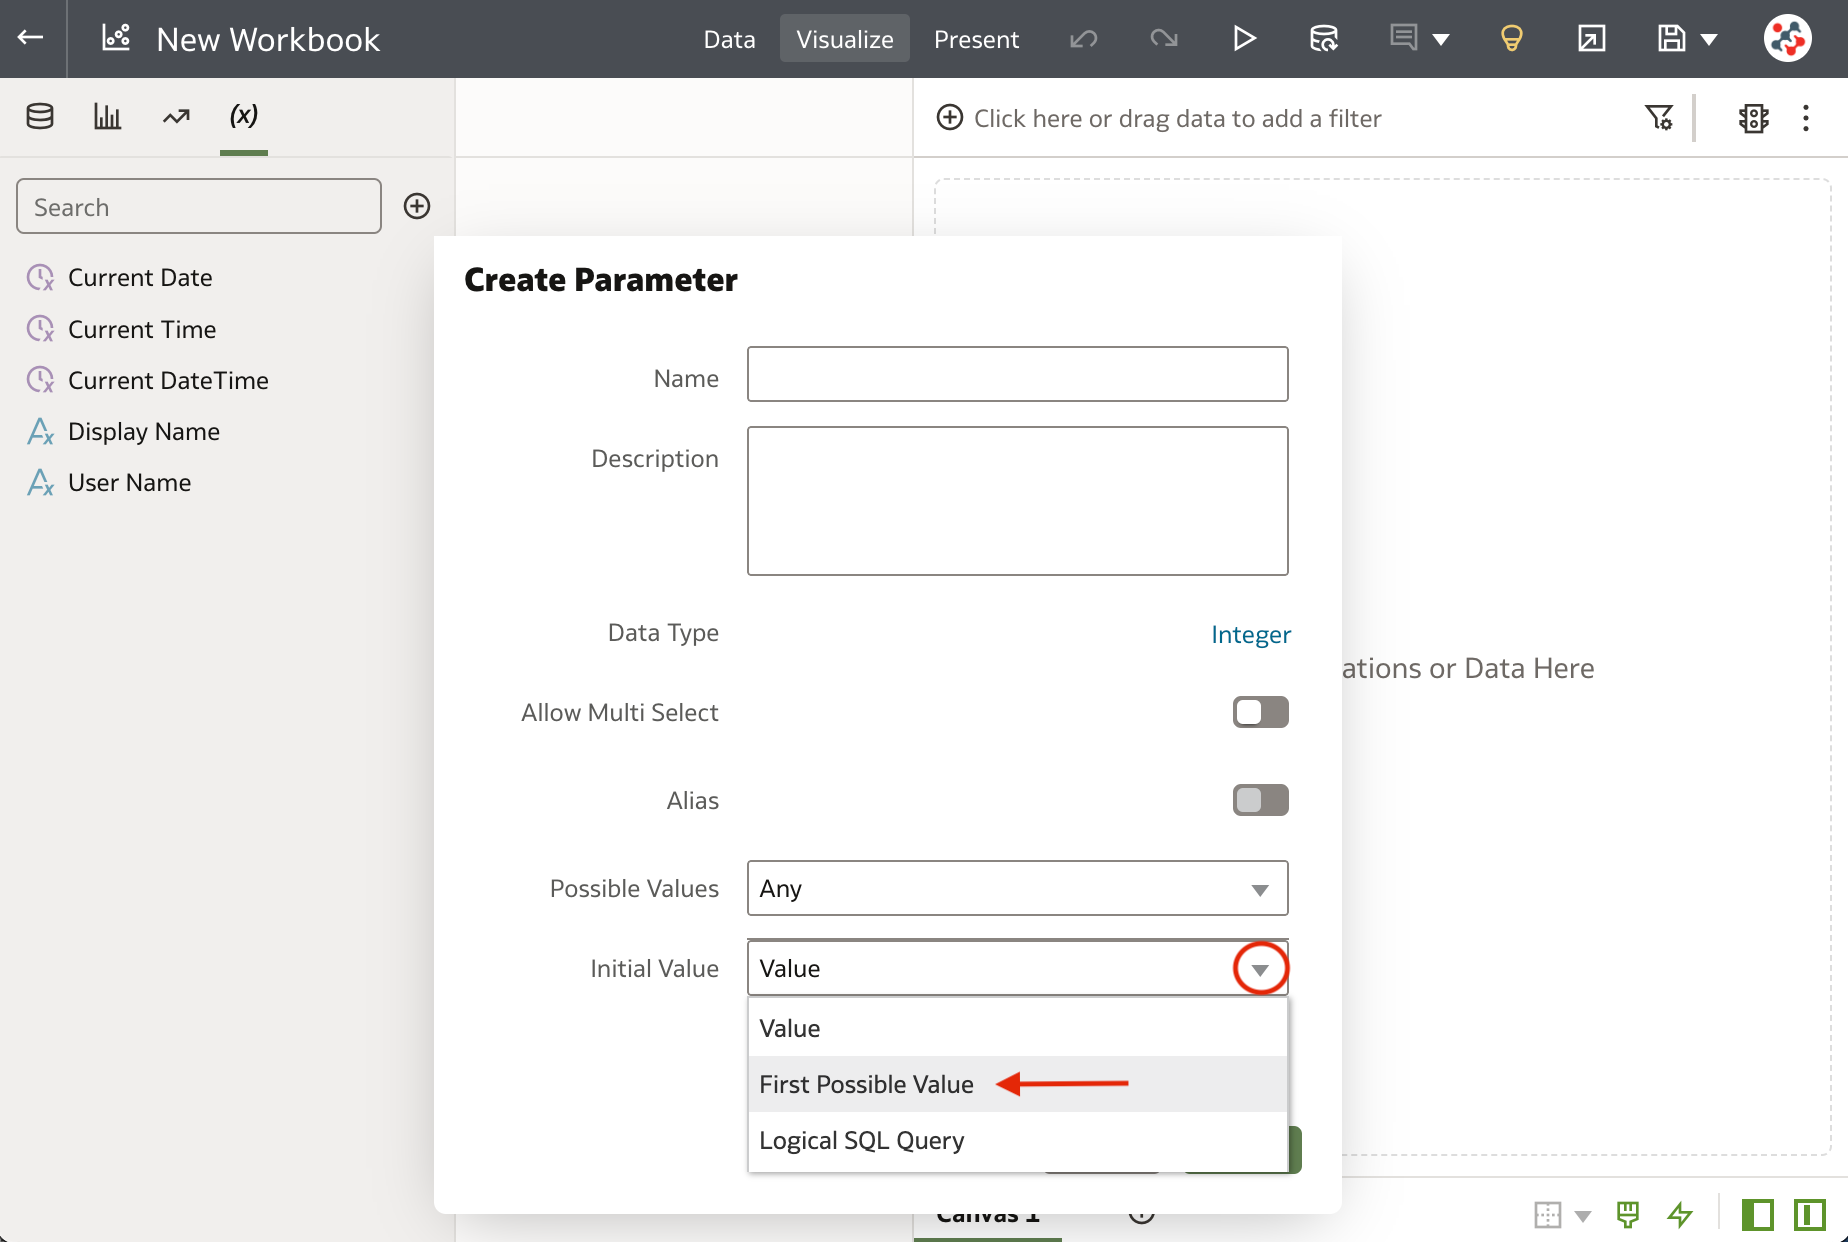
When you define a parameter it's no longer required to initialize it with a default value. If you are planning to do it, the Initial Value property in the Create Parameter dialog contains a new option, First Possible Value, which allows us to use the first possible data value as the initial value (Figure 5).
Moreover, parameters can now be used to customize secondary measure labels on Tile visualizations (previously it was possible to do it only for the primary one).
Enhanced Conditional Formatting
The conditional formatting feature allows us to highlight with different colors and fonts important events in data when it meets specified condition rules.
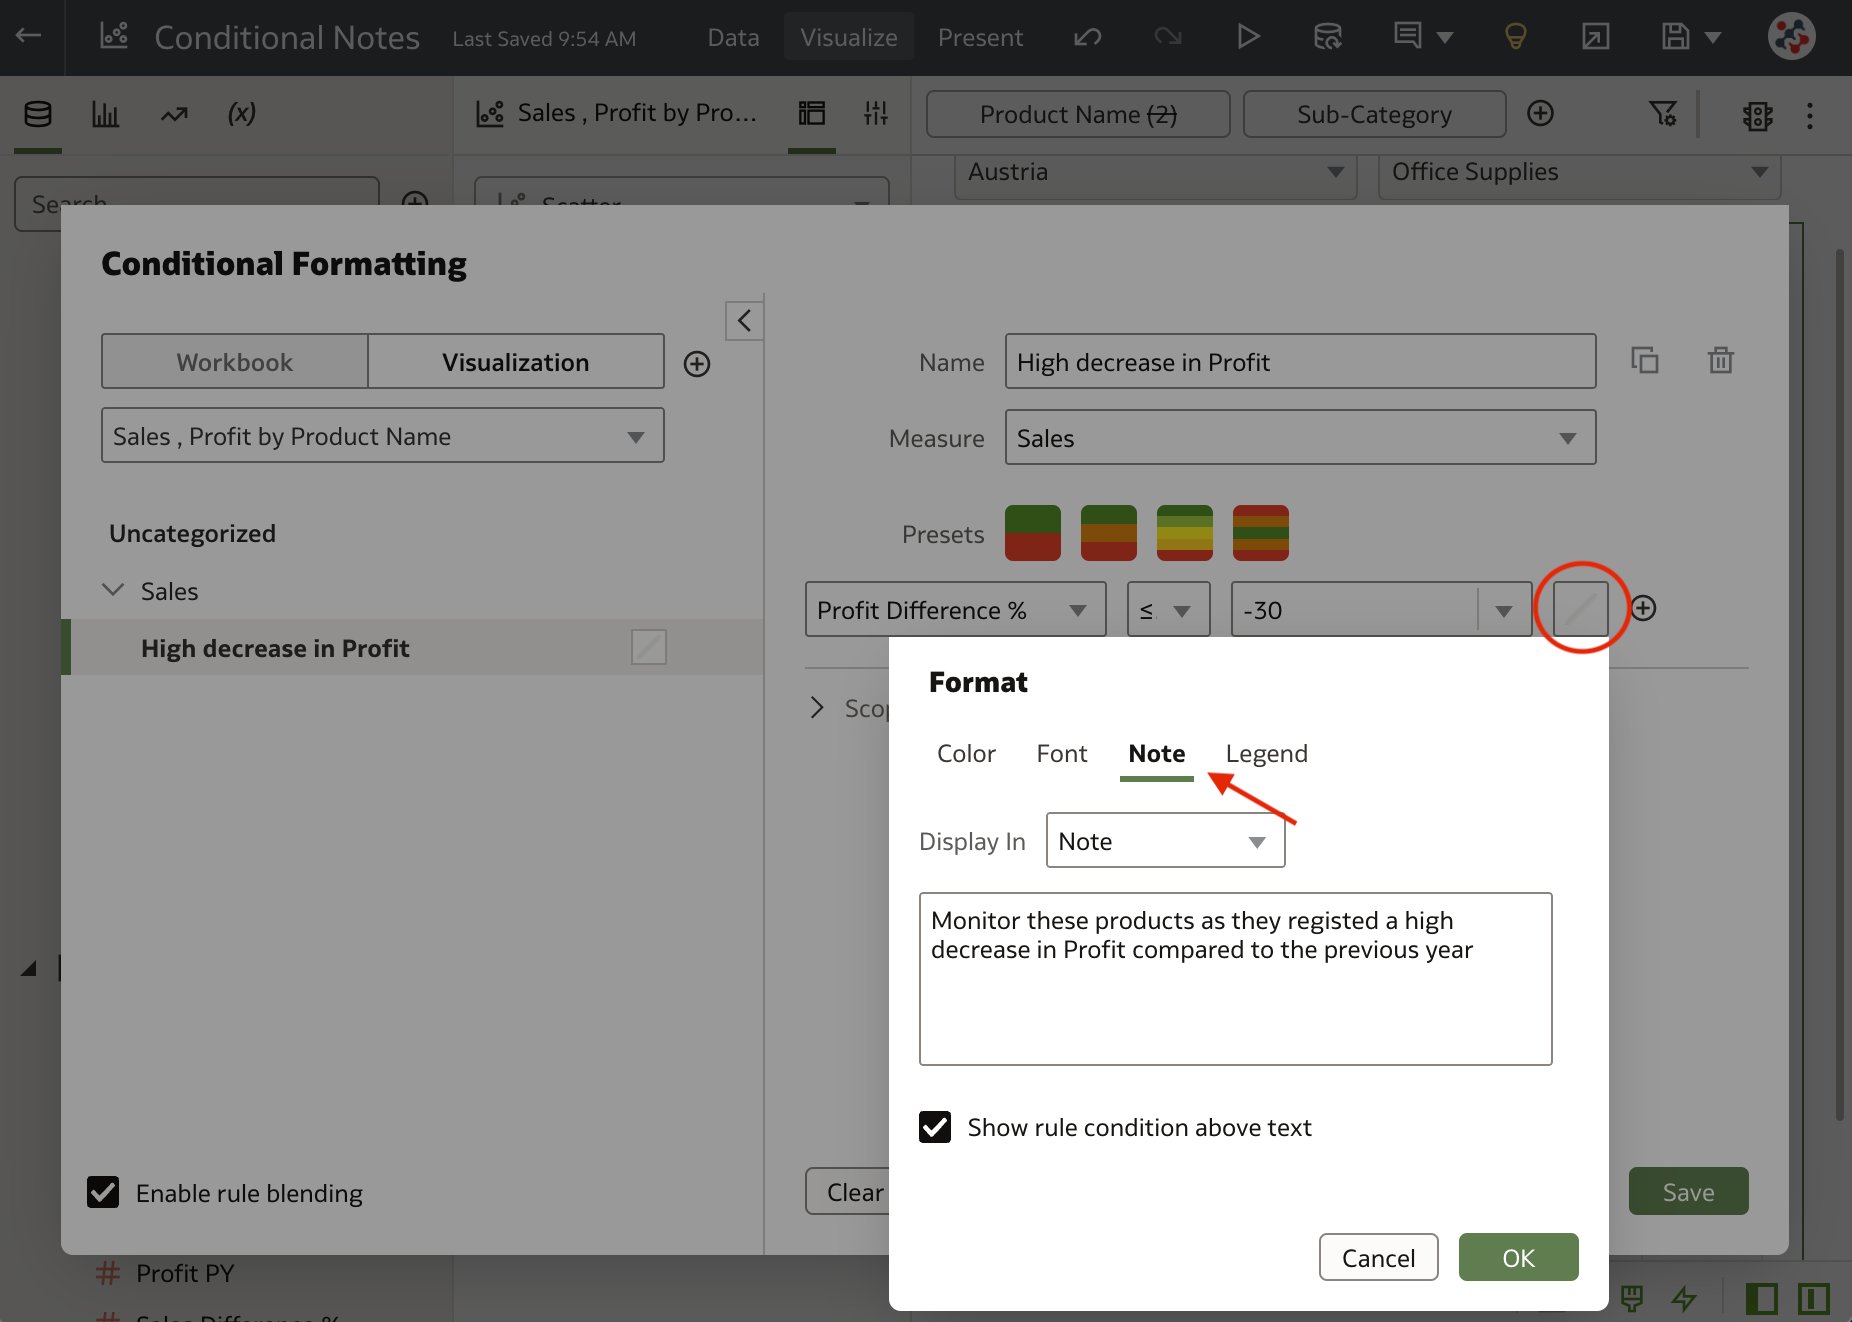
With the May 2023 Update it's also possible to annotate data at the same time: define your conditional formatting rule as usual, click on the Format icon, select the Note tab, and enter your note text (Figure 6)!
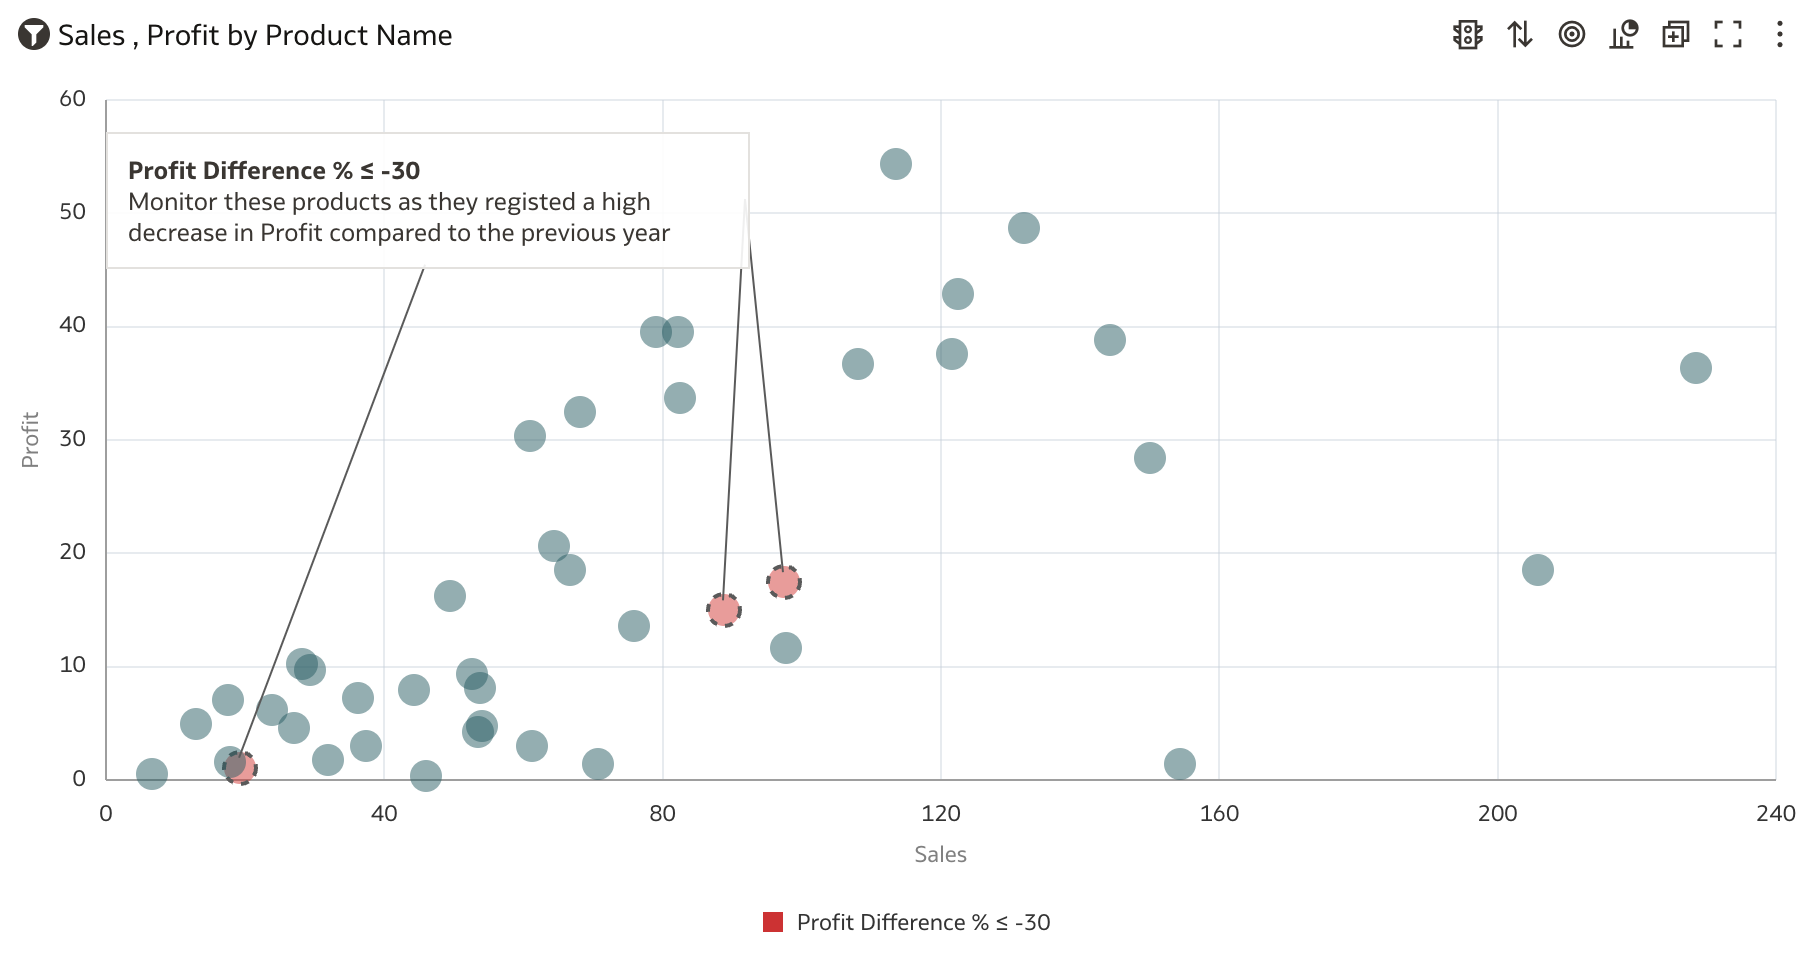
Combined conditional annotations and formatting make it easier to identify critical data that requires our attention (Figure 7). It would be great if highlighted data could be converted to a filter in a click, but this is not possible yet as you have to manually select the data of interest first: what a shame!
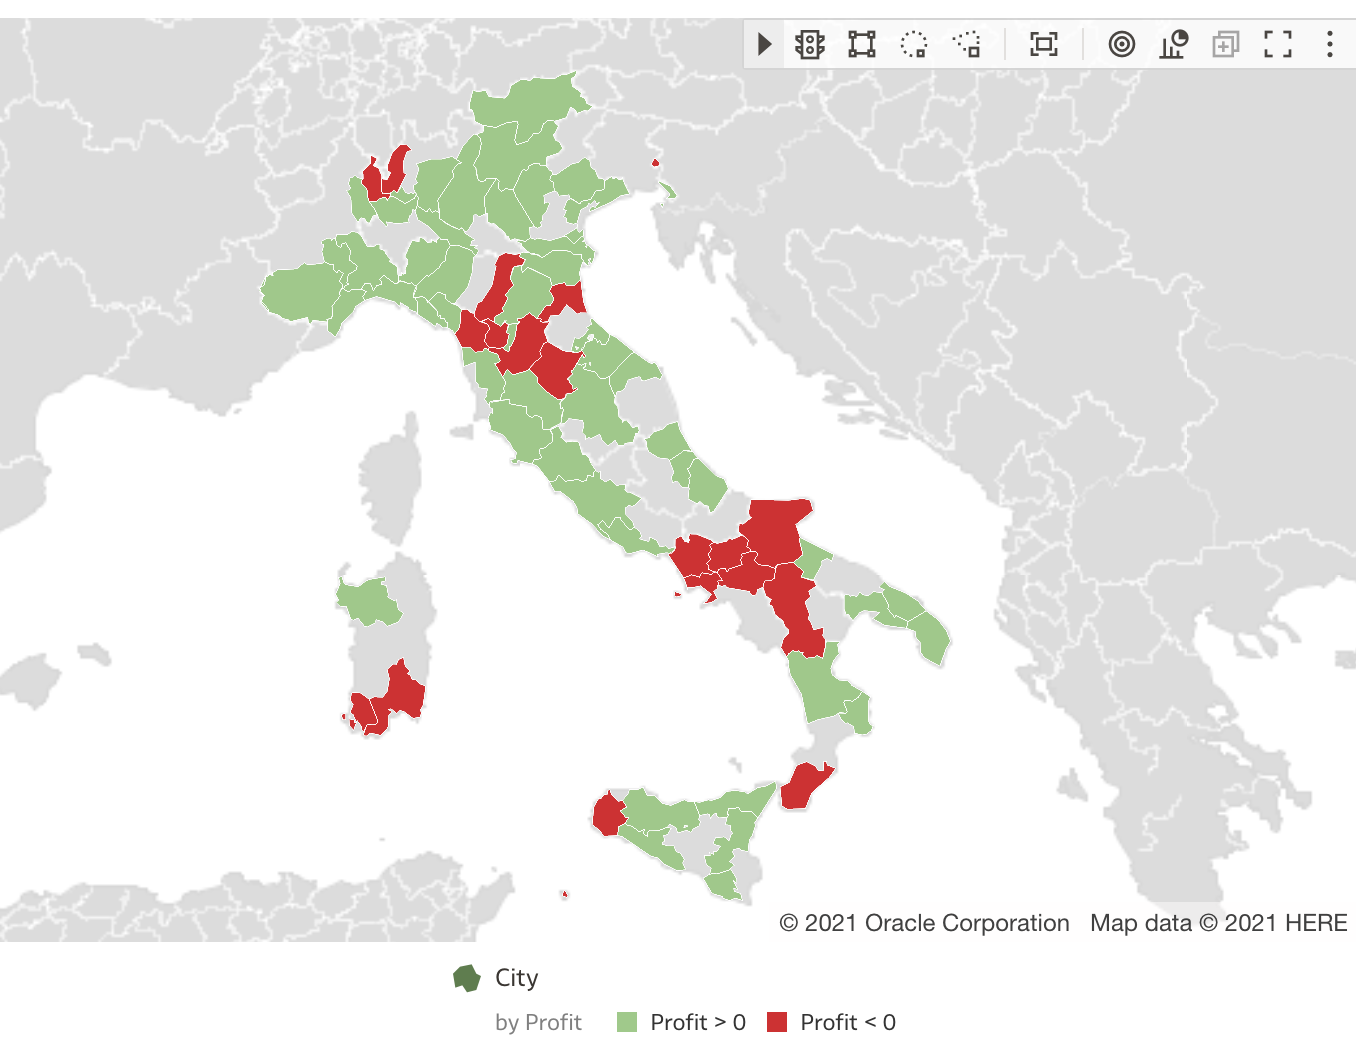
Conditional formatting can be applied to Map visualizations as well now (Figure 8), however this visualization type does not support attaching data to notes! 🤦🏻♂️
Transform Data Using Replace Value List
The dataset editor includes a new option which allows us to replace multiple values for a given column in a single preparation step with a really intuitive interface.
Expand the Options menu for the column that you want to transform, and select the Replace Value List option (Figure 9).
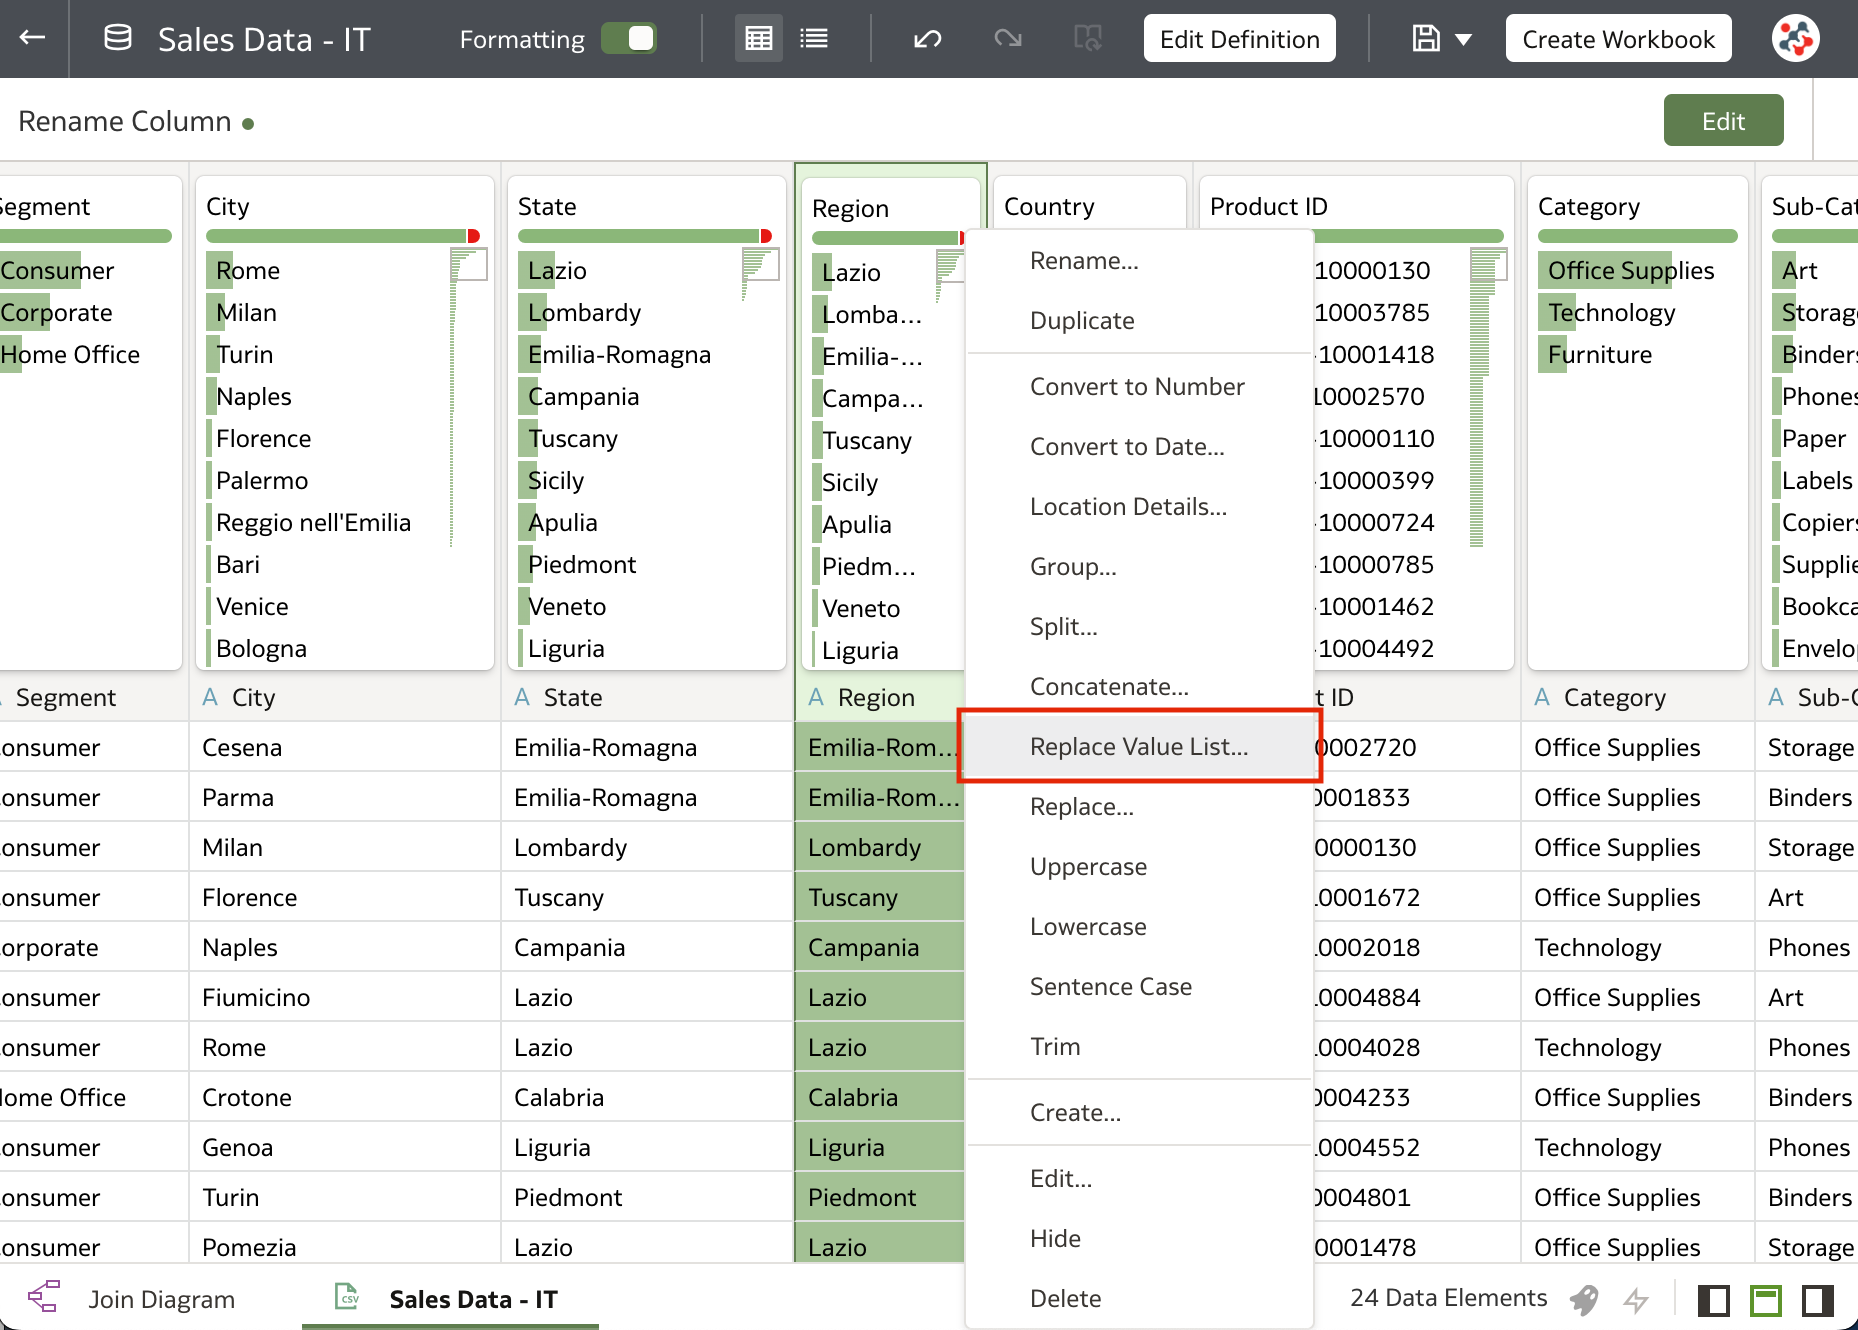
The left hand side of the Replace List pane is populated with the original values, and by double clicking on the right hand side we can start typing the replacement values (Figure 10).
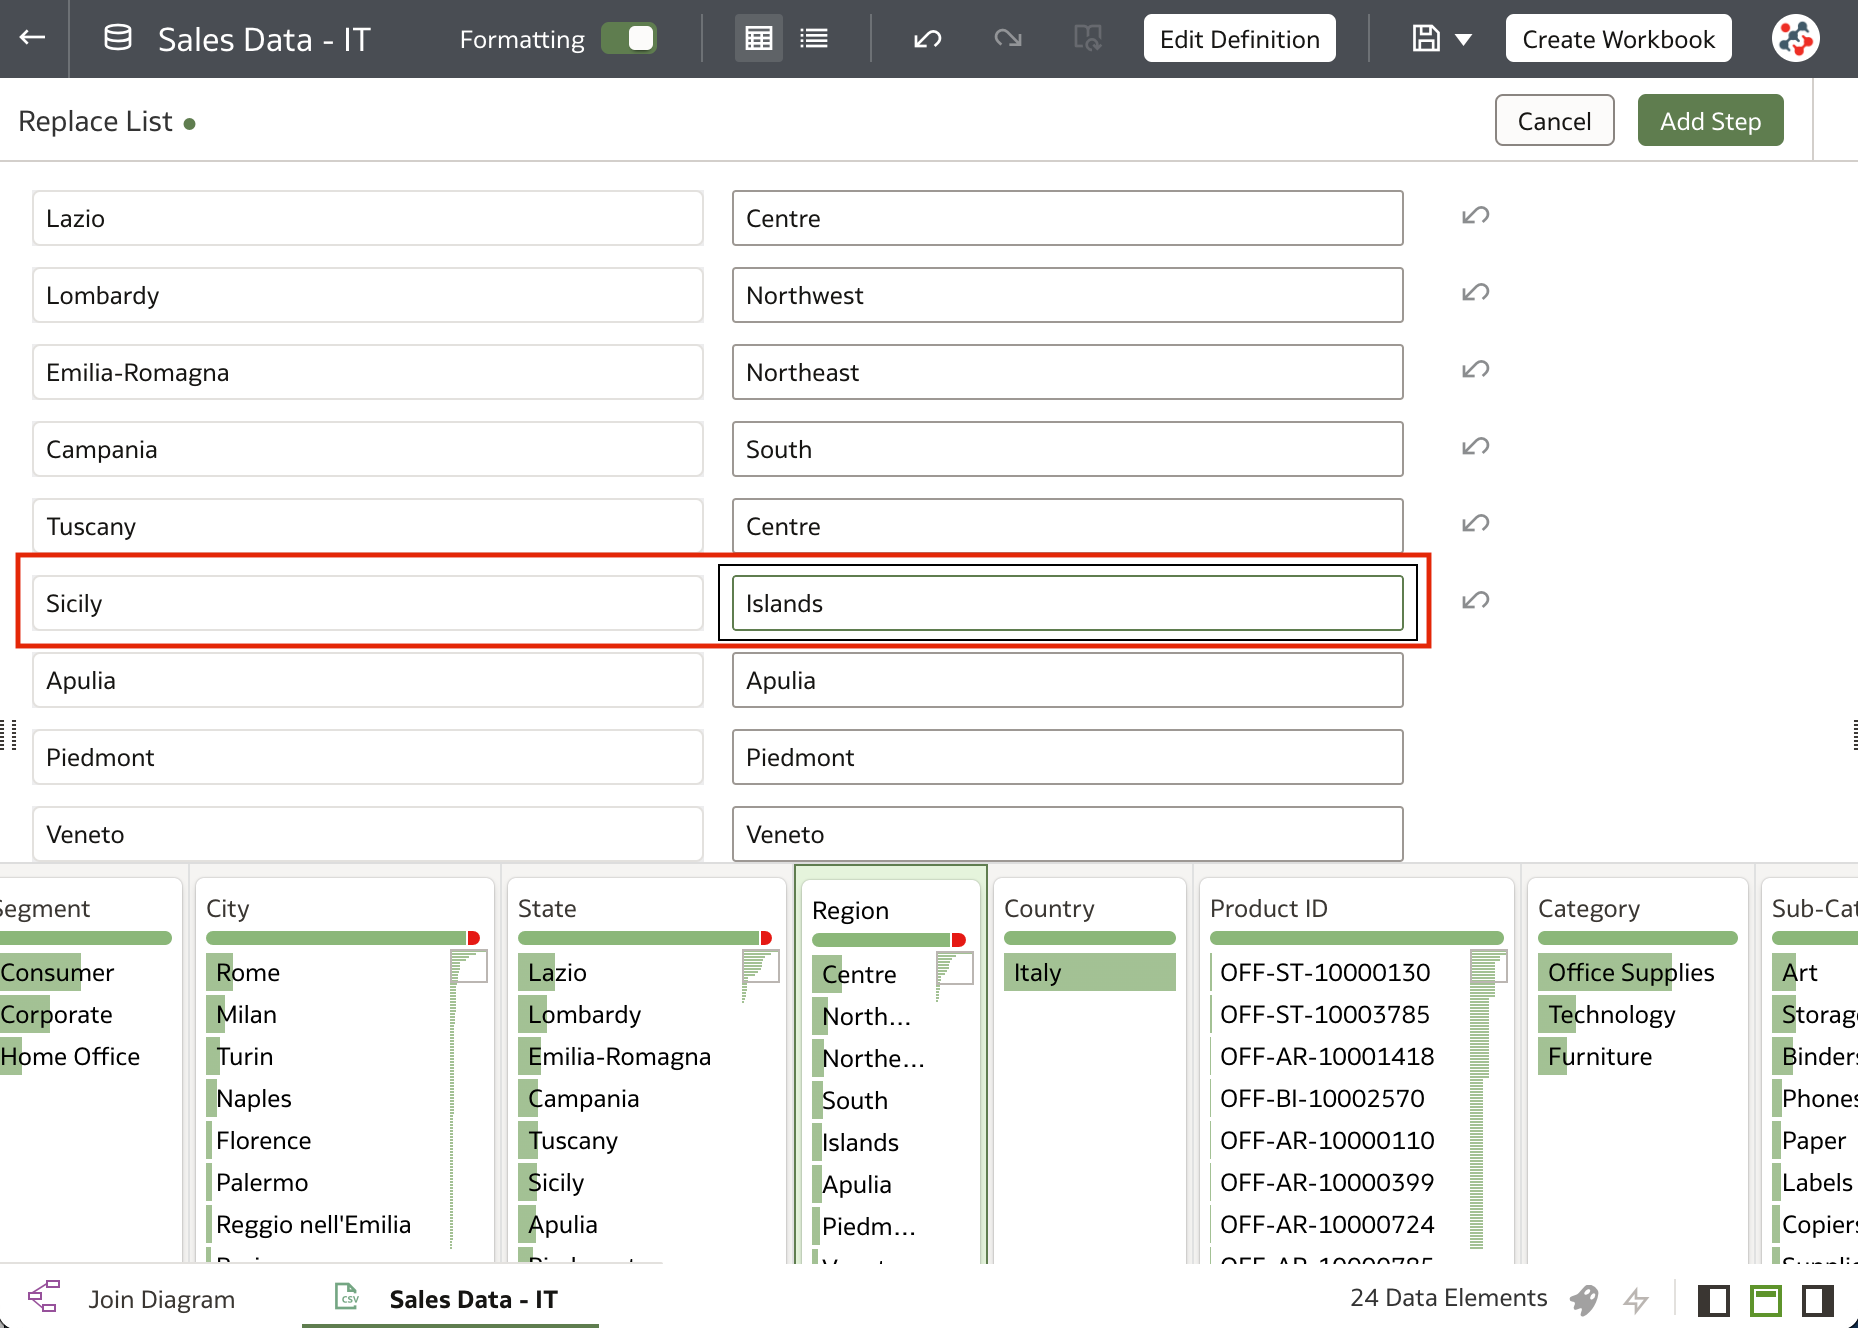
This feature is great for standardizing values, cleaning invalid data, and creating custom groupings. Original values are not lost once replacement values are applied, but preserved in the Replace List preparation step which can be updated whenever we need.
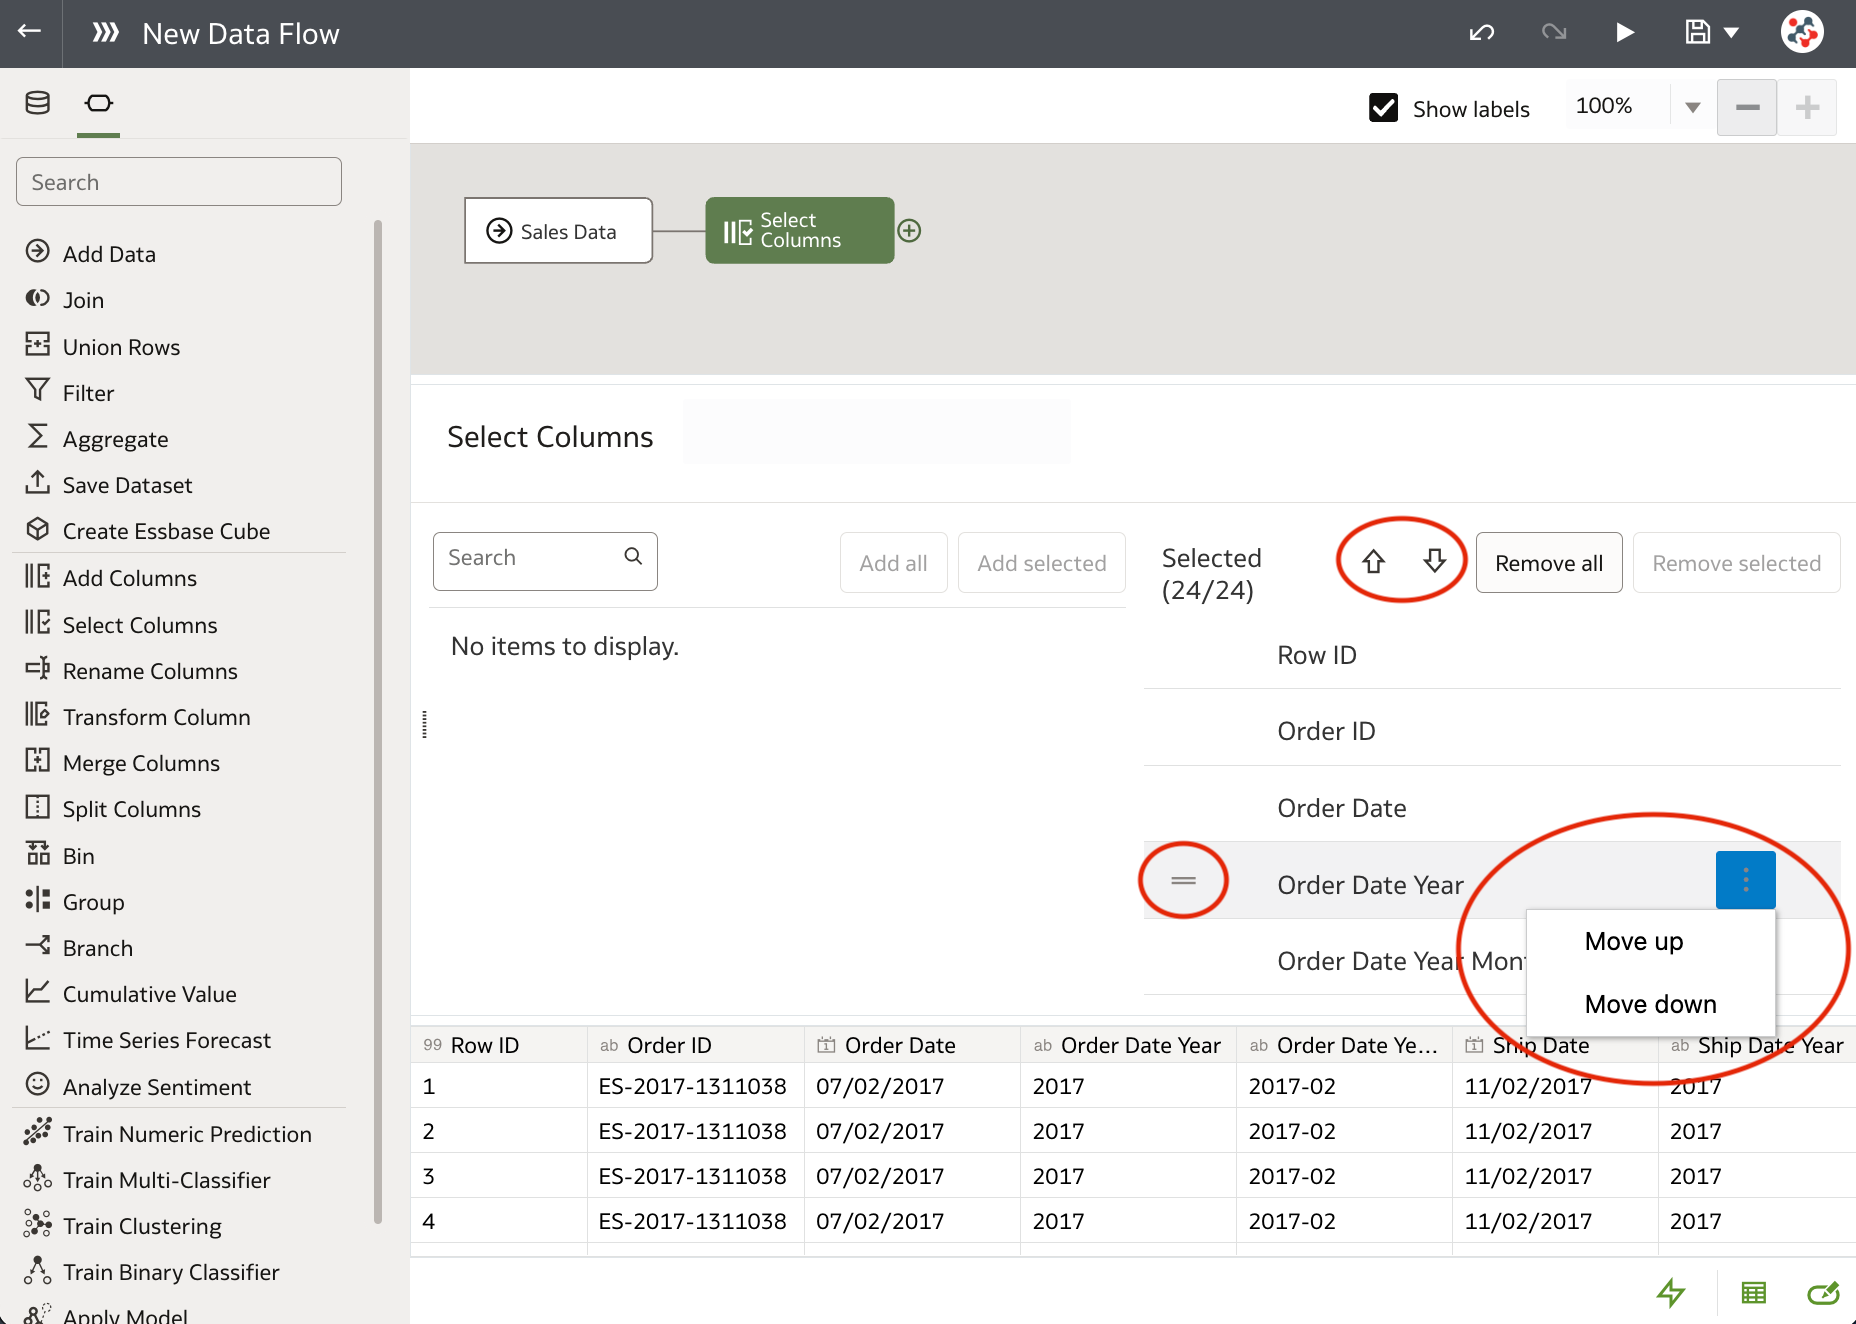
Reorder Columns in Data Flows
The Select Columns step in data flows has been improved and includes new icons and actions that allow us to easily reorder columns (Figure 11).
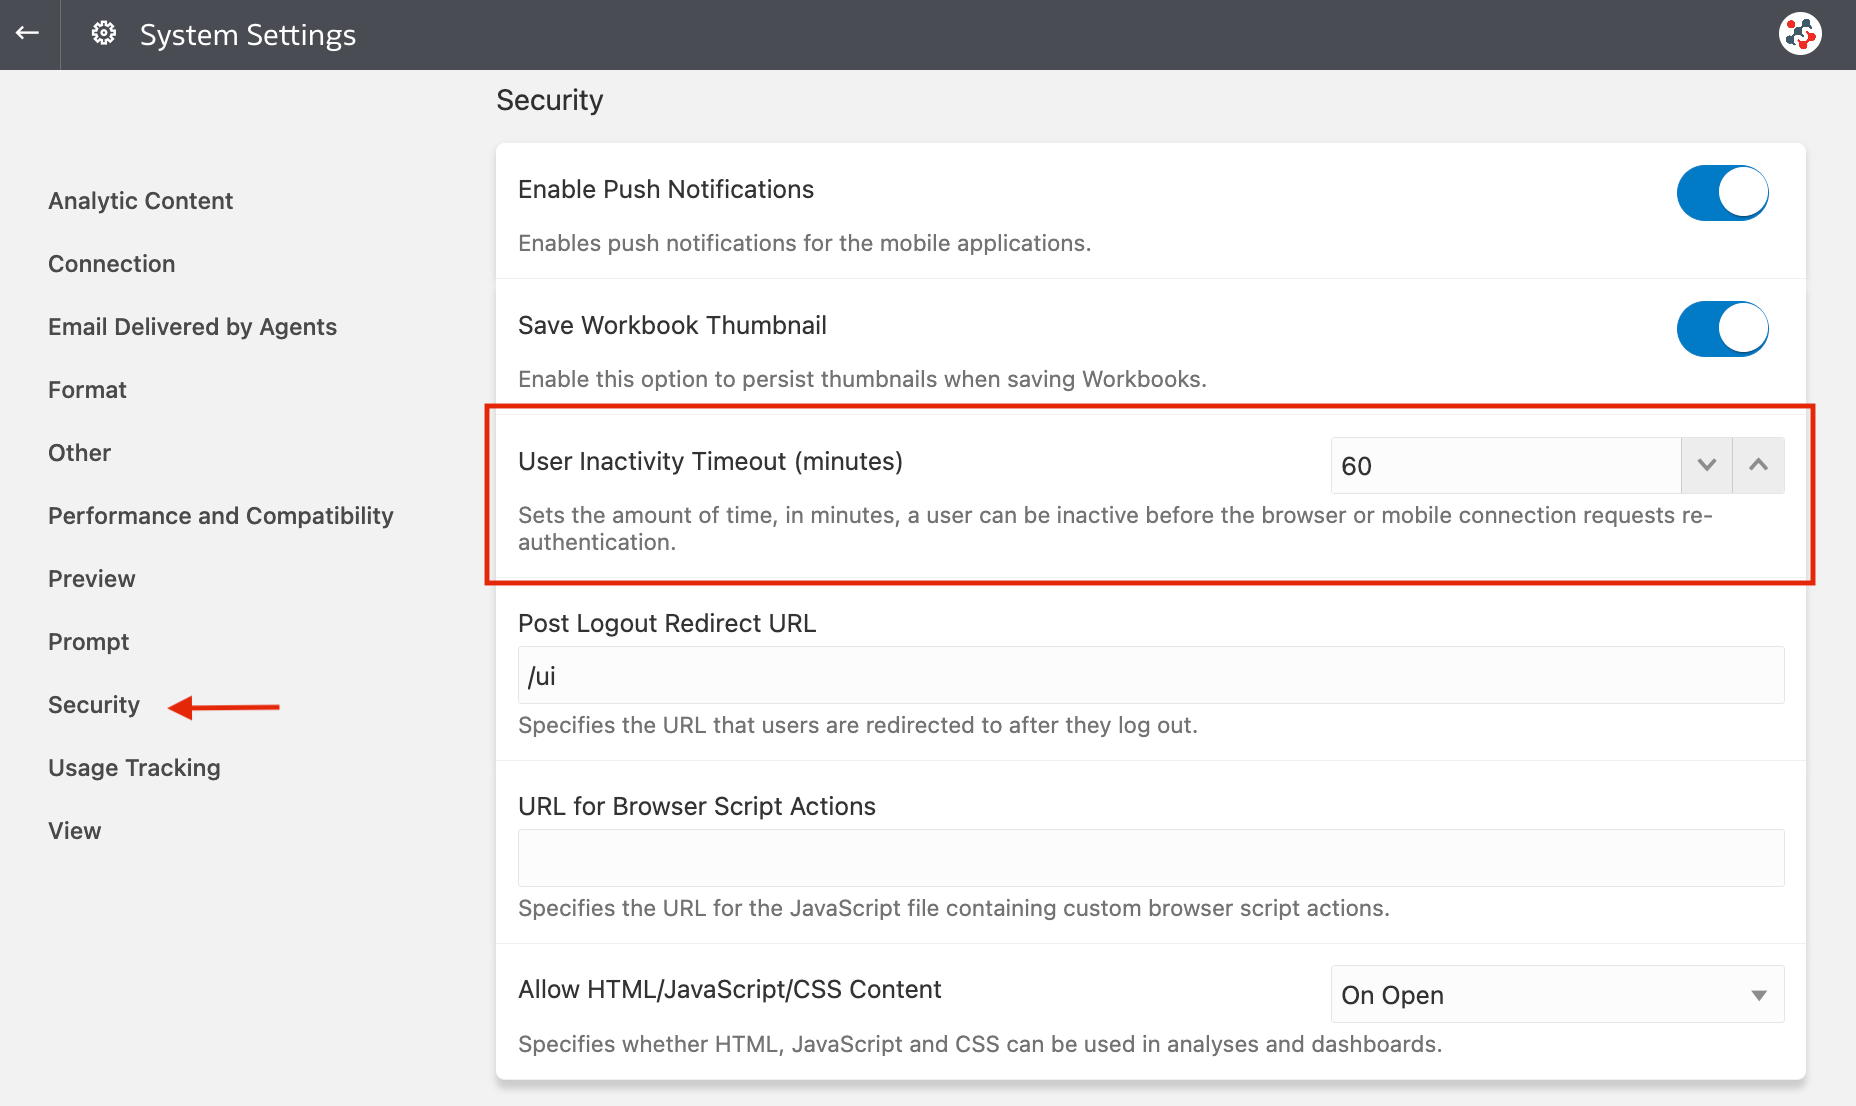
Enhanced System Settings
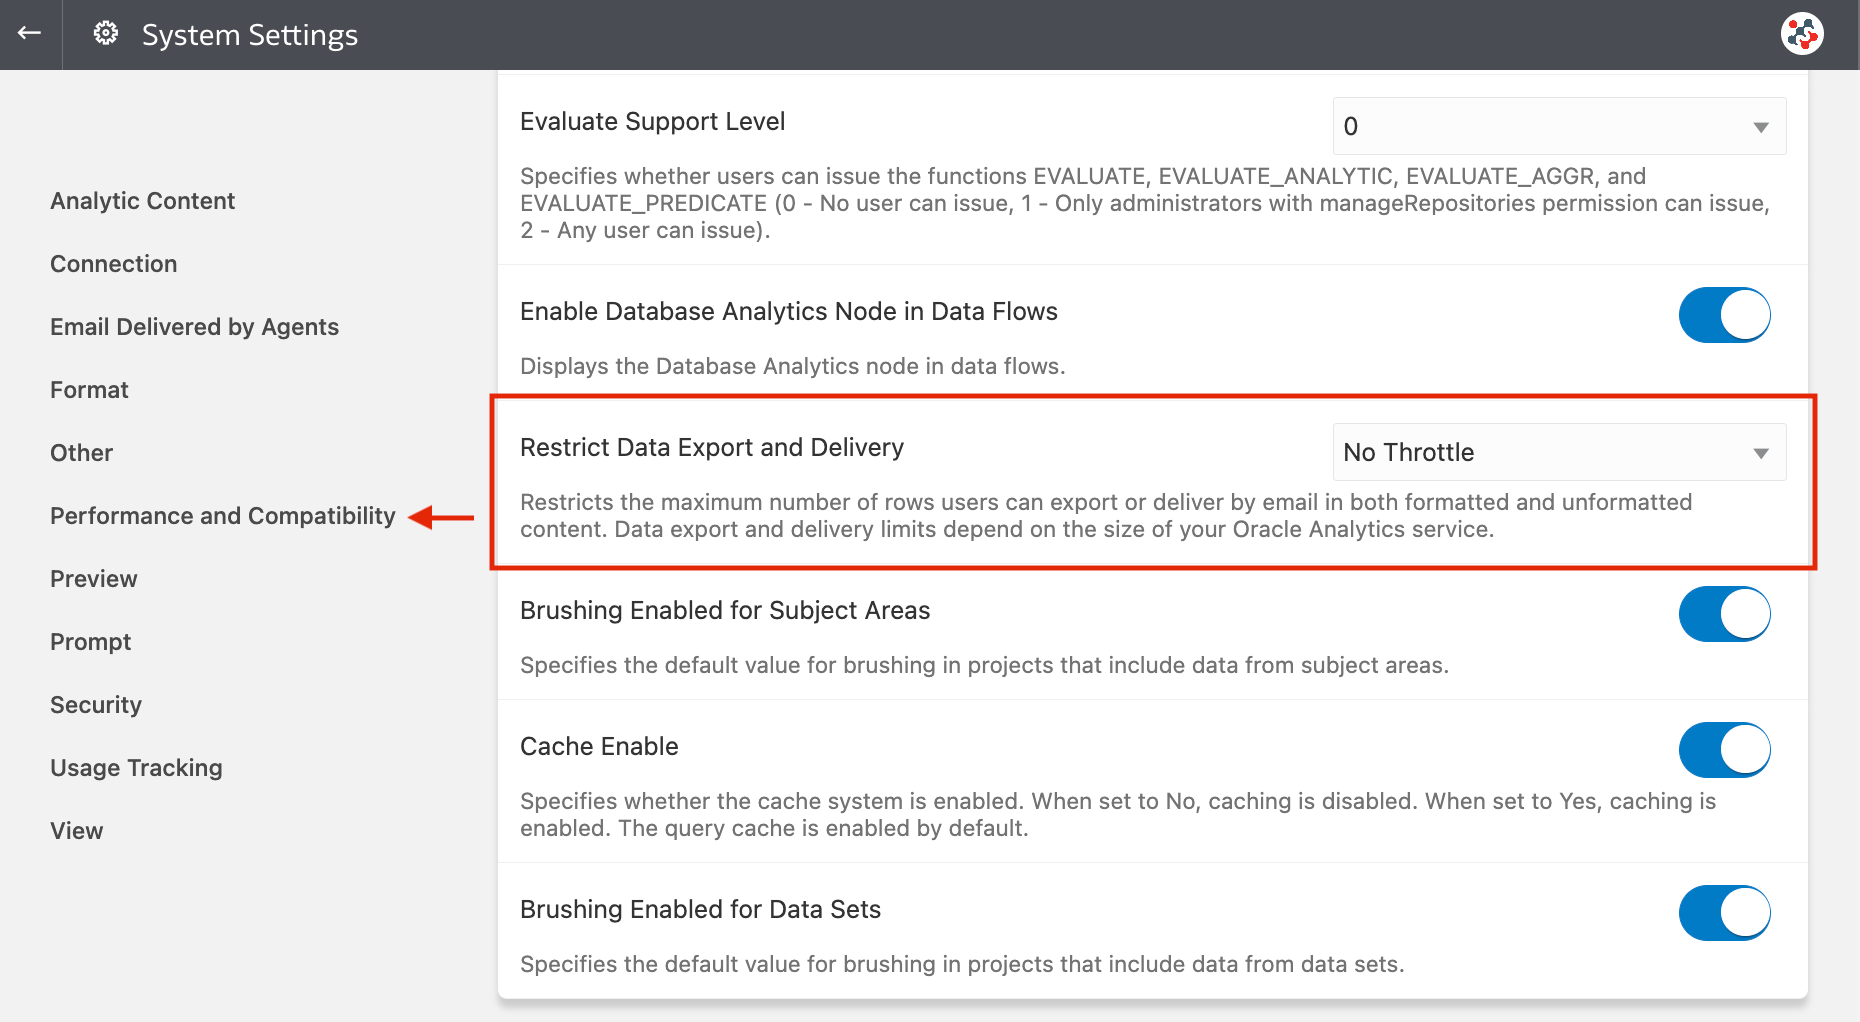
The System Settings page includes new options which allows us to customize the length of time that users are inactive before their browser or mobile connection must be re-authenticated (Figure 12), and limit the maximum number of rows that users can export or deliver by email in formatted and unformatted content (Figure 13).
Other Features
The May 2023 Update also allows users to:
- Copy and paste grammar columns more easily using keyboard shortcuts
- Use enhanced data action rules to provide filter context values to target workbooks
- Create more powerful scatter visualizations using custom color for points, point outline and border, transparency, and connecting related points
- Print all pages in a dashboard in a single action
- Specify the identifier type for database table names and column names
- Use the enhanced Semantic Modeler, a browser-based data modeling tool, to create semantic models
- Connect to OCI Language, Data Science, Machine Learning or Functions using a resource principal as an alternative to an API key
Conclusion
The May 2023 Update includes several new features, enhancements and fixes for Oracle Analytics Cloud that significantly improve the suite.
If you are looking into Oracle Analytics Cloud and want to find out more, please do get in touch or DM us on Twitter @rittmanmead. Rittman Mead can help you with a product demo, training and assist within the migration process.