Oracle Analytics Cloud July 2023 Update: What's New?

The July 2023 Update for Oracle Analytics Cloud came out a few days ago and in this article, I'm going to have a look at the features it includes. If you are also interested in a comprehensive list of the defects fixed by the update, please refer to Doc ID 2919336.1.
Enhanced Parameters
Parameters are the best feature introduced in 2023, and the July 2023 Update improves them further.
When creating or editing a list filter, it's now possible to bind a parameter to it by clicking on the Bind to Parameter icon. We can bind either an existing parameter (it must have a filter-compatible data type) or a new one by selecting the Creating Parameter option (Figure 1).
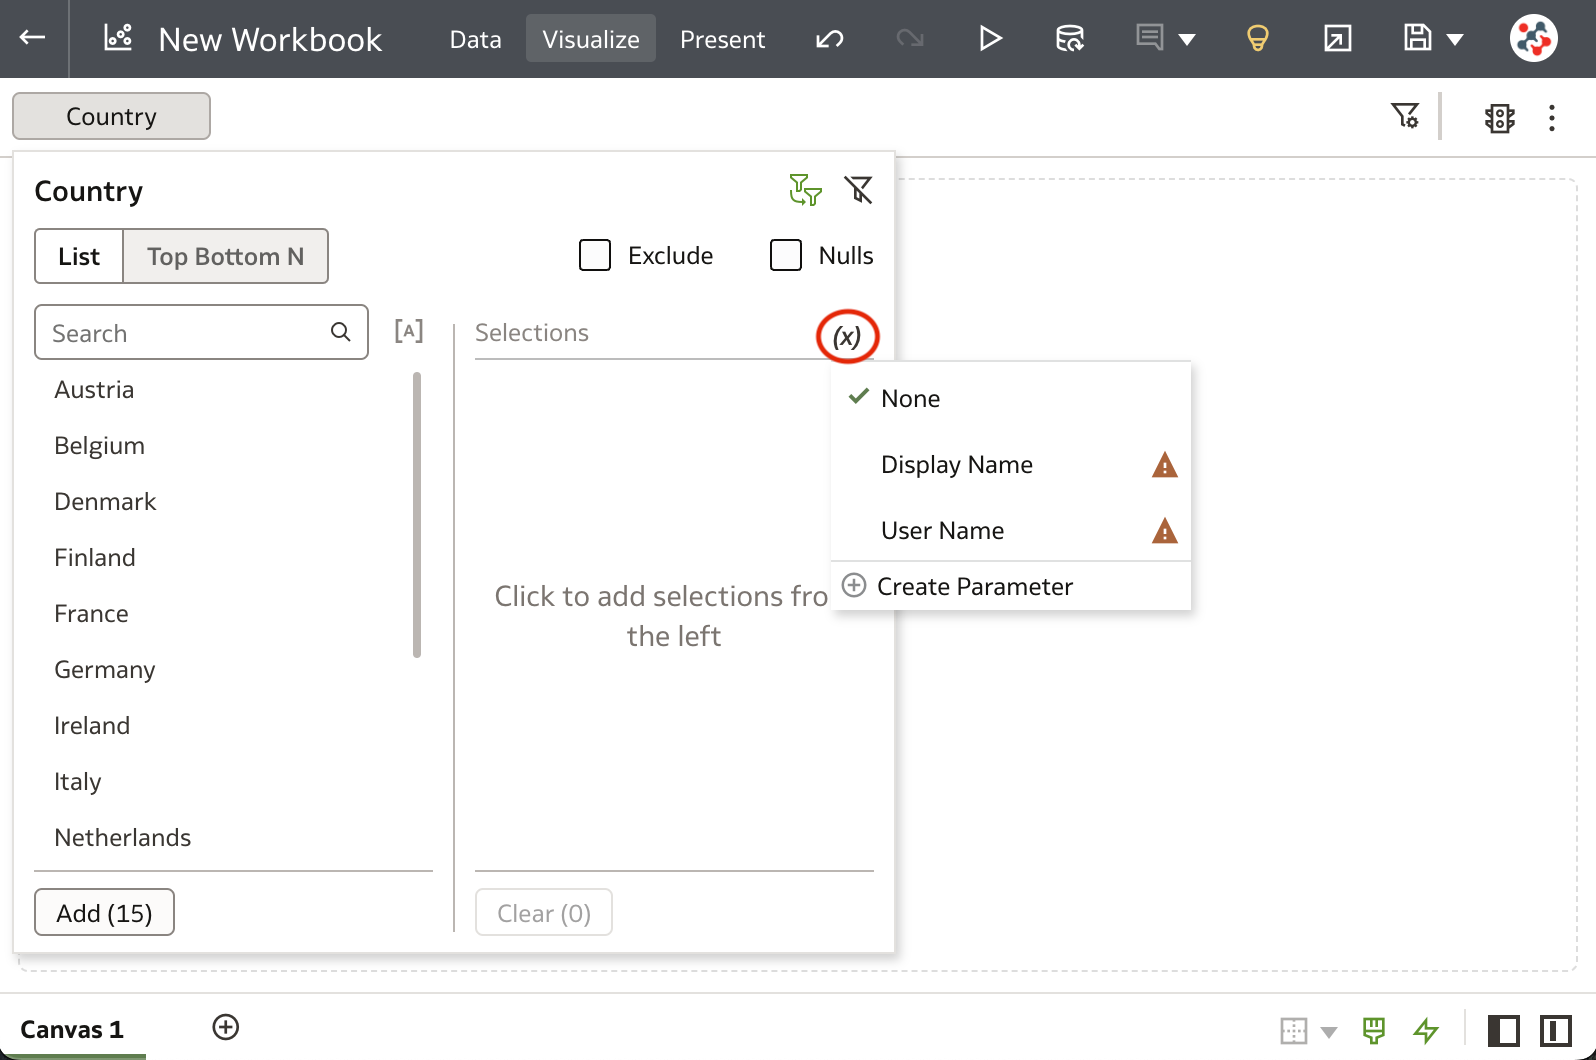
Binding a parameter to a list filter allows us to pass the selected filter values to the parameter, but it does not limit the list of available values that we can choose from (e.g. it's a one-way binding). The benefits are evident, despite only list filters currently being supported:
- You can create parameters with a single click
- You no longer have to write logical SQL expressions to initialise possible values for parameters
- You no longer have to write filter expressions to filter visualisations using parameters
Of course, you can still write logical SQL expressions and filter expressions to handle advanced scenarios (e.g. define a parameter with the top/bottom values for a given column, or filter visualisations based on non-connected datasets).
Share Data Flows and Sequences
Data flows and sequences can be shared with other Oracle Analytics users just as datasets, workbook and machine learning models already can.
To share a data flow (or a sequence) right-click on it in the Data page, select the Inspect option, and specify users and roles who can then use it in the Access tab (Figure 2).
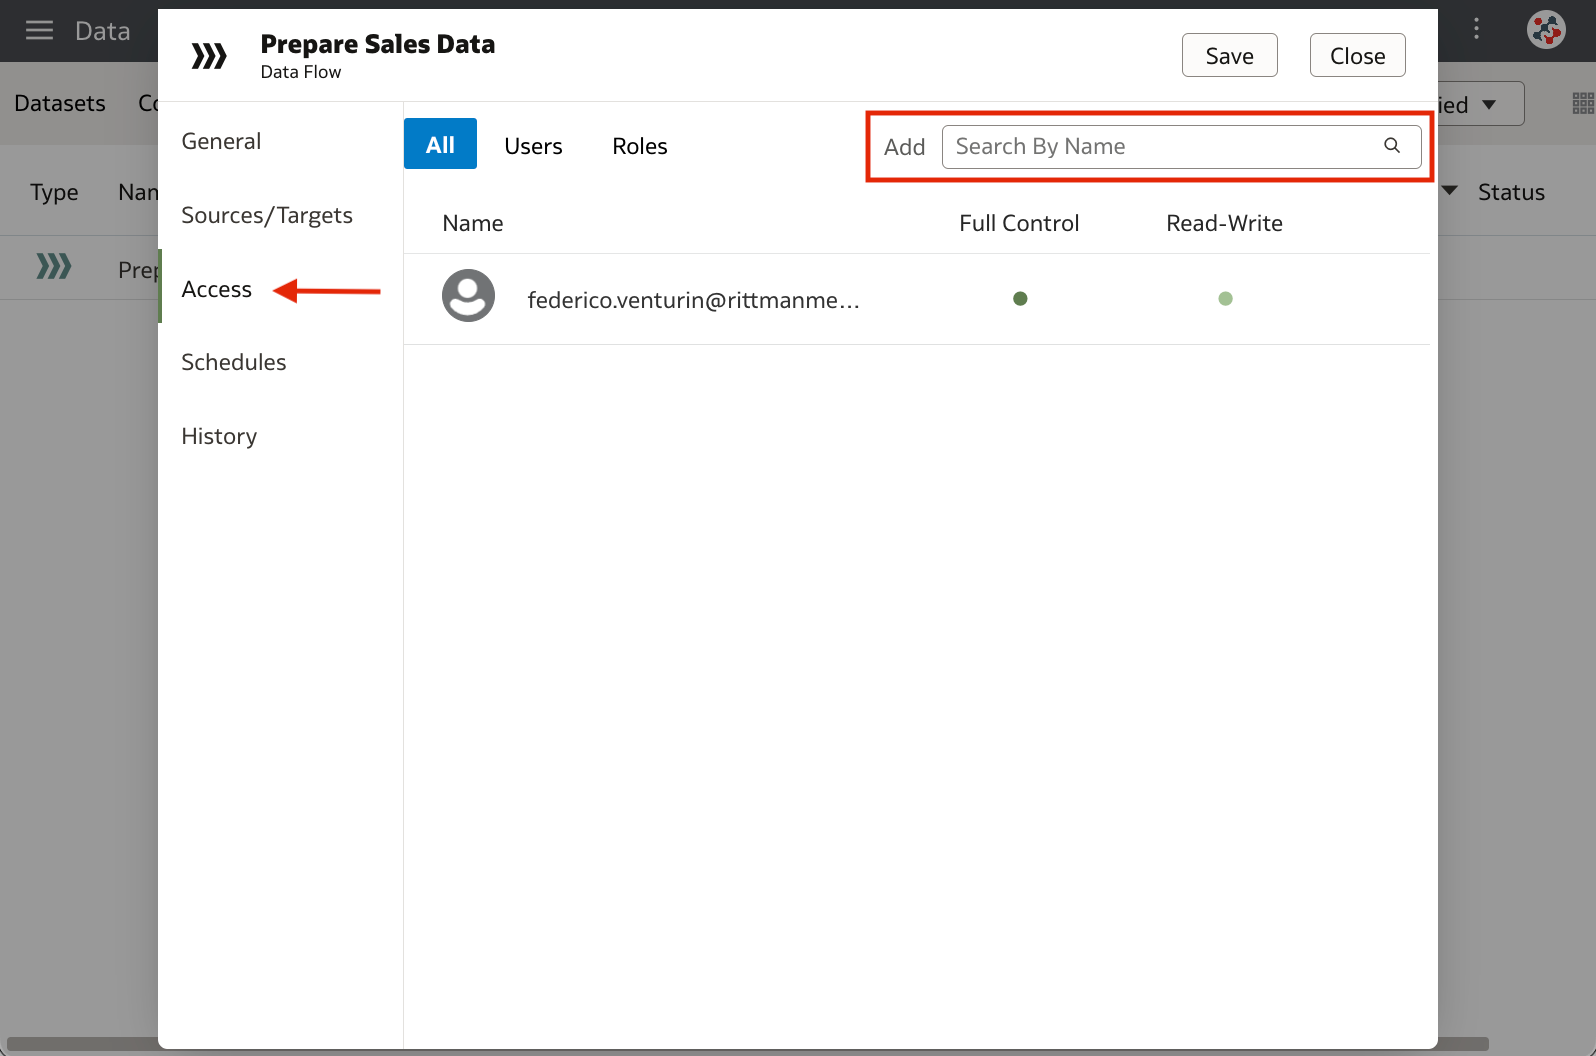
When you share data flows and sequences, Oracle Analytics gives you the option to also share related artefacts to ensure they are usable, similarly to when workbooks are saved for the first time in a shared folder. If you accept to share related artefacts, users that you share with get read-only access to input datasets (and related data connections) and full-control access to output datasets and machine learning models.
Workbook Email Scheduler
Workbook canvases in Shared Folders can be delivered on a schedule to users by email in PDF or PNG format.
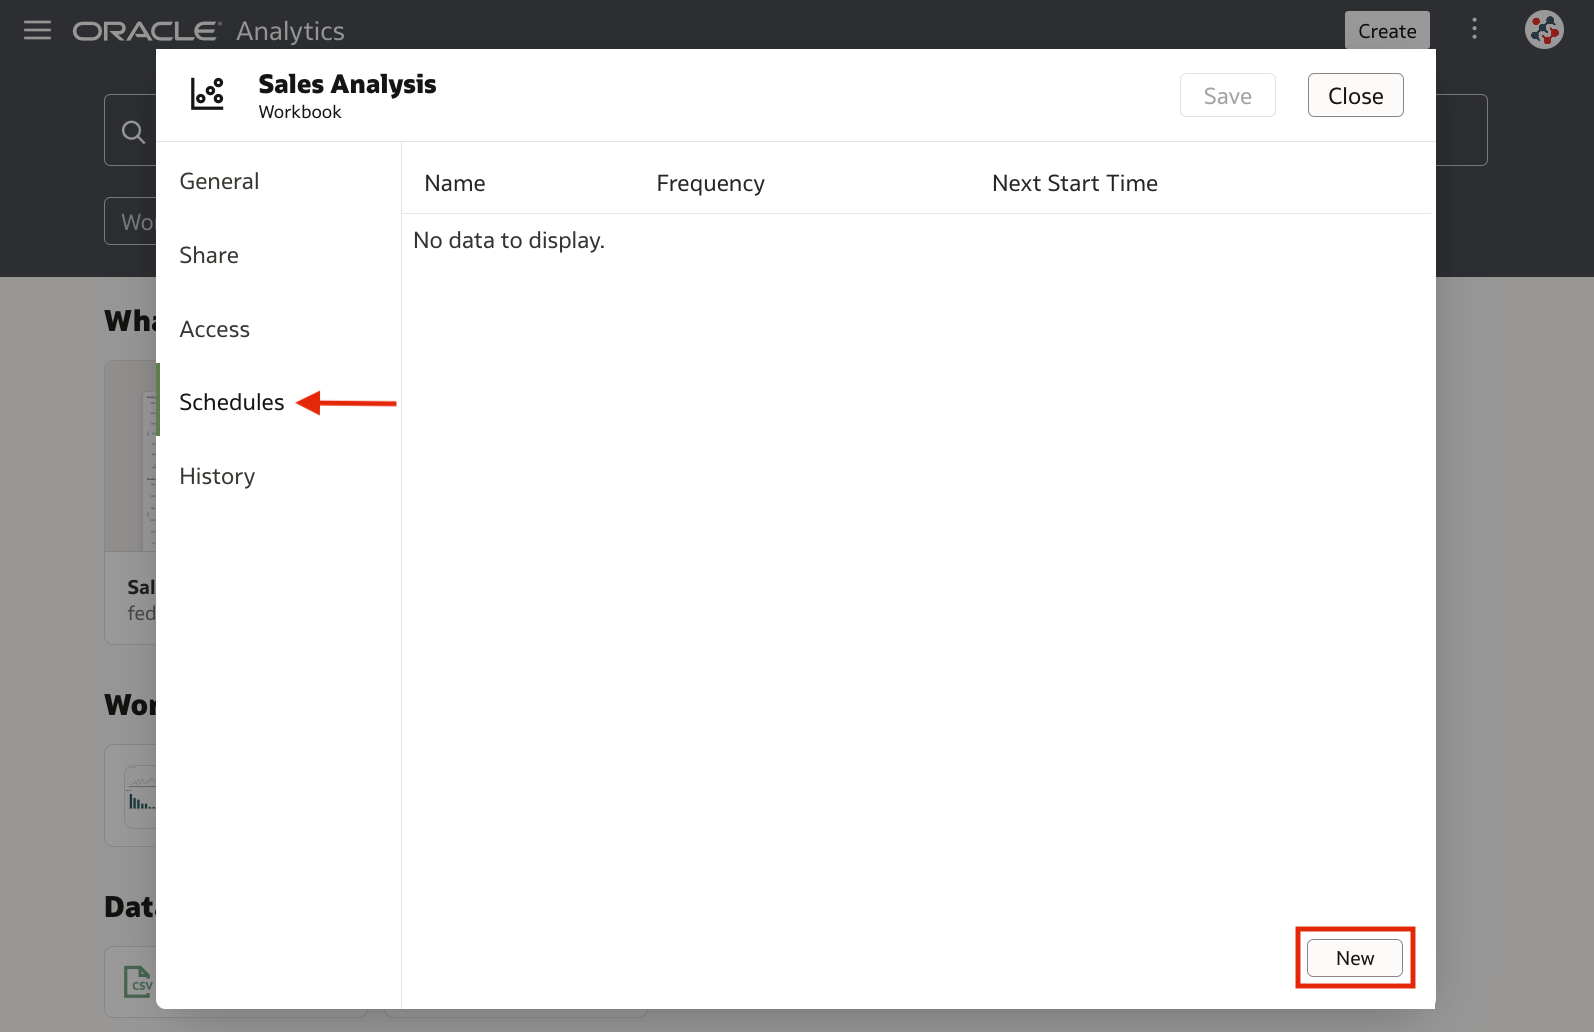
To create a new schedule, right-click on a workbook in the Catalog page, select the Schedule option, and click on the New button in the Schedules tab (Figure 3).
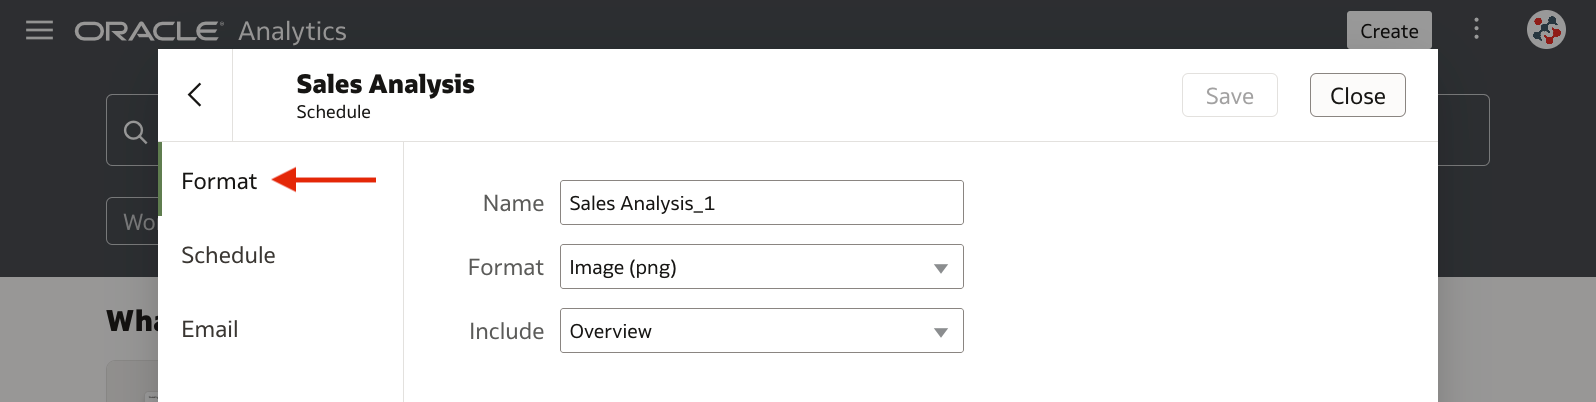
In the Format tab, provide a name for the schedule, select a format and which canvas you want to share (Figure 4).
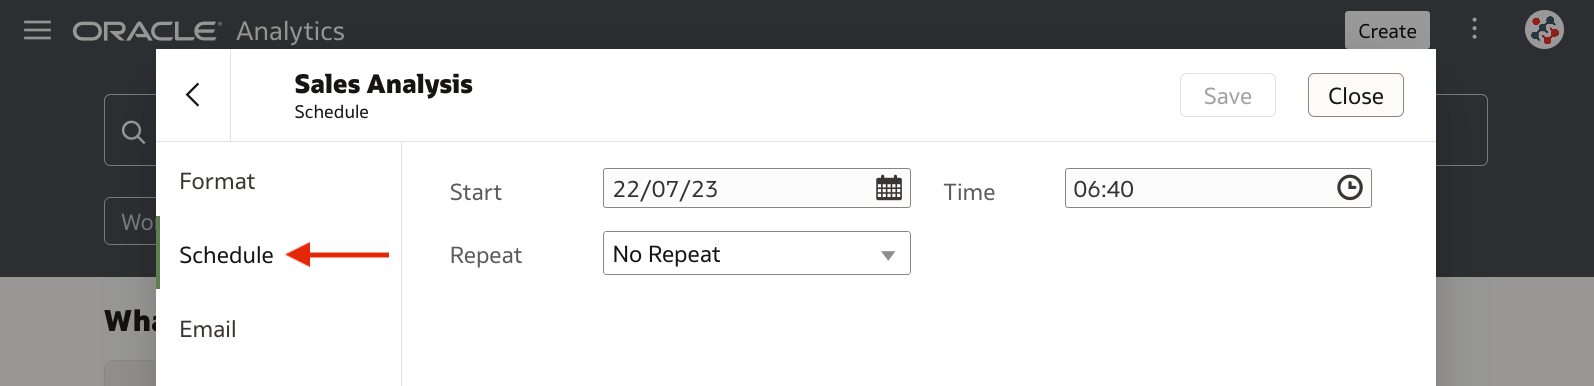
In the Schedule tab, select a start date and time, and use the Repeat field to create a recurring schedule if required (Figure 5).
In the Email tab, enter the recipients, a subject and a message, then click on the Save button (Figure 6). You can add Oracle Analytics users, application roles, and email addresses for external recipients.
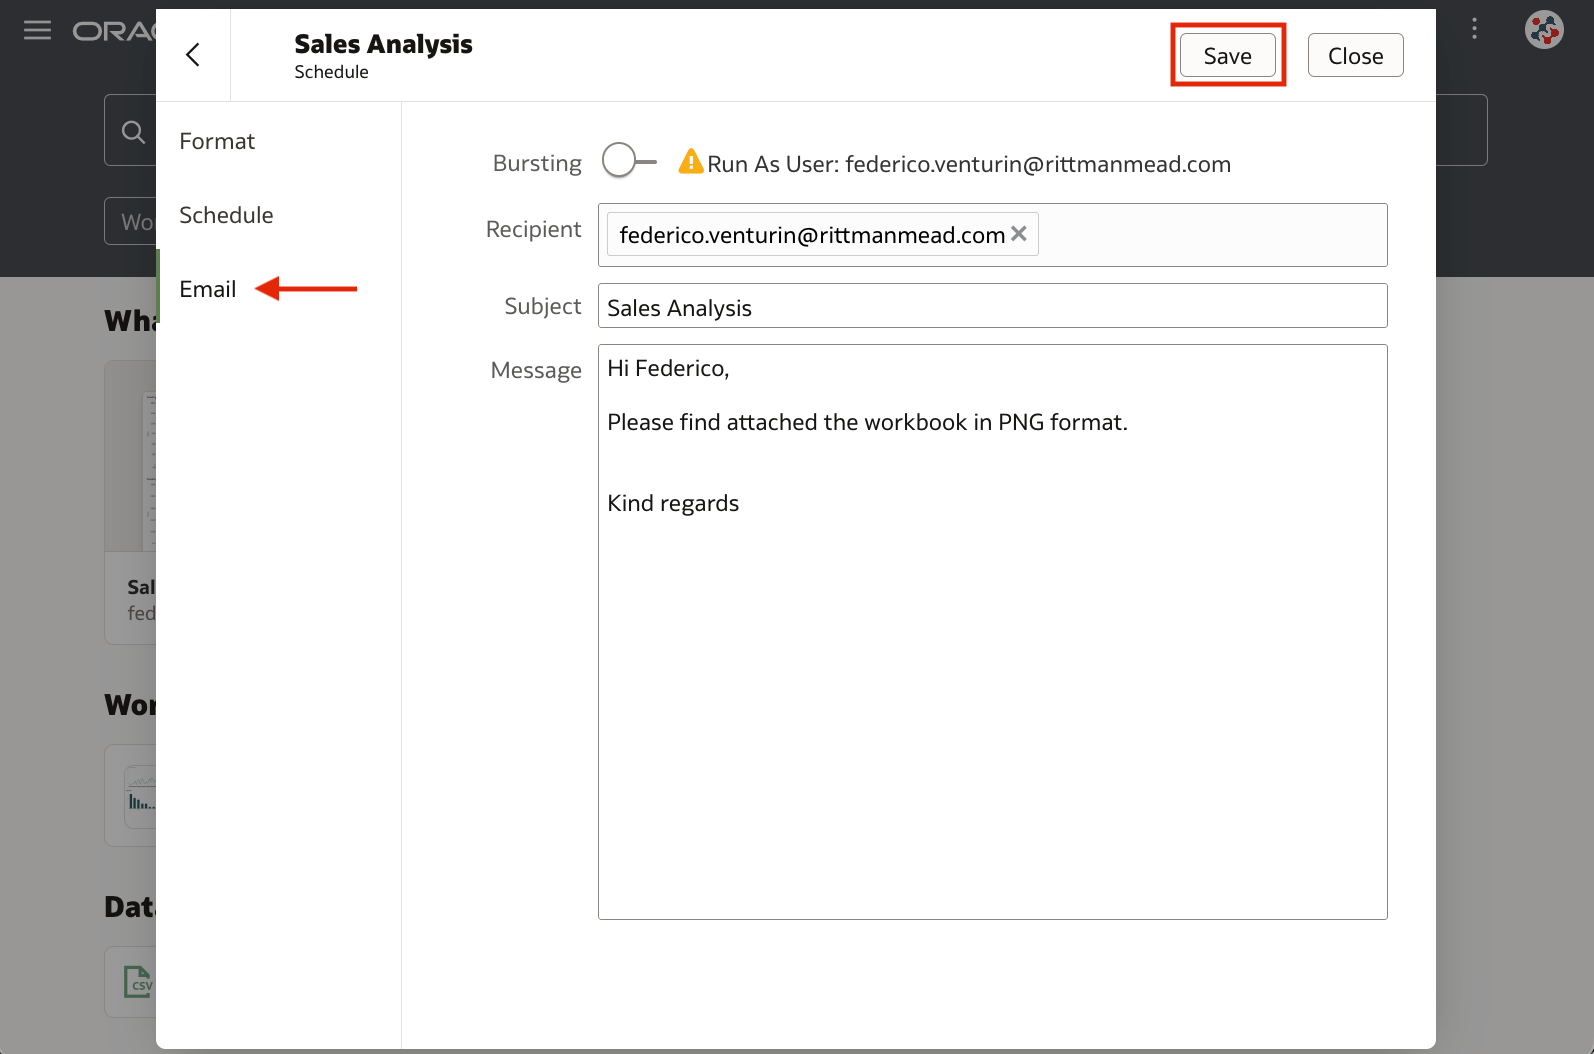
In the Email tab, it's also possible to enable Bursting. It allows recipients to receive a customised workbook's canvas based on their data access configuration, but it doesn't use any bursting definitions as in Publisher: the canvas will be executed once for each recipient.
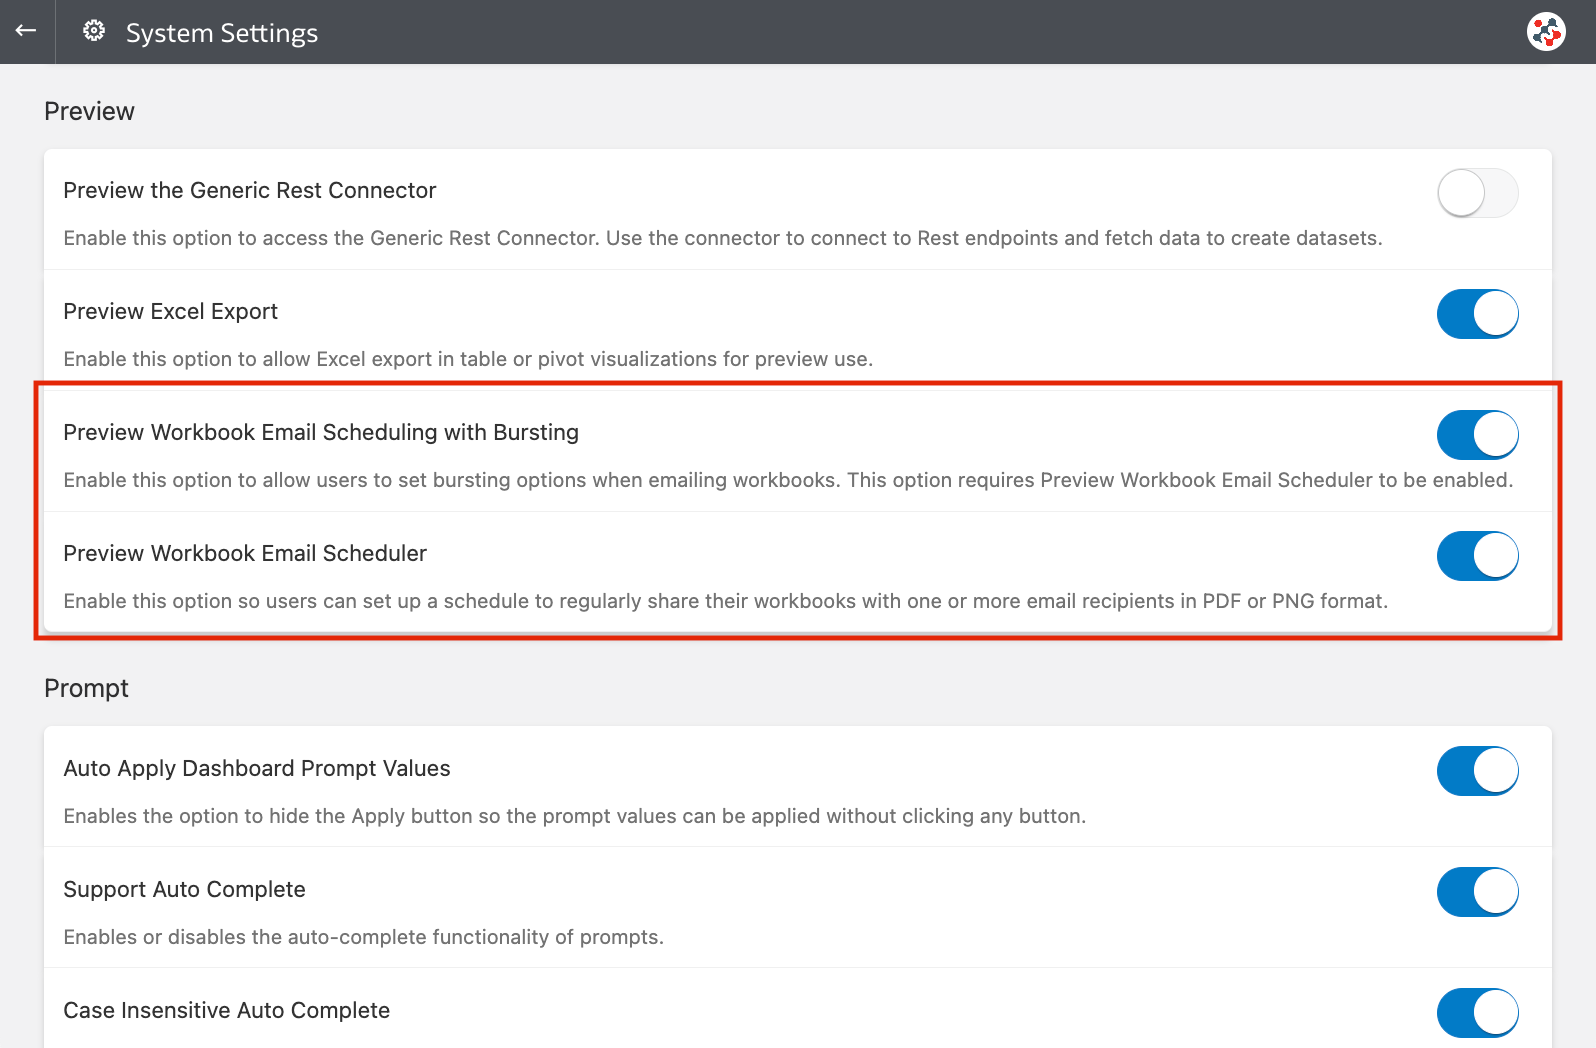
The workbook email scheduler is currently available for preview. Administrators can enable it by switching on the Preview Workbook Email Scheduler and Preview Workbook Emails with Bursting options in the System Settings section of the Console page (Figure 7).
This feature is a great addition to Oracle Analytics, but it's worth noting the following limitations:
- It's not possible to create schedules for workbooks in My Folders
- It's not possible to share multiple canvases with the same schedule
- Custom plugin extensions, filter bar objects, trending lines, and RTL (right-to-left) languages are not supported
- When using bursting, there can be up to 100 recipients. The schedule will fail to send the canvas to any recipient after the 100th one
Enhanced Visualisation Filters
The labels of visualisation filters can now be customised to match your business requirements.
Select a visualisation in a workbook, click on the Properties icon in the Grammar Panel, select the Filters tab, set the Label field to Custom, and enter your custom label (Figure 8).
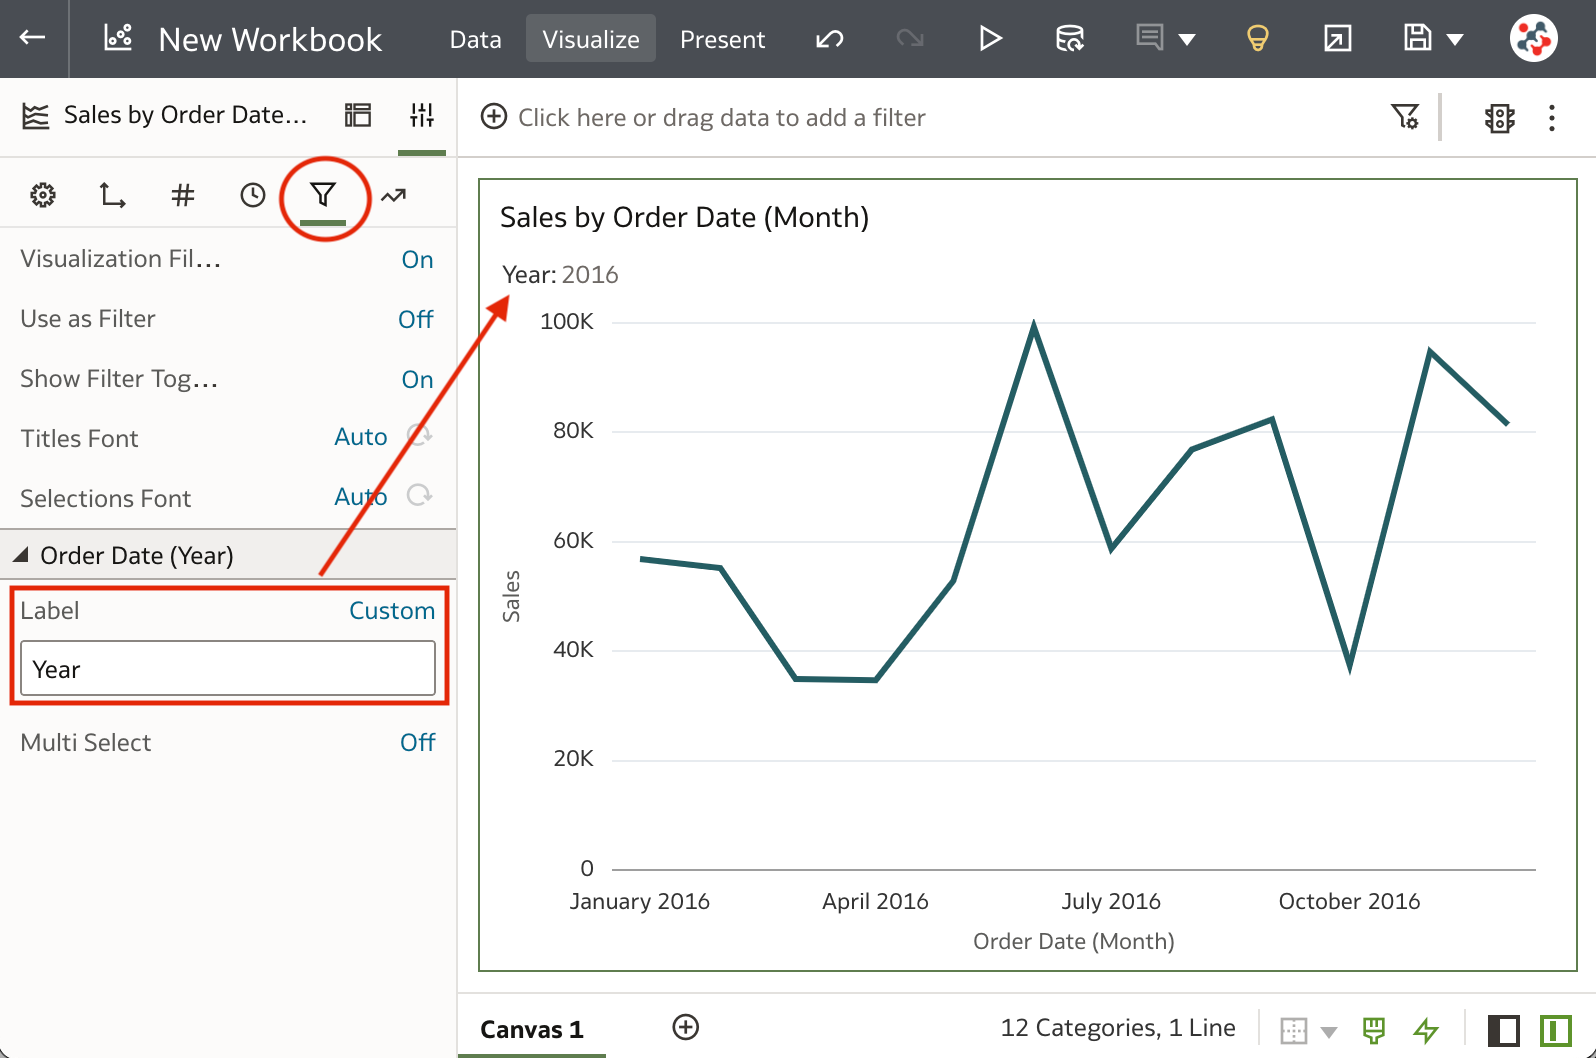
In the Filters tab, it's also possible to control whether the visualisation filter accepts single or multiple selections by setting the value of the Multi Select field. I find these enhancements very useful, and I'm looking forward to being able to use them with all objects in the Filter Bar as well in a future release.
Enhanced Tile Visualisations
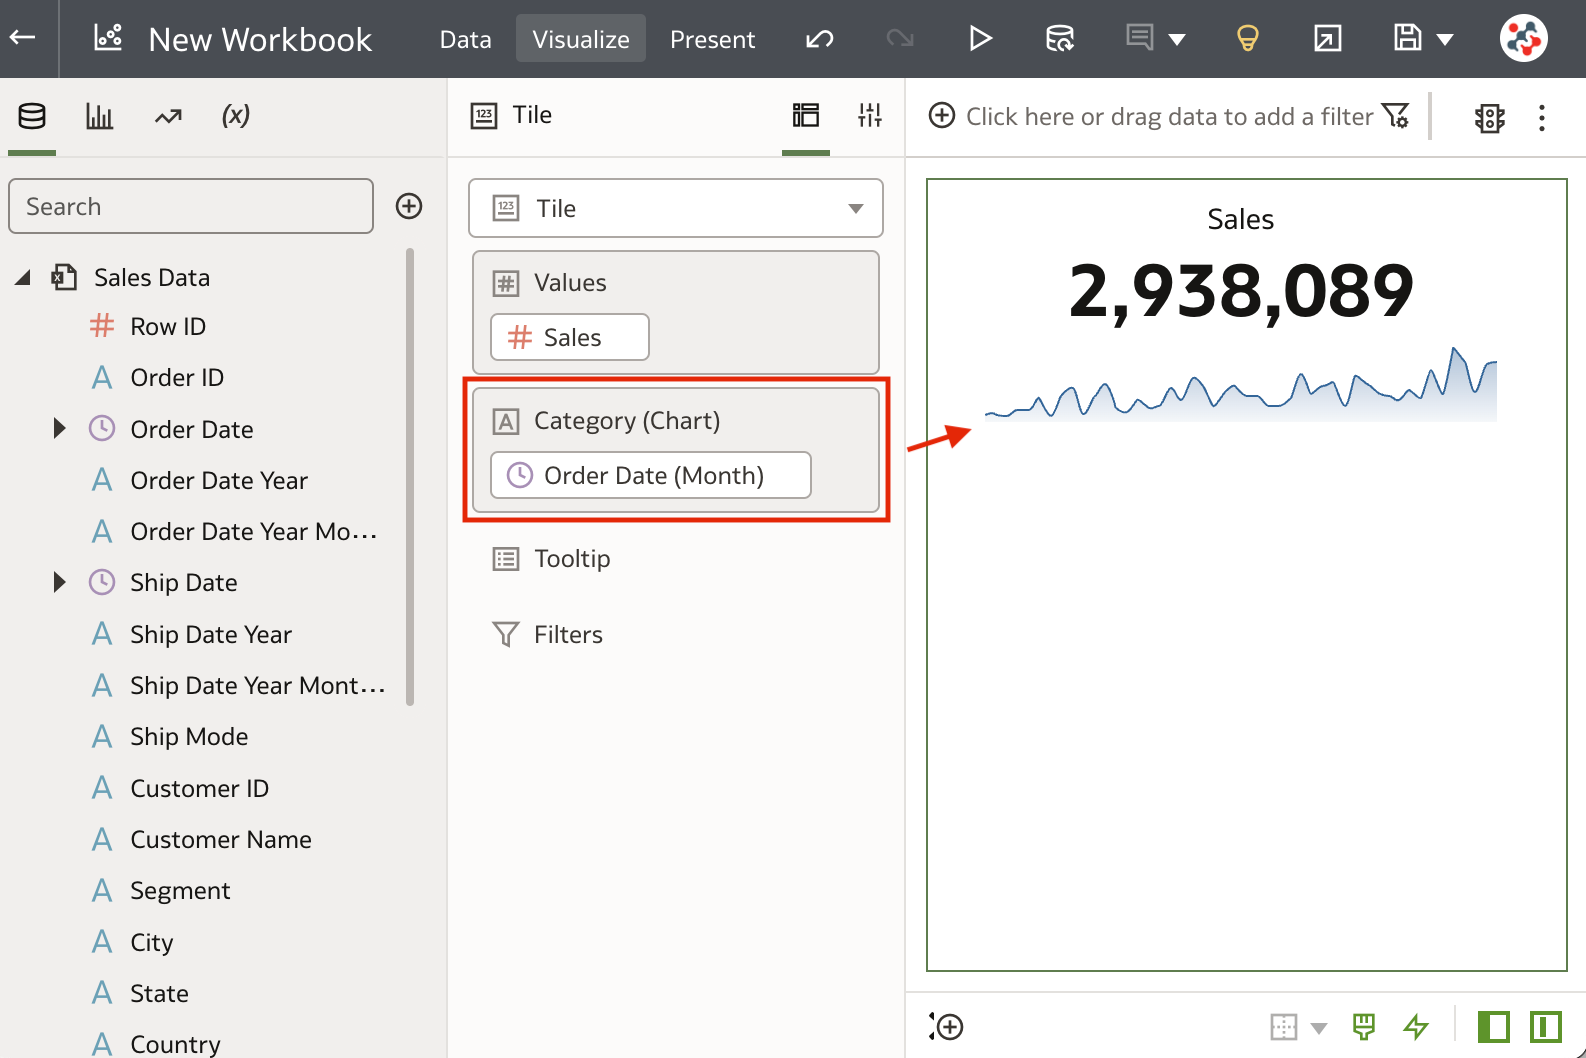
Spark charts can be added to tile visualisations to view aggregate data over a given attribute column such as trends over time.
To add a spark chart, select your tile visualisation and drag an attribute column to the Category (Chart) drop target (Figure 9).
The General tab in the Properties pane allows us to change spark chart display settings including chart type, color and position (Figure 10).
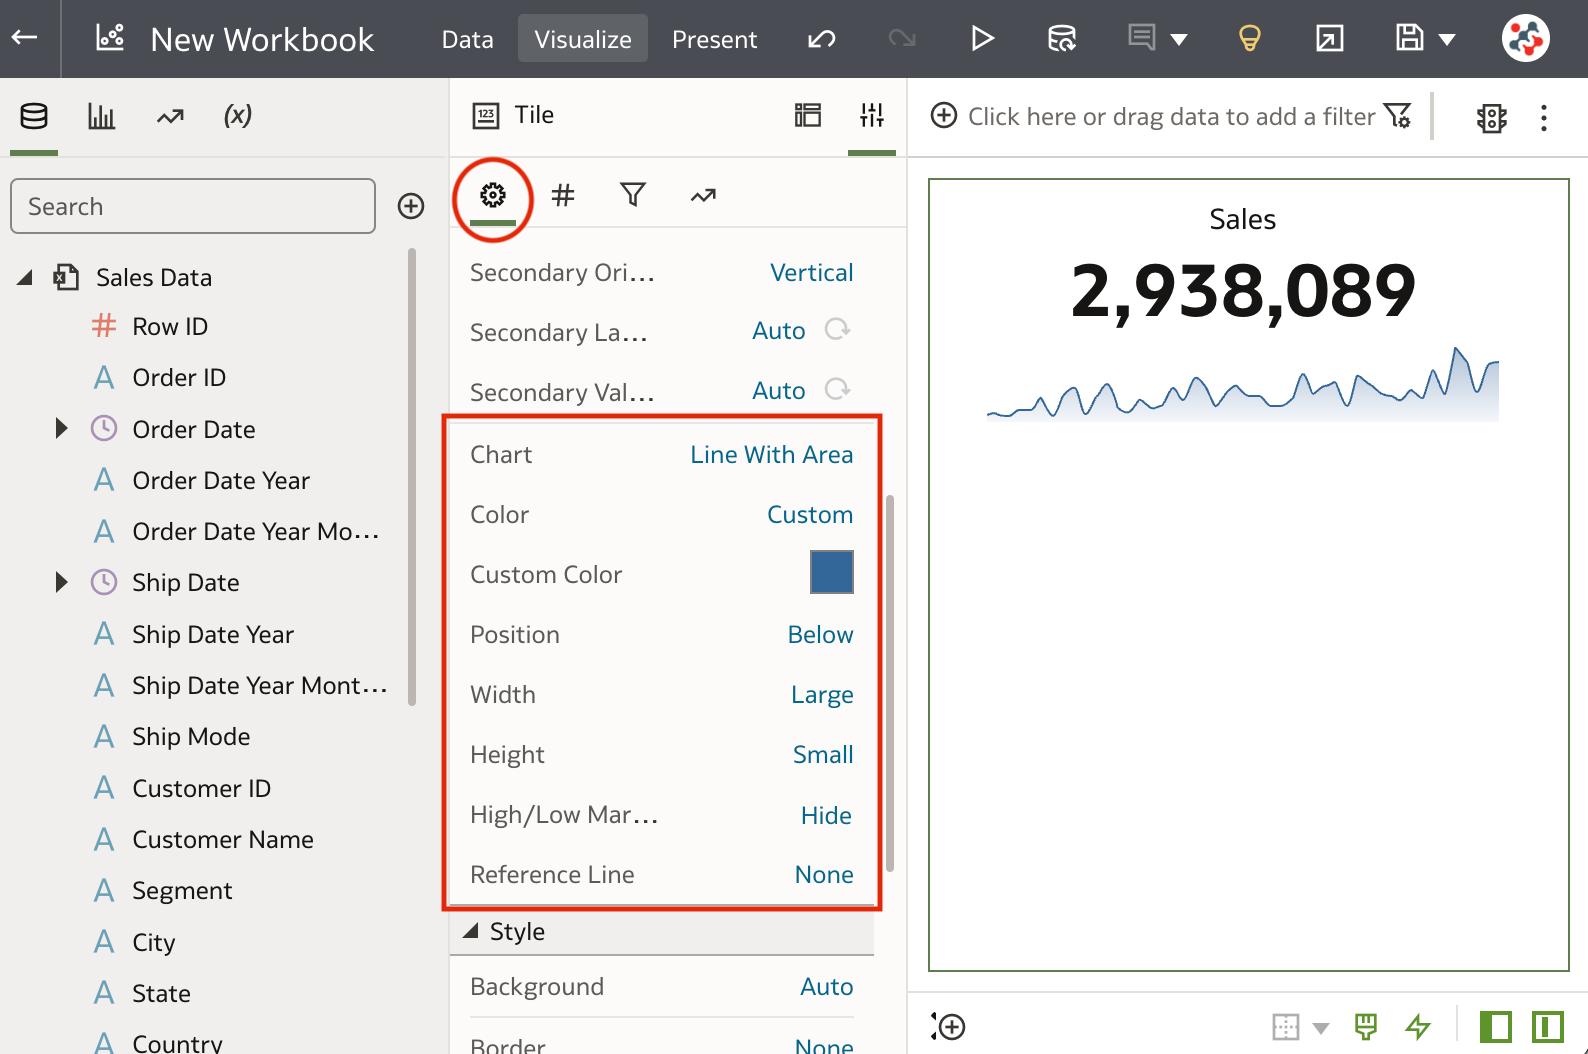
When hovering on the spark chart a tooltip showing the first, last, lowest, highest and average aggregate values appears. Unfortunately, it does not provide additional context such as the particular attribute and aggregate value that you are hovering over.
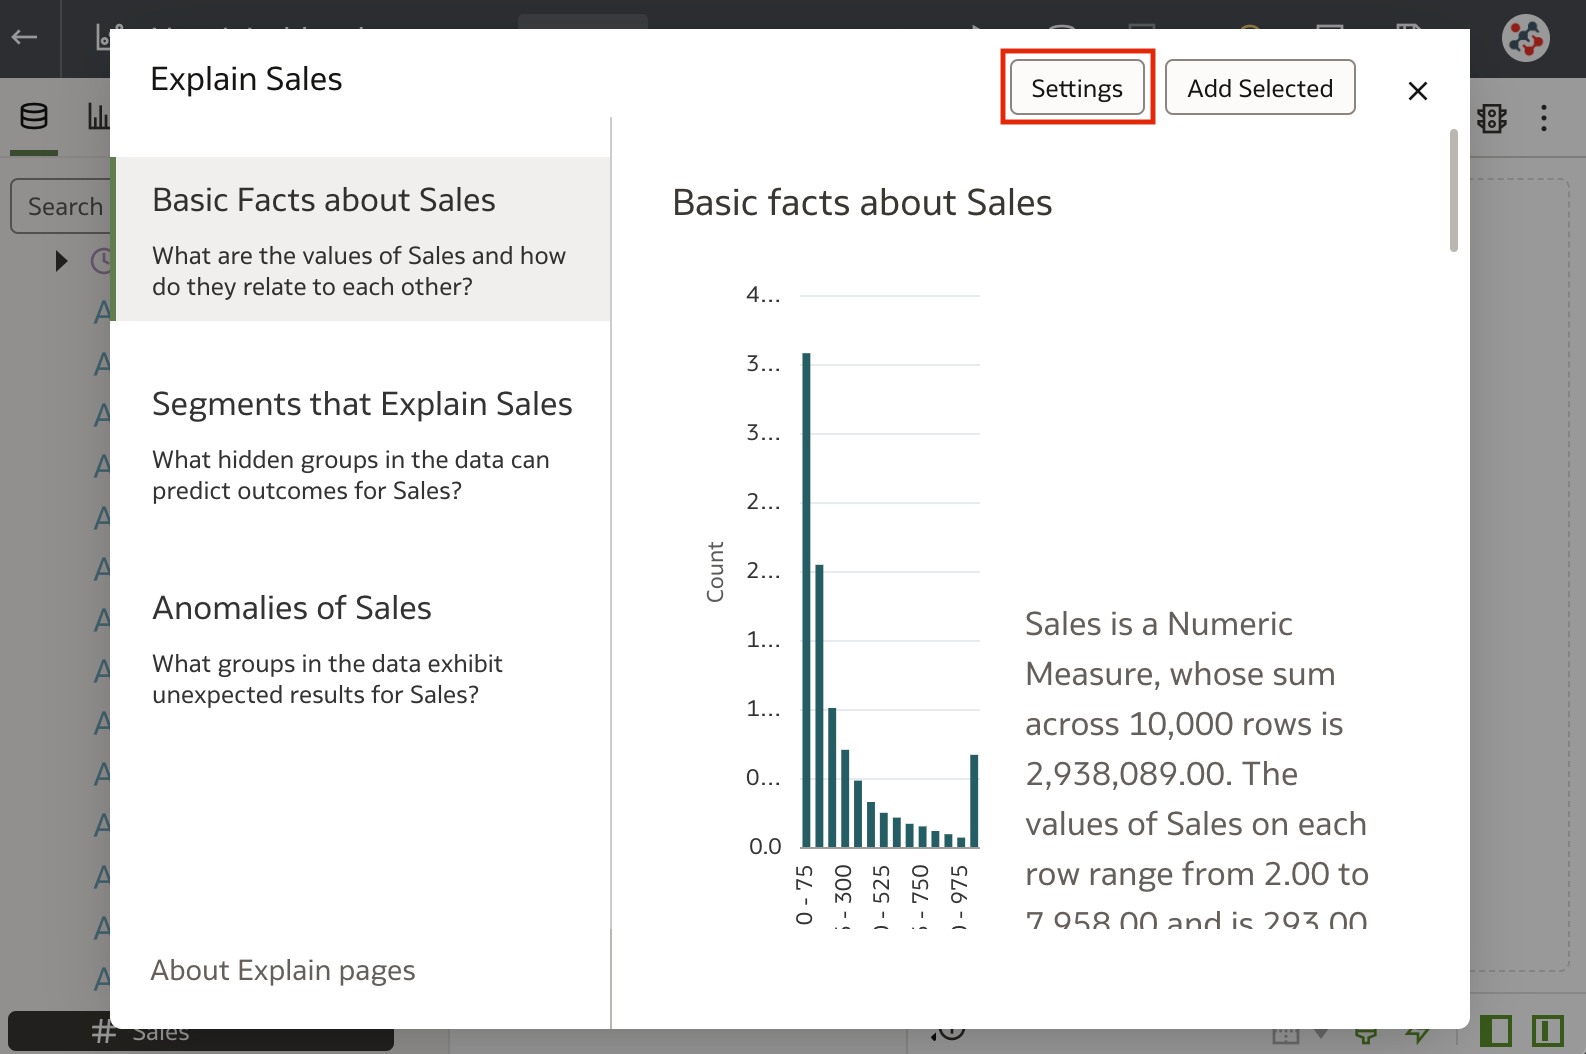
Enhanced Explain
A Settings Pane is now available on all tabs in Explain to fine-tune the insights suggested for you. To display the Settings Pane is sufficient to click on the Settings button in the Explain dialogue (Figure 11).
Display or Hide the Visualisation Toolbar
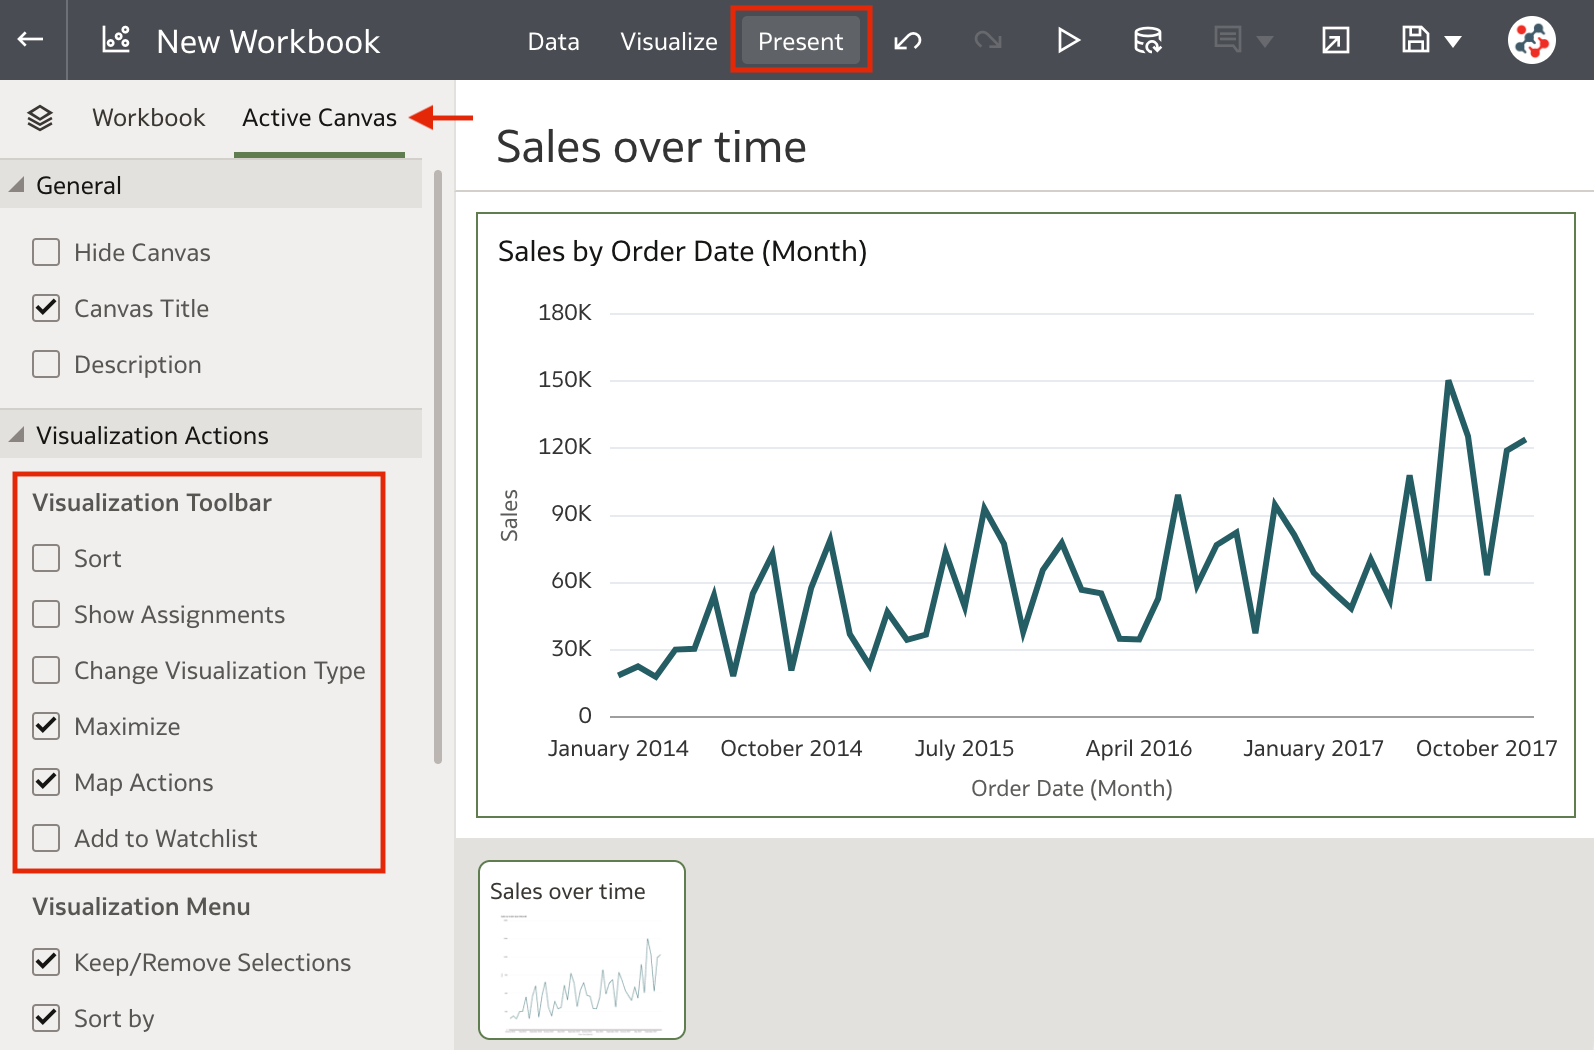
When a canvas is added to the presentation flow, only the Maximise and Map Actions options are enabled by default in the visualisation toolbar.
To control which options are enabled, select the Active Canvas tab in the Present panel, scroll to the Visualisation Toolbar section, and tick the options that you want users to be able to use (Figure 12).
Enhanced Search with Synonyms
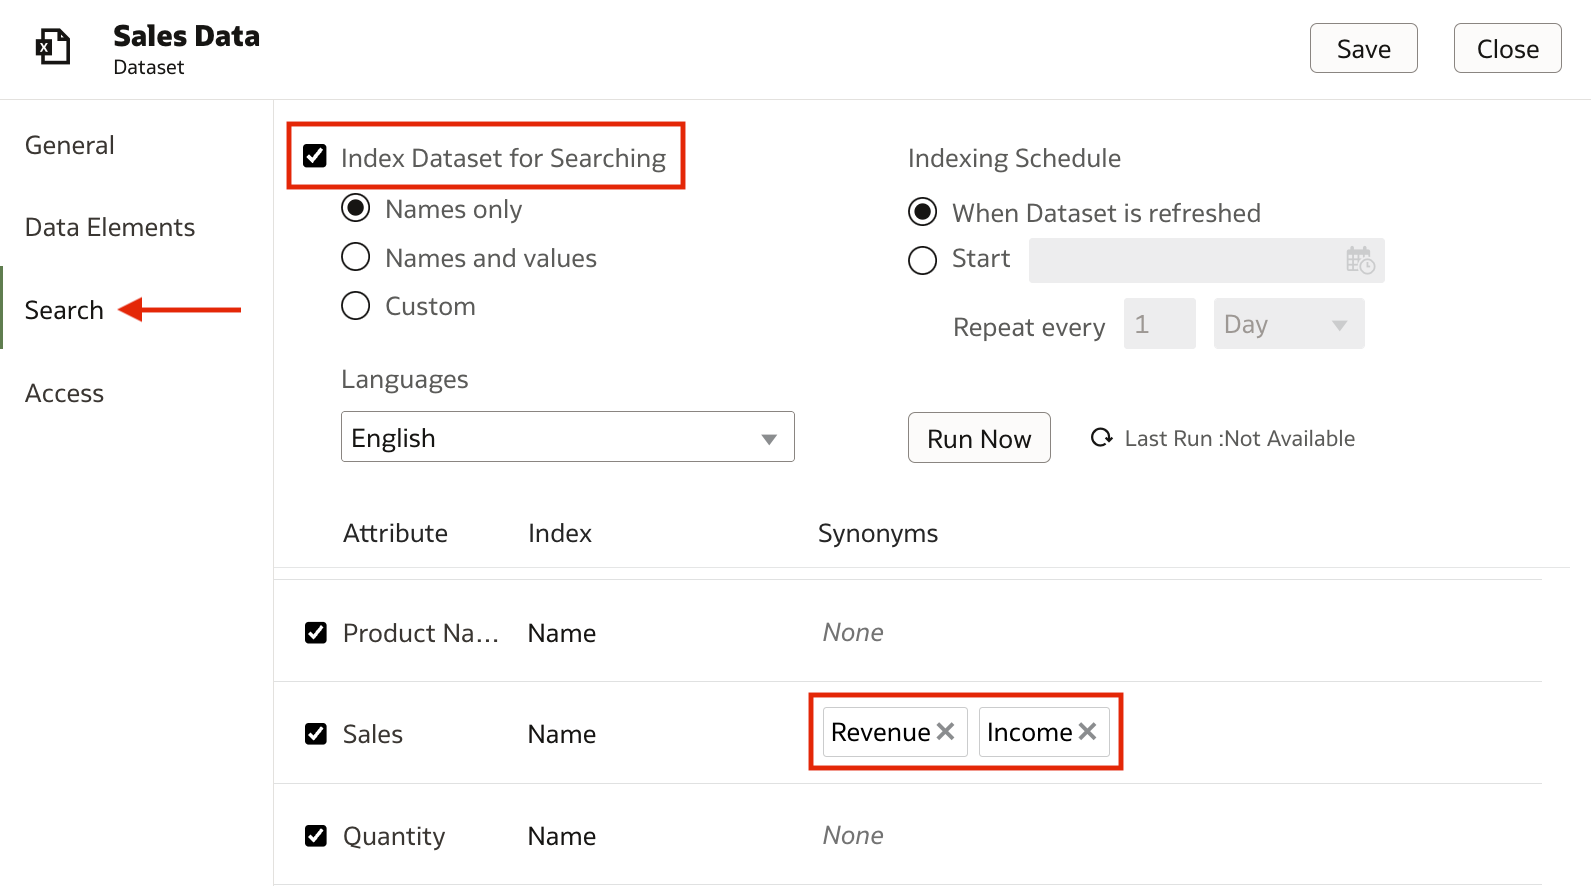
Content authors can specify synonyms for dataset columns to help users search for content from the Home page.
To specify a synonym, right-click on a dataset, select the Inspect option, select the Search tab, make sure that the Index Dataset for Searching checkbox is ticked, and enter synonyms in the Synonyms field next to the column you want to update (Figure 13).
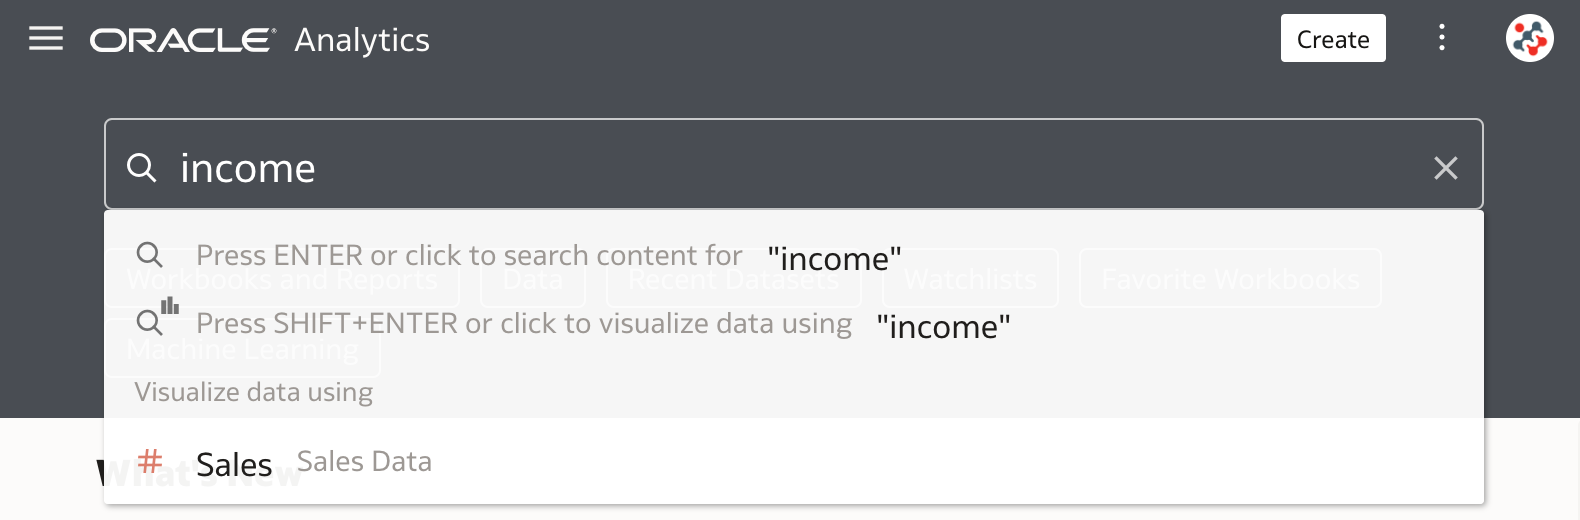
Synonyms can then be used to search for content and generate visualisations on the fly in the Home page (Figure 14).
Other Features
The July 2023 Update also allows users to:
- Connect to Oracle Analytics Views instances
- Specify permissions to share semantic models
- Use OAuth2 authentication for connection to REST endpoints
- Create data actions that use the PATCH method
- Use Snowflake and Vertica databases as data sources for pixel-perfect reports
- Deliver pixel-perfect reports through SFTP using the RFC8332 RSA keys (SHA-256 or SHA-512)
- Generate analyses, dashboards, and pixel-perfect reports as a PDF file using the Go Noto font as a fallback font
Conclusion
The July 2023 Update includes several new features, enhancements and fixes for Oracle Analytics Cloud that significantly improve the suite.
If you are looking into Oracle Analytics Cloud and want to find out more, please do get in touch or DM us on Twitter @rittmanmead. Rittman Mead can help you with a product demo, training and assistance with the migration process.