Oracle Analytics Cloud September 2023 Update: What's New?

The September 2023 Update for Oracle Analytics Cloud came out a few weeks ago and in this article, I'm going to have a look at the features it includes. If you are also interested in a comprehensive list of the defects fixed by the update, please refer to Doc ID 2919336.1.

Before diving into the exciting world of the September 2023 Update, I want to clarify that the breathtaking Albanian beach you see above has absolutely nothing to do with the update itself. Truth be told, I couldn't resist sharing this holiday memory, and that's why this post might seem fashionably late – blame it on the beautiful beaches!
Enhanced OCPU Scalability
The September 2023 Update revamps the way users can scale up or down Oracle Analytics Cloud instances with the introduction of a new 1 - 8 OCPU range.
This range provides users unprecedented flexibility, allowing you to scale up and down between 1, 2, 4, 6, and 8 OCPUs. You can begin with as little as 1 OCPU and easily scale up as needed, eliminating the need for new instance creation and content migration. In practical terms, this means you can efficiently adapt your instance to changing demands, all while optimising costs and maintaining operational simplicity!
Please refer to Scale a Service for more details about scaling.
Enhanced Present Experience
The Present page allows you to define a presentation flow from the workbook's canvases, which determines the workbook the end user interacts with. The first time you open the Present page, it displays a default presentation flow which is identical to the workbook you designed in the Visualise page and contains all of the workbook's canvases, visualisations, filters, and so on.
Auto (enabled by default) and manual modes determine the types of changes that you can make while designing the presentation flow. To switch between auto and manual modes in a workbook, open the Present page, and click on the mode icon at the bottom of the page (Figure 1).
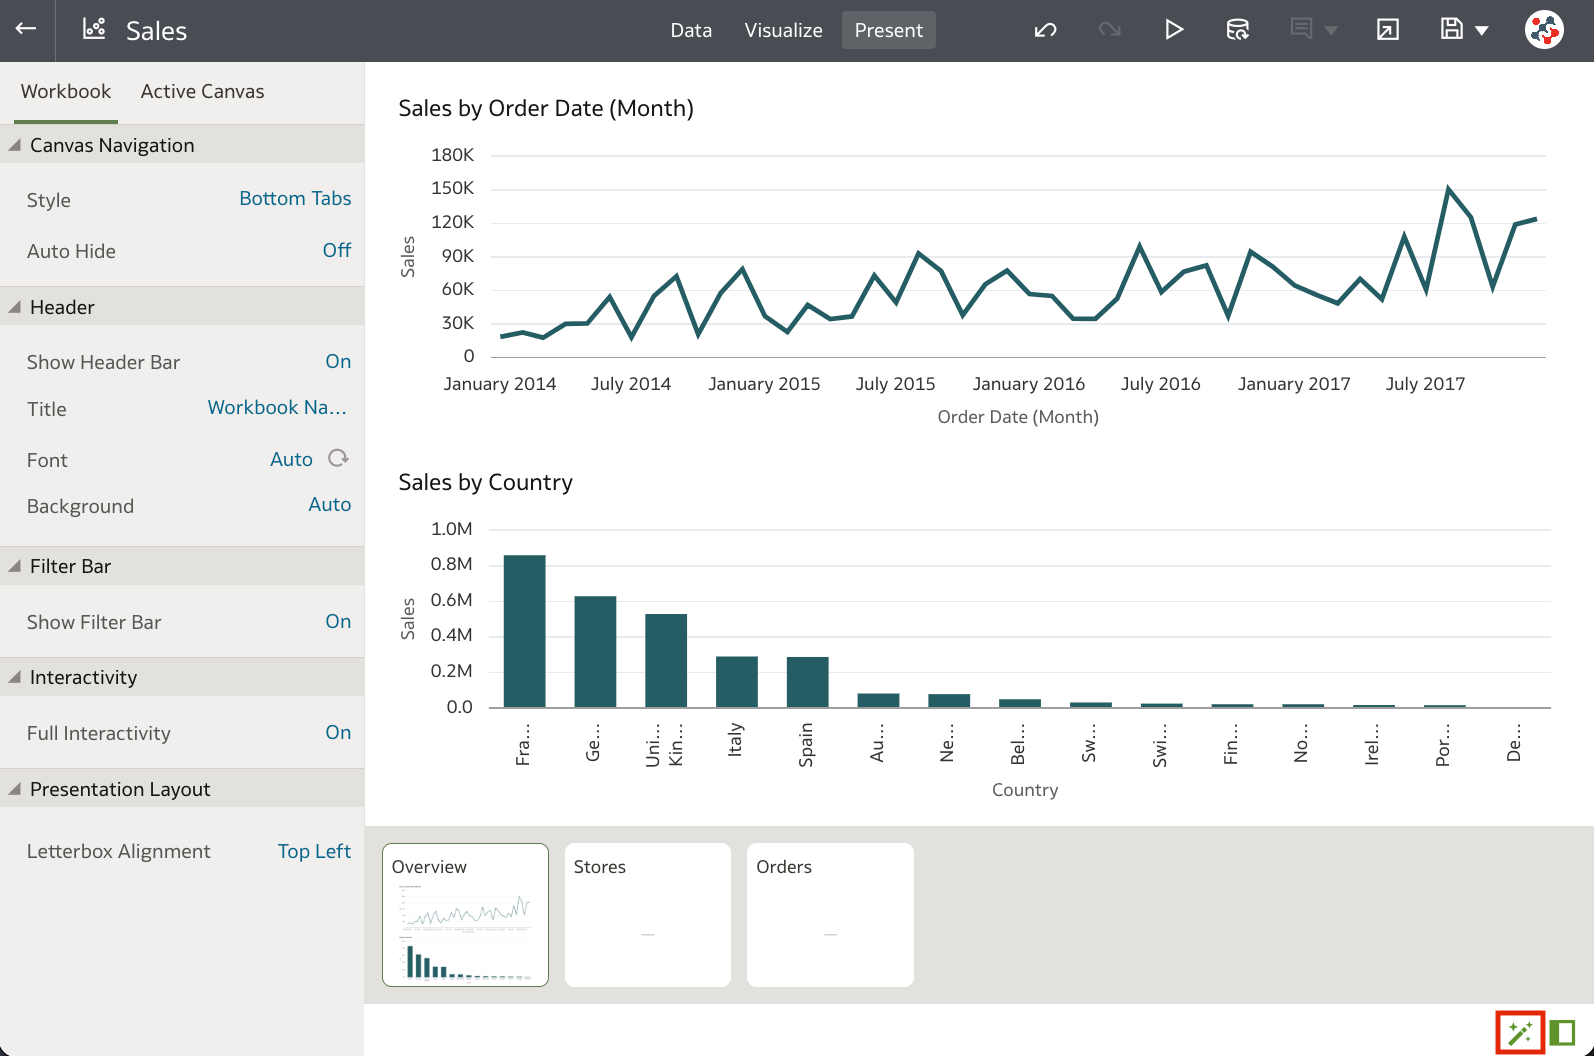
In auto mode, the content and order of canvases in the presentation flow is always kept in sync with the Visualise page. You can choose to hide a canvas and change many presentation flow properties at the workbook or canvas level. Manual mode provides further options such as renaming, duplicating, hiding and changing the position of a canvas, choosing to display a new canvas added in the Visualise page, and hiding a visualisation on a canvas.
Switching from manual to auto mode resets any of the manual changes listed above, but preserves all other workbook or canvas-level properties that you set.
This is a significant change compared to previous releases, where the presentation flow was empty the first time you accessed the Present page, and only the manual mode was available. I still find that having only a presentation flow per workbook is a bit limiting, and authors should be allowed to define different flows for different users without creating multiple copies of the same workbook: let's hope to find this soon in a future release!
Enhanced Parameters Experience
Parameters are the best feature introduced in 2023, and the September 2023 Update revolutionises their management, making it easier and less error-prone for users.
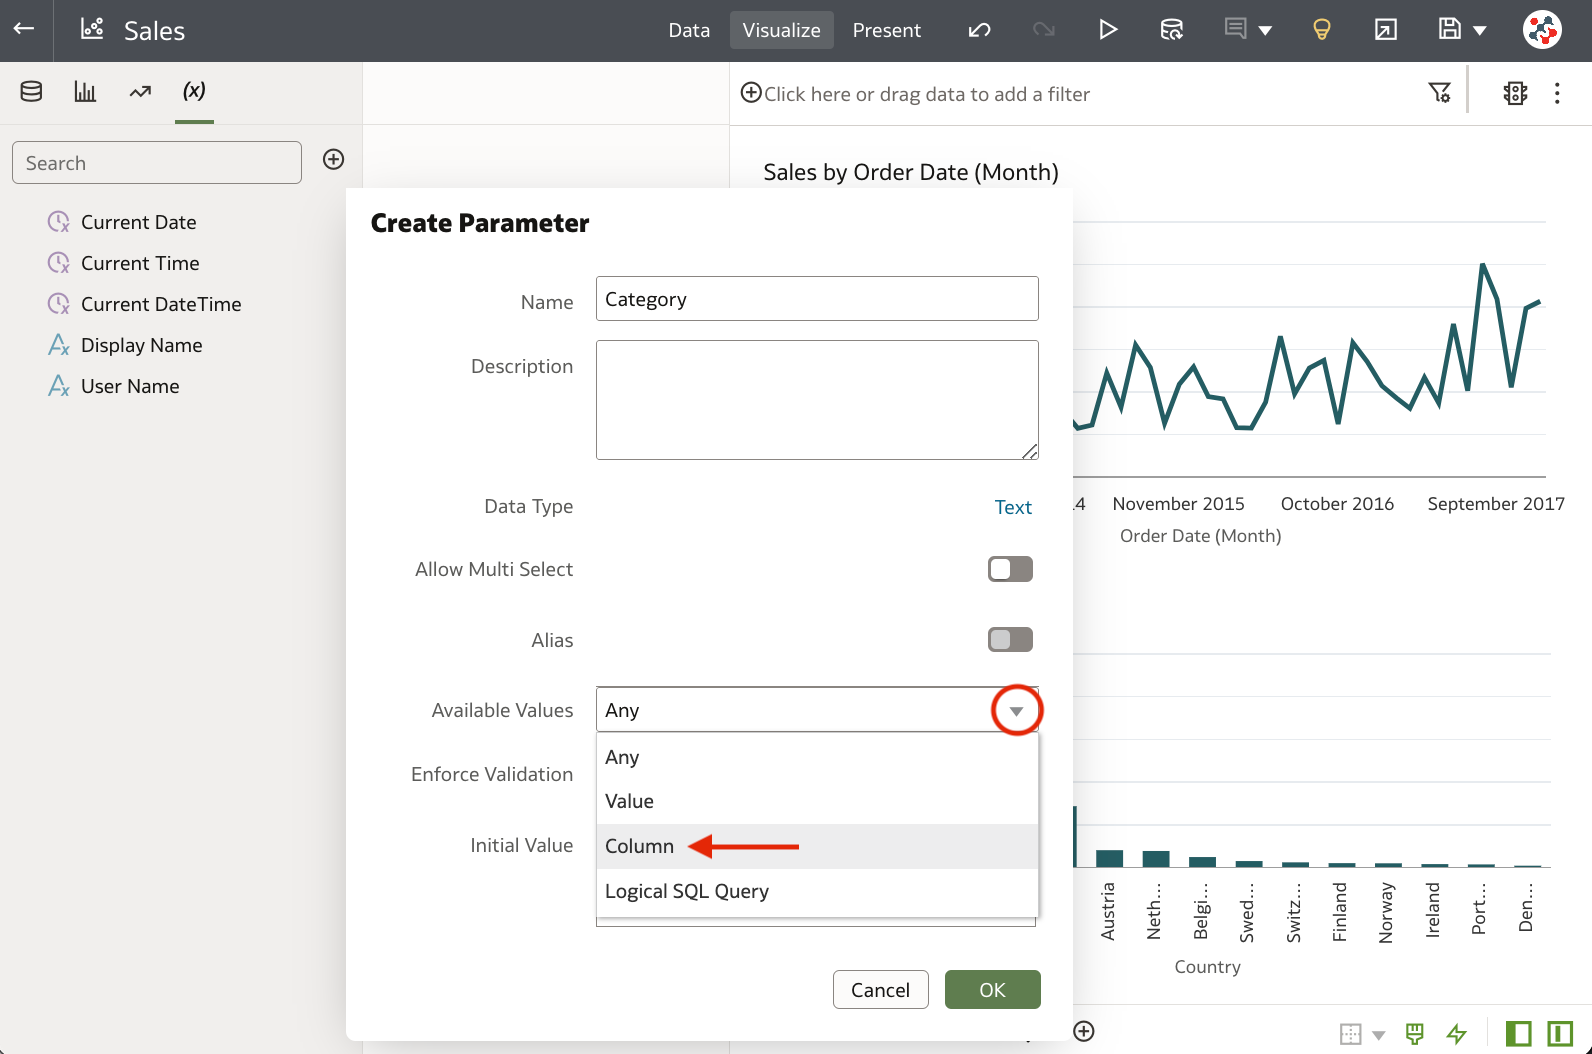
The standout news is the ability to choose a data column to populate a parameter available values (Figure 2). This is a game-changer in simplifying the parameter creation process since you no longer need to manually craft logical SQL queries to define parameter values!
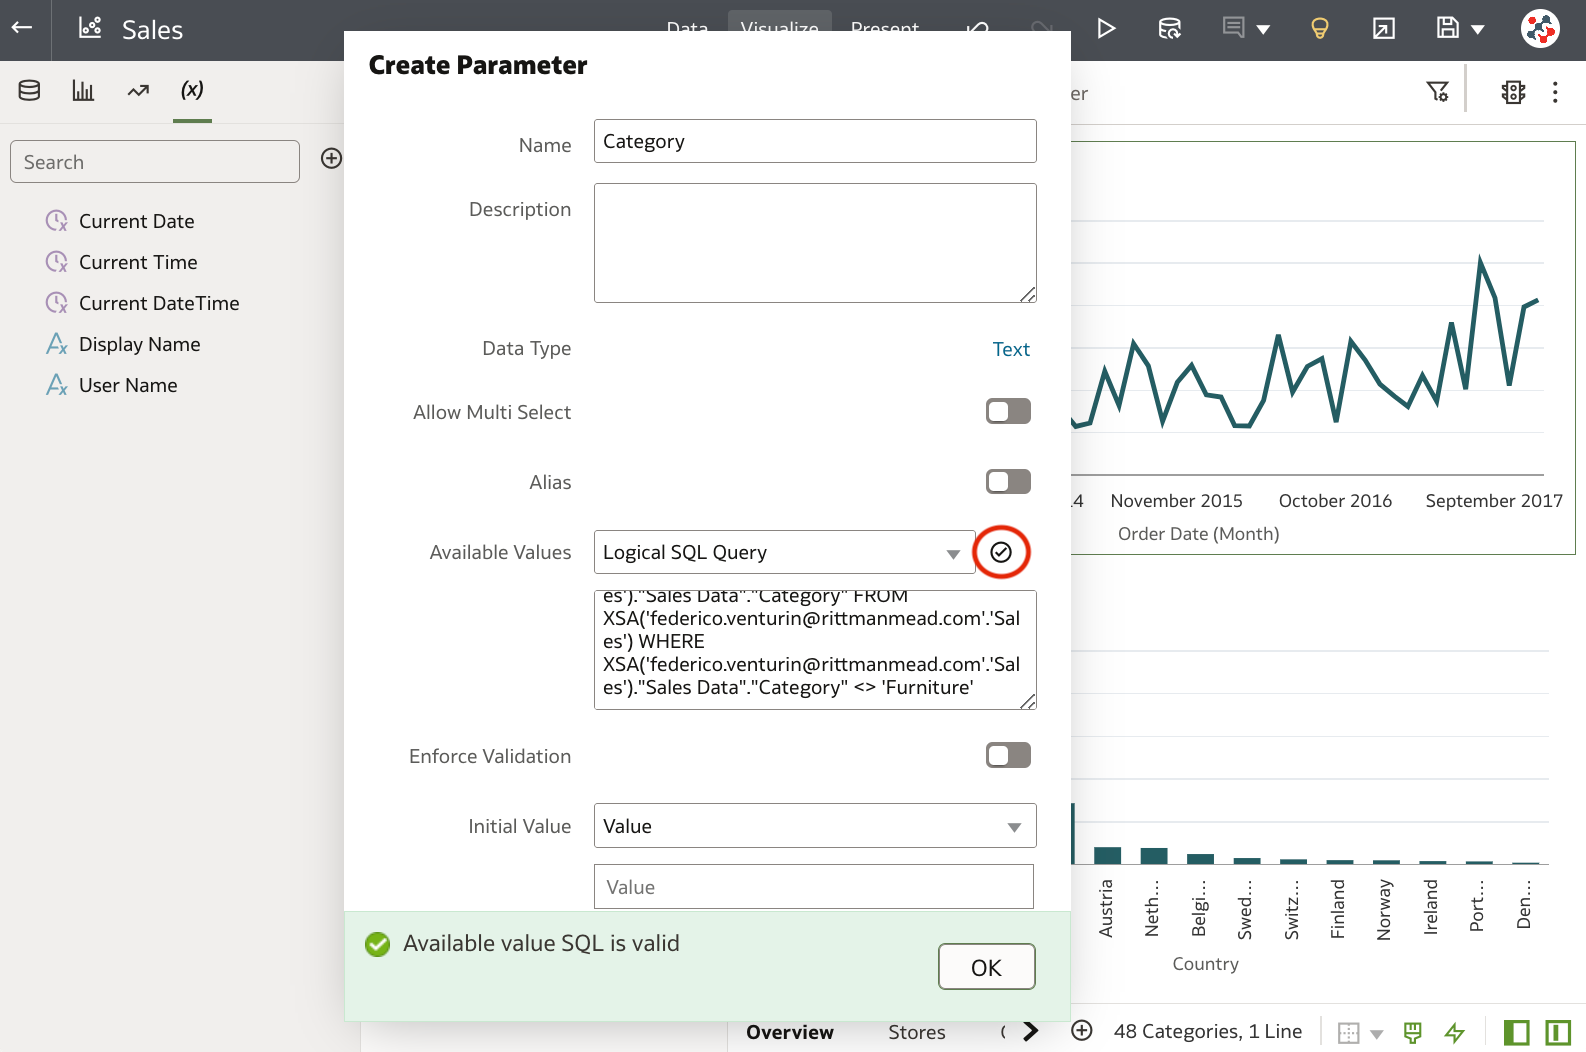
Don't worry if you're accustomed to using logical SQL queries; they are still available as an option to populate parameter initial and available values. But here's the exciting part: a new validation feature has been introduced to check your statements for errors before executing them (Figure 3). I'm sure that this proactive approach will save workbook authors valuable time and effort! You can also validate parameter initial and available values entered directly, but be mindful that this could impact performance.
It's also possible to access a canvas and filter it by passing parameter values directly on the URL, similar to the Go URL functionality in Classic.
Let's suppose that this is the base URL to access my Sales canvas:
https://fventurin-lrxvndpuefpq-ld.analytics.ocp.oraclecloud.com/ui/dv/ui/project.jsp?pageid=visualAnalyzer&reportmode=full&reportpath=%2F%40Catalog%2Fshared%2FFederico%2FSalesOn my canvas, I have some filters on Category and Country columns bound to parameters called pCategory and pCountry. If I want to display data about the Technology category in Italy and the United Kingdom, then I have to append the following attributes to the URL:
&p1n=pCategory&p1v=Technology&p2n=pCountry&p2v=Italy%2CUnited%20KingdomWhere p<number>n specifies the parameter's name as defined in the workbook, p<number>v specifies the parameter value(s) that you want to pass, commas are encoded as %2C and spaces as %20.
Another noteworthy addition is the ability to pass parameter values to Oracle Analytics content embedded in applications through the <oracle-dv> embedding tag:
<oracle-dv project-path="{{projectPath}}" active-page="canvas" active-tab-id="1" parameters="{{parameters}}"
project-options='{"bDisableMobileLayout":false, "bShowFilterBar":false}'>
</oracle-dv>

<script>
requirejs(['knockout', 'ojs/ojcore', 'ojs/ojknockout', 'ojs/ojcomposite', 'jet-composites/oracle-dv/loader'], function(ko) {

   function MyProject() {
      var self = this;
      self.projectPath = ko.observable("/users/weblogic/EmbeddingStory");
      self.parameters = ko.observable({
         "p1n": "pCategory",
         "p1v": "Technology"
         "p2n": "pCountry",
         "p2v": ["Italy", "United Kingdom"]
      });
    }
    ko.applyBindings(MyProject);
});
</script>
I recommend enabling Developer Options to easily find the <script> tag, HTML, and column expression that you need to embed content into applications and web pages.
Enhanced Filters Experience
The usability of filters in workbooks has been enhanced, empowering users to make more informed data selections while simplifying error resolution.
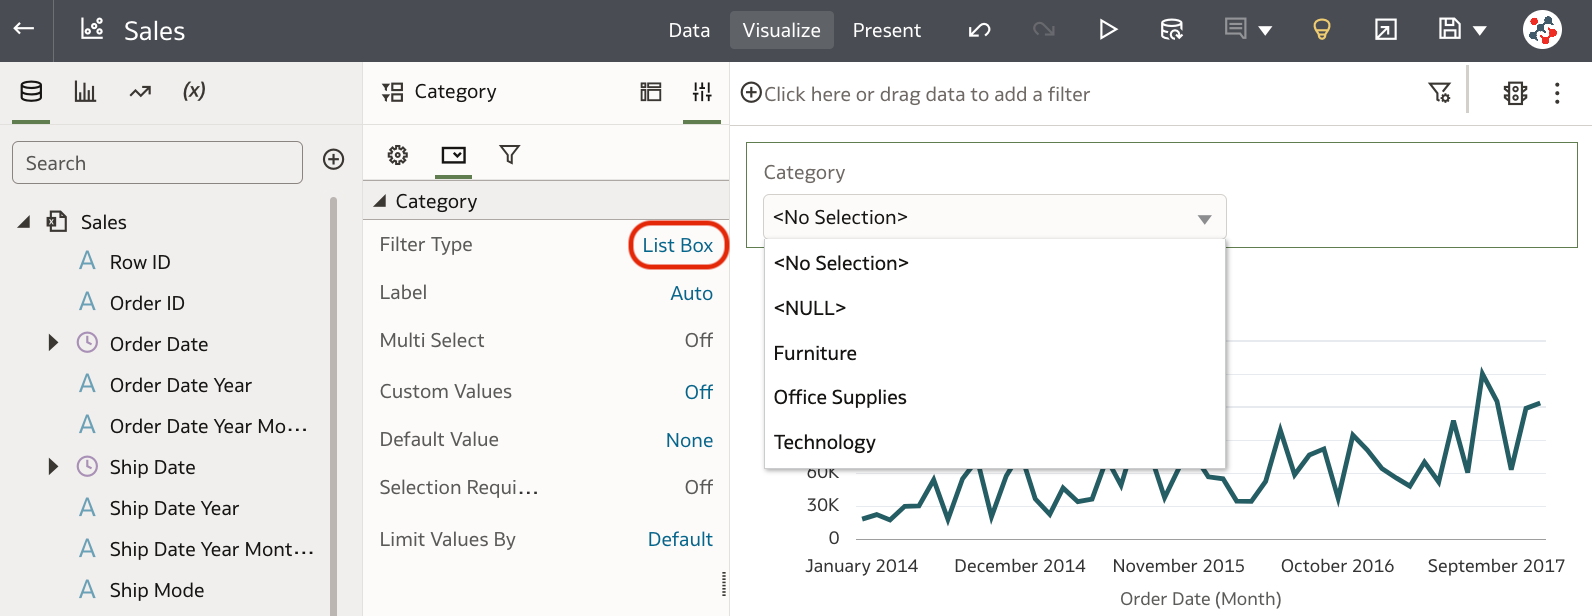
A new filter type (List Box), which provides a simplified list filter selection experience, is now available for dashboard and visualisation filters. It includes options for selecting all values (<No Selection>) and all null values (<Null>) with a single click, and it's applicable to text, non-aggregatable numbers, and dates (Figure 4).
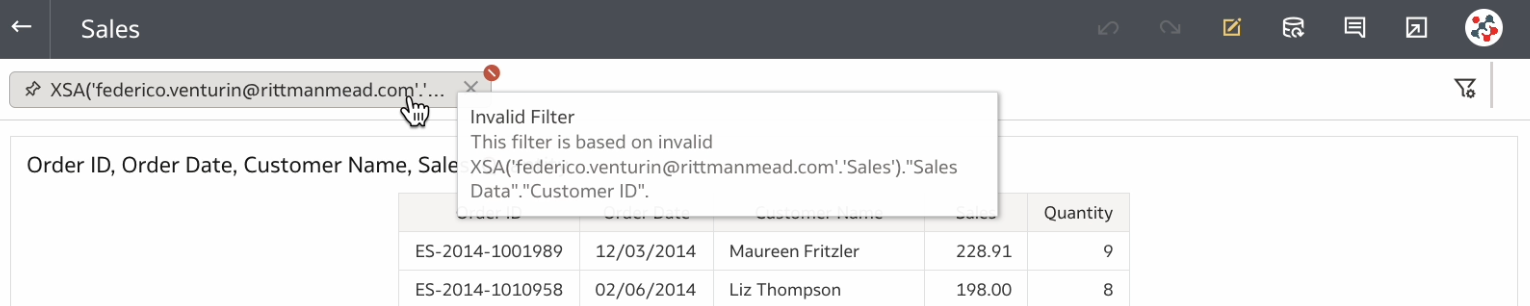
Identifying and addressing invalid filters is now easier than ever. An icon indicating an invalid filter is displayed automatically providing hover-over explanations which allows you to understand why the filter is invalid and how to fix it (Figure 5).
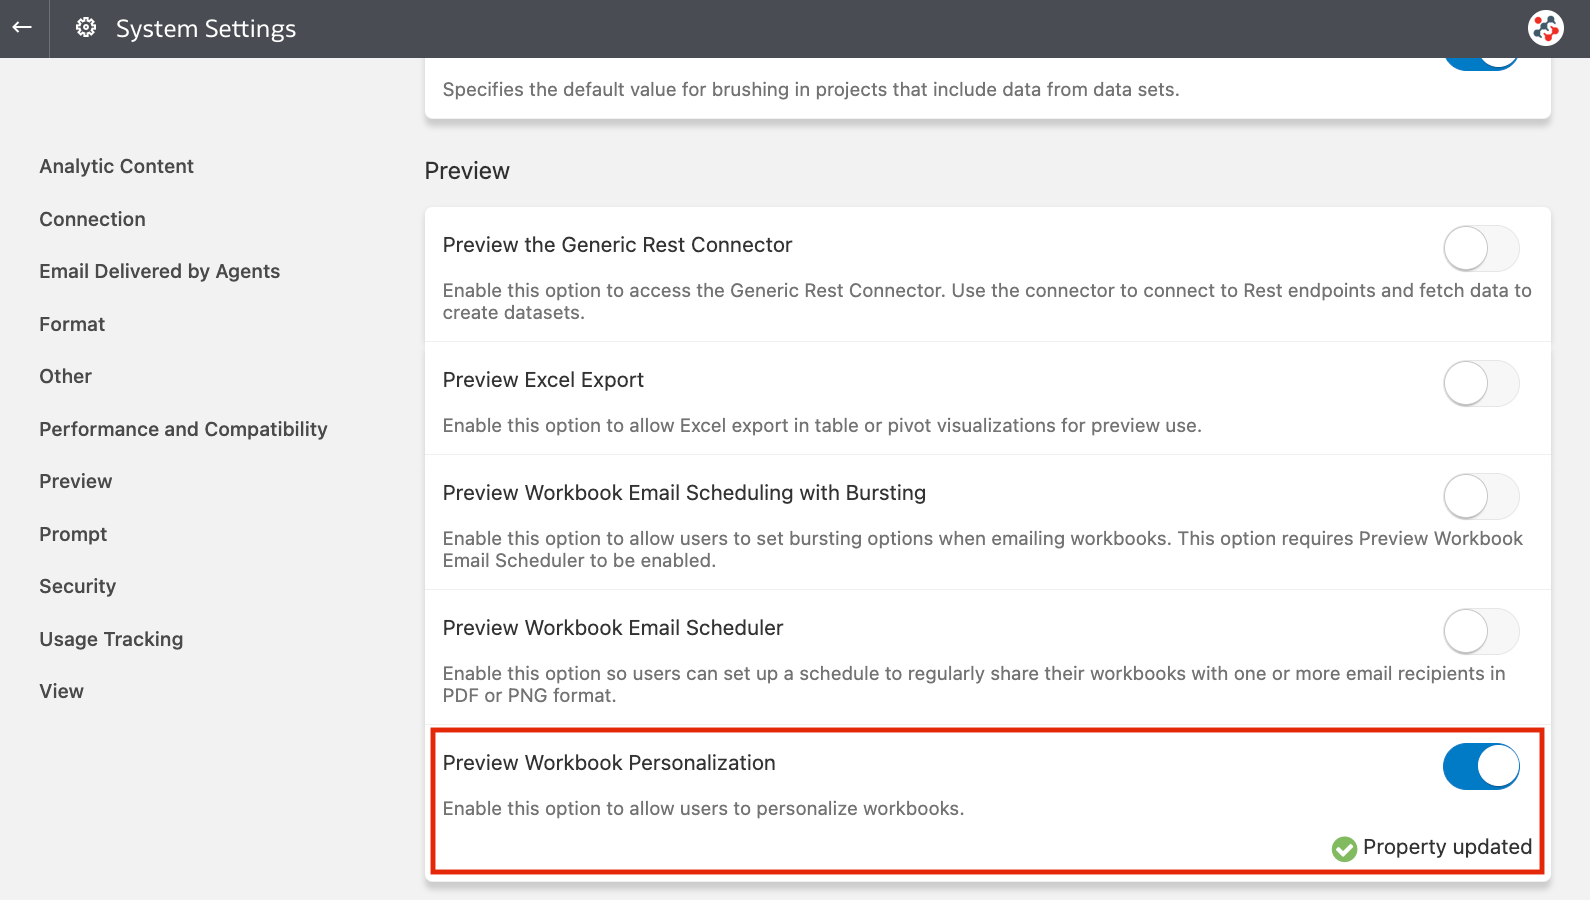
Filter selections in dashboard filters and visualisation filters on workbooks opened in viewer mode can now be made persistent for users, ensuring their choices are retained when they reopen the workbook (similarly to what happens with Saved Customisations in Classic). Please note that this feature is currently available for preview and must be enabled by an administrator in System Settings (Figure 6).
Enhanced Tiles Experience
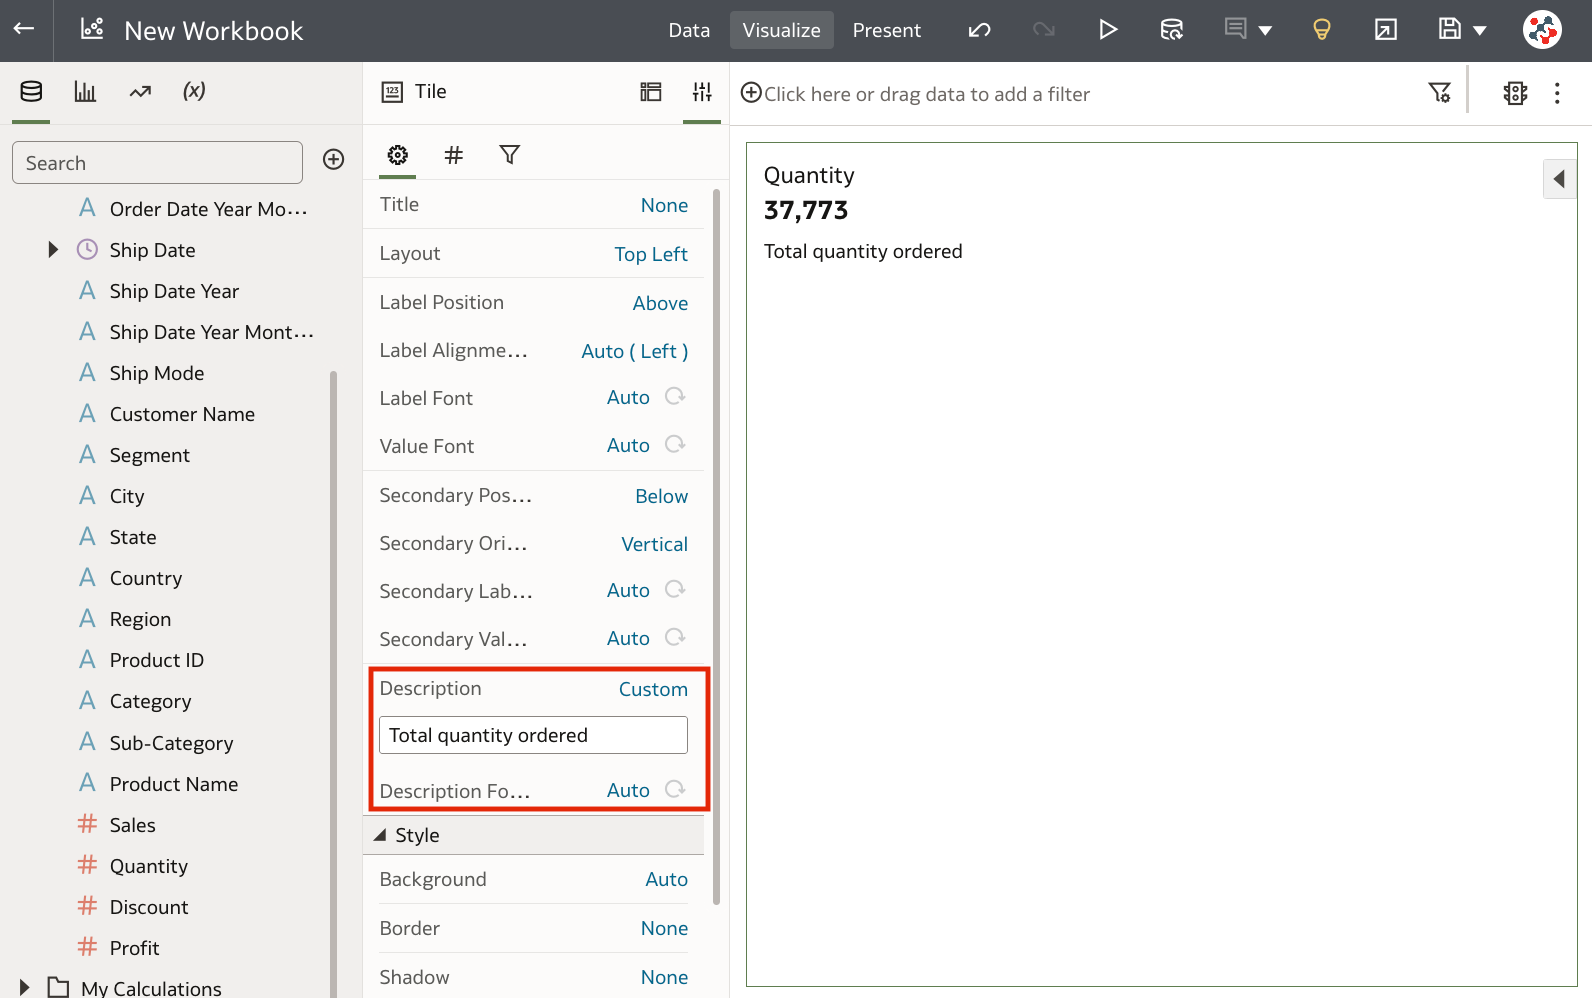
Tile visualisations now support data actions, and can be annotated with descriptions to guide workbook consumers (Figure 7).
Please note that the classic tile visualisation (named Tile Deprecated in workbook editor) is now desupported: it will still work in existing workbooks, but it will no longer be available for new ones!
Managing Connections and System Settings Programmatically
REST APIs can be used to programmatically manage data source connections and system settings. For example, you might want to create a script that creates (or updates) the same set of connections in both your test and production environments or sets multiple system settings.
These features are currently flagged as preview since their behavior could change in a future release, but they are always available and don't need to be enabled by an administrator first.
Be sure to check out Mike Durran's fantastic video demonstrations showcasing these new features. You'll find these valuable resources on the Oracle Analytics YouTube channel, and I highly recommend giving them a watch.
Other Features
The September 2023 Update also allows users to:
- Format dates and times in subject area-based columns and calculations in workbooks
- Visually demarcate sections with line spacers
- Display descriptions or other information (such as metric and attribute values) on top of geometries on map visualisations in workbooks
- Create a double-column parameter and bind it to a double-column list filter in a workbook
- Use Go Noto as the default font in analyses, dashboards, and pixel-perfect reports for PDF output
- Share workbook links with options including QR code
- Configure your usage tracking database in Semantic Modeler using a self-service data connection
- Track usage in your Oracle Database or Oracle Autonomous Data Warehouse through a data connection
- Improve profiling of datasets based on local subject areas with a simple Top N sample
- Deliver pixel-perfect reports securely using RFC8268 new key exchange methods
- Allow or restrict form submissions in safe domains
- Clear mail server settings with a single click
- Automatically sign out users when the inactivity timeout is reached
Conclusion
The September 2023 Update includes several new features, enhancements and fixes for Oracle Analytics Cloud that significantly improve the suite.
If you are looking into Oracle Analytics Cloud and want to find out more, please do get in touch or DM us on Twitter @rittmanmead. Rittman Mead can help you with a product demo, training and assistance with the migration process.