Oracle Analytics Cloud January 2024 Update: What's New?

The January 2024 Update for Oracle Analytics Cloud came out a few days ago and in this article, I'm going to have a look at the features it includes. If you are also interested in a comprehensive list of the defects fixed by the update, please refer to Doc ID 2919336.1.
Navigation Menu
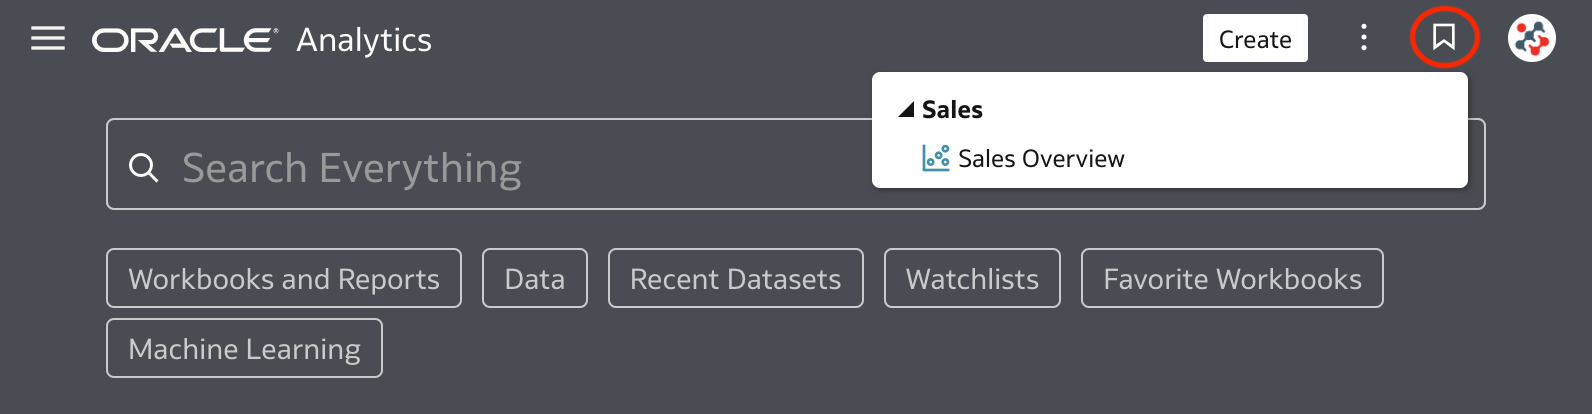
The Home page now features a new Navigation Menu, offering a convenient pathway to shared dashboards and workbooks. To access this menu, simply click on the bookmark icon located at the top right corner of the page (Figure 1).
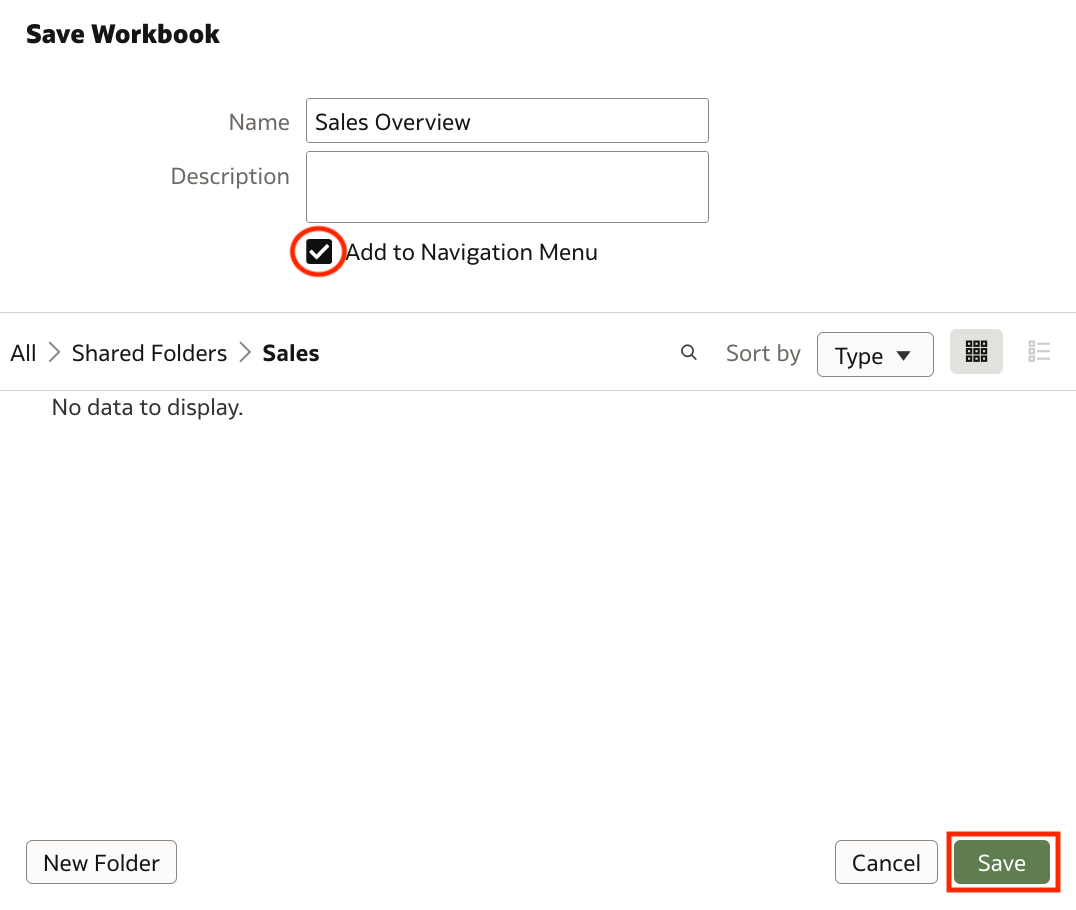
To include a workbook within this menu, ensure to select the Add to Navigation Menu option when saving the workbook within a first-level folder under the Shared location in the catalog (Figure 2).
Localizing Workbook Captions
Administrators can now export workbook captions to a file for translation, and then import them back into the catalog. This allows for the provision of localized captions to users, based on their locale settings within the browser.
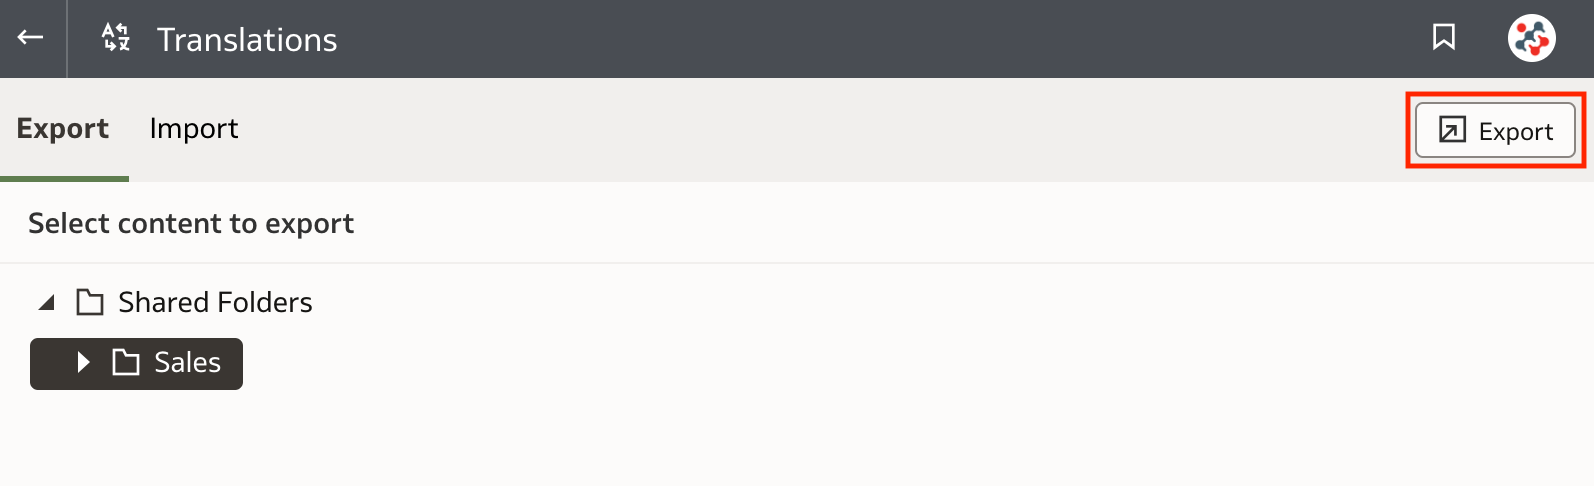
To export workbook captions, begin by clicking on the new Translations option in the Console page. From there, simply select the folder containing the captions you wish to localize, and click on the Export button to proceed (Figure 3).
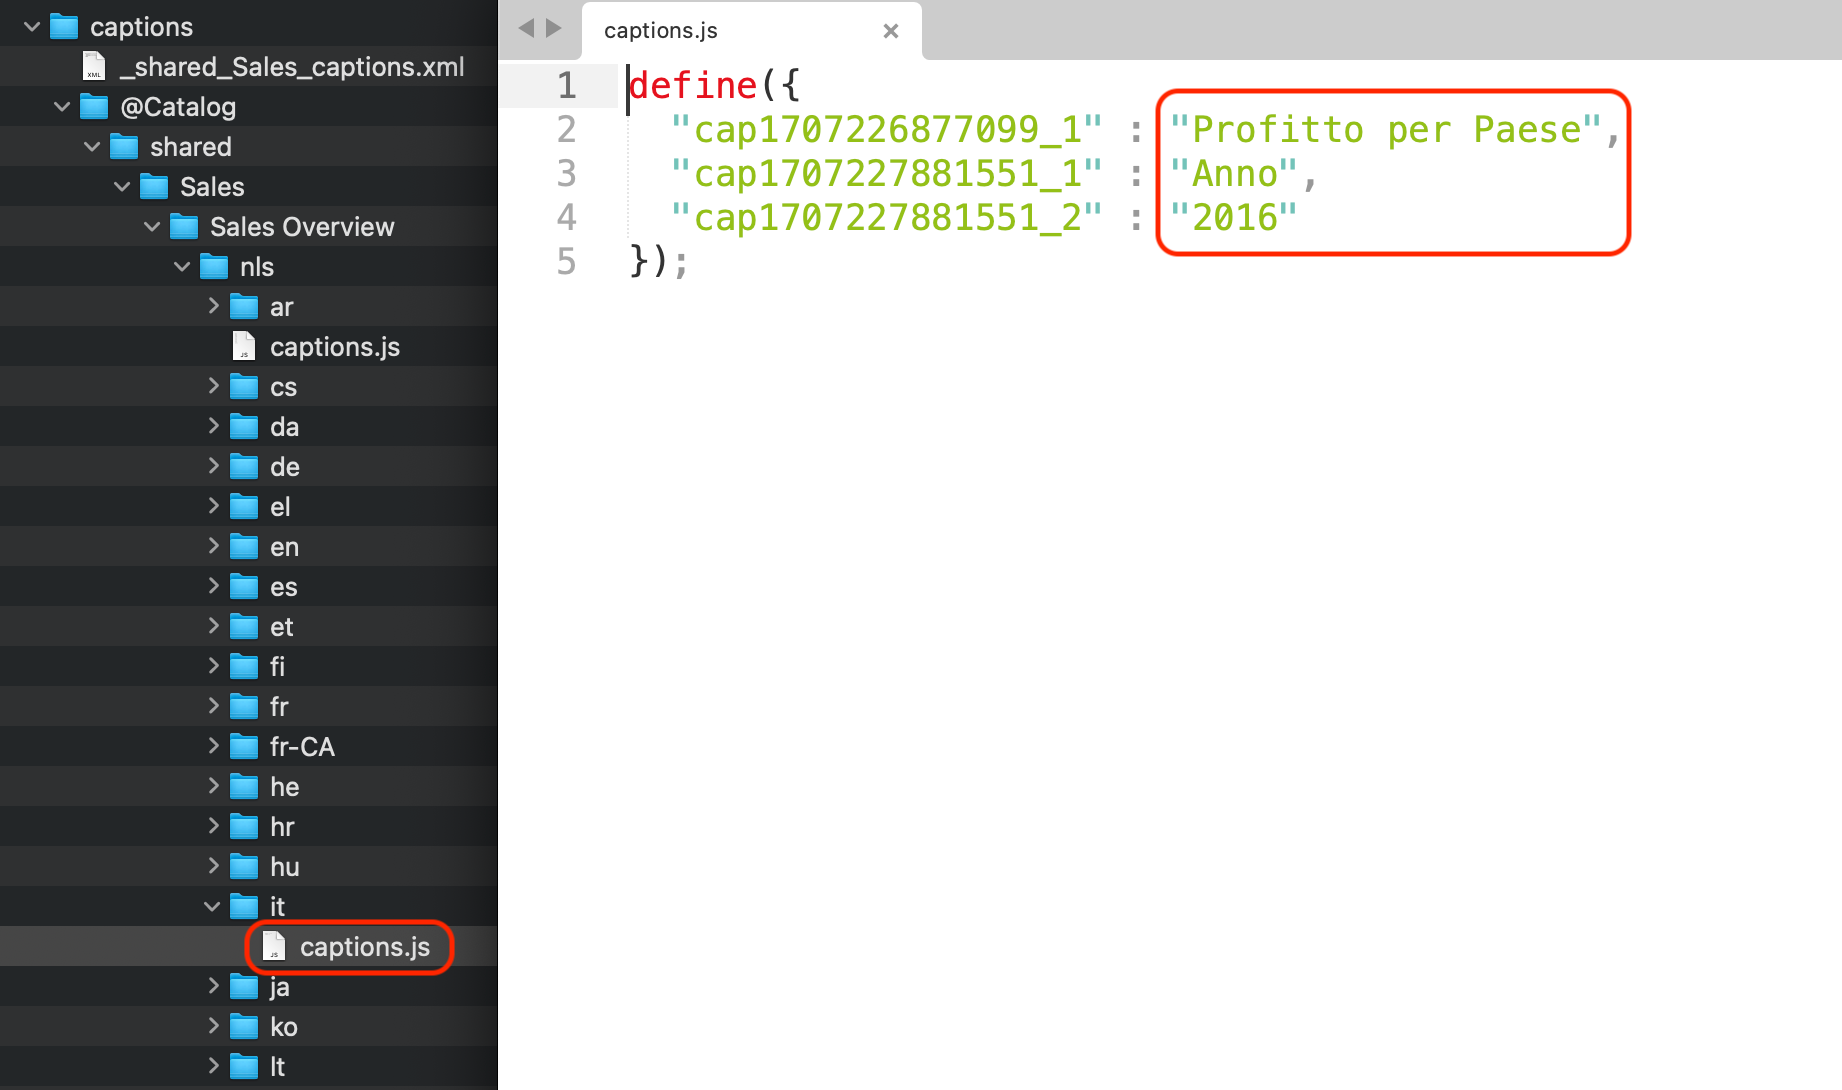
In the exported workbook captions ZIP file, you will find language-specific JS files for each supported locale. To translate captions, begin by opening the language-specific JS file you are interested in for editing. Then enter translated names into the appropriate caption elements (Figure 4), and add the modified file back into the exported ZIP file.
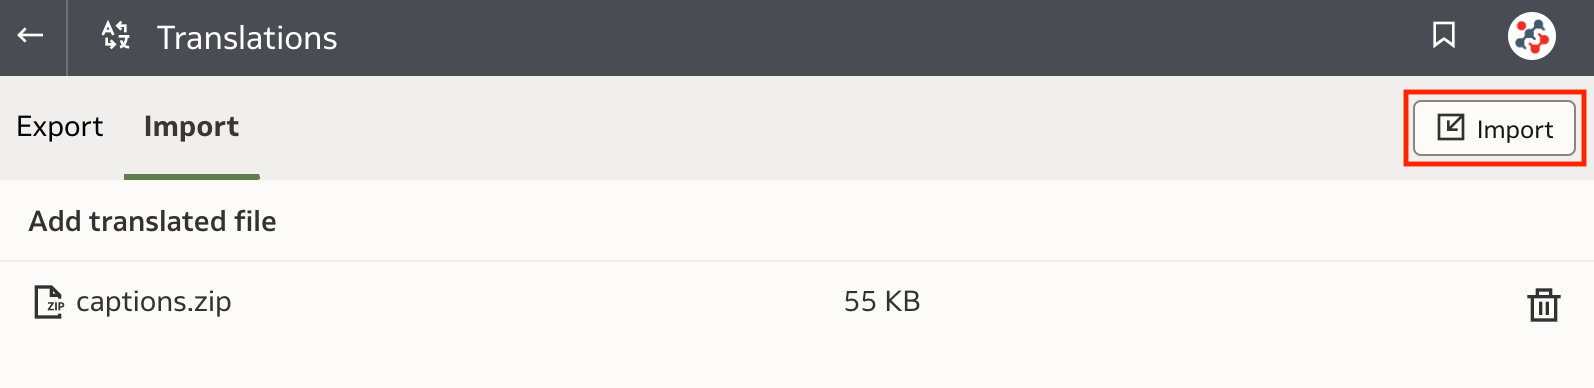
To import localized workbook captions, select the Import tab within the Translations page. Then click Select a file or drop it here to locate the file, and click on the Import button to proceed (Figure 5).
Enhanced Formatting Options
The Visualize canvas features several new formatting options, enabling you to enhance the visual appeal of tables, maps and reference lines within your workbooks.
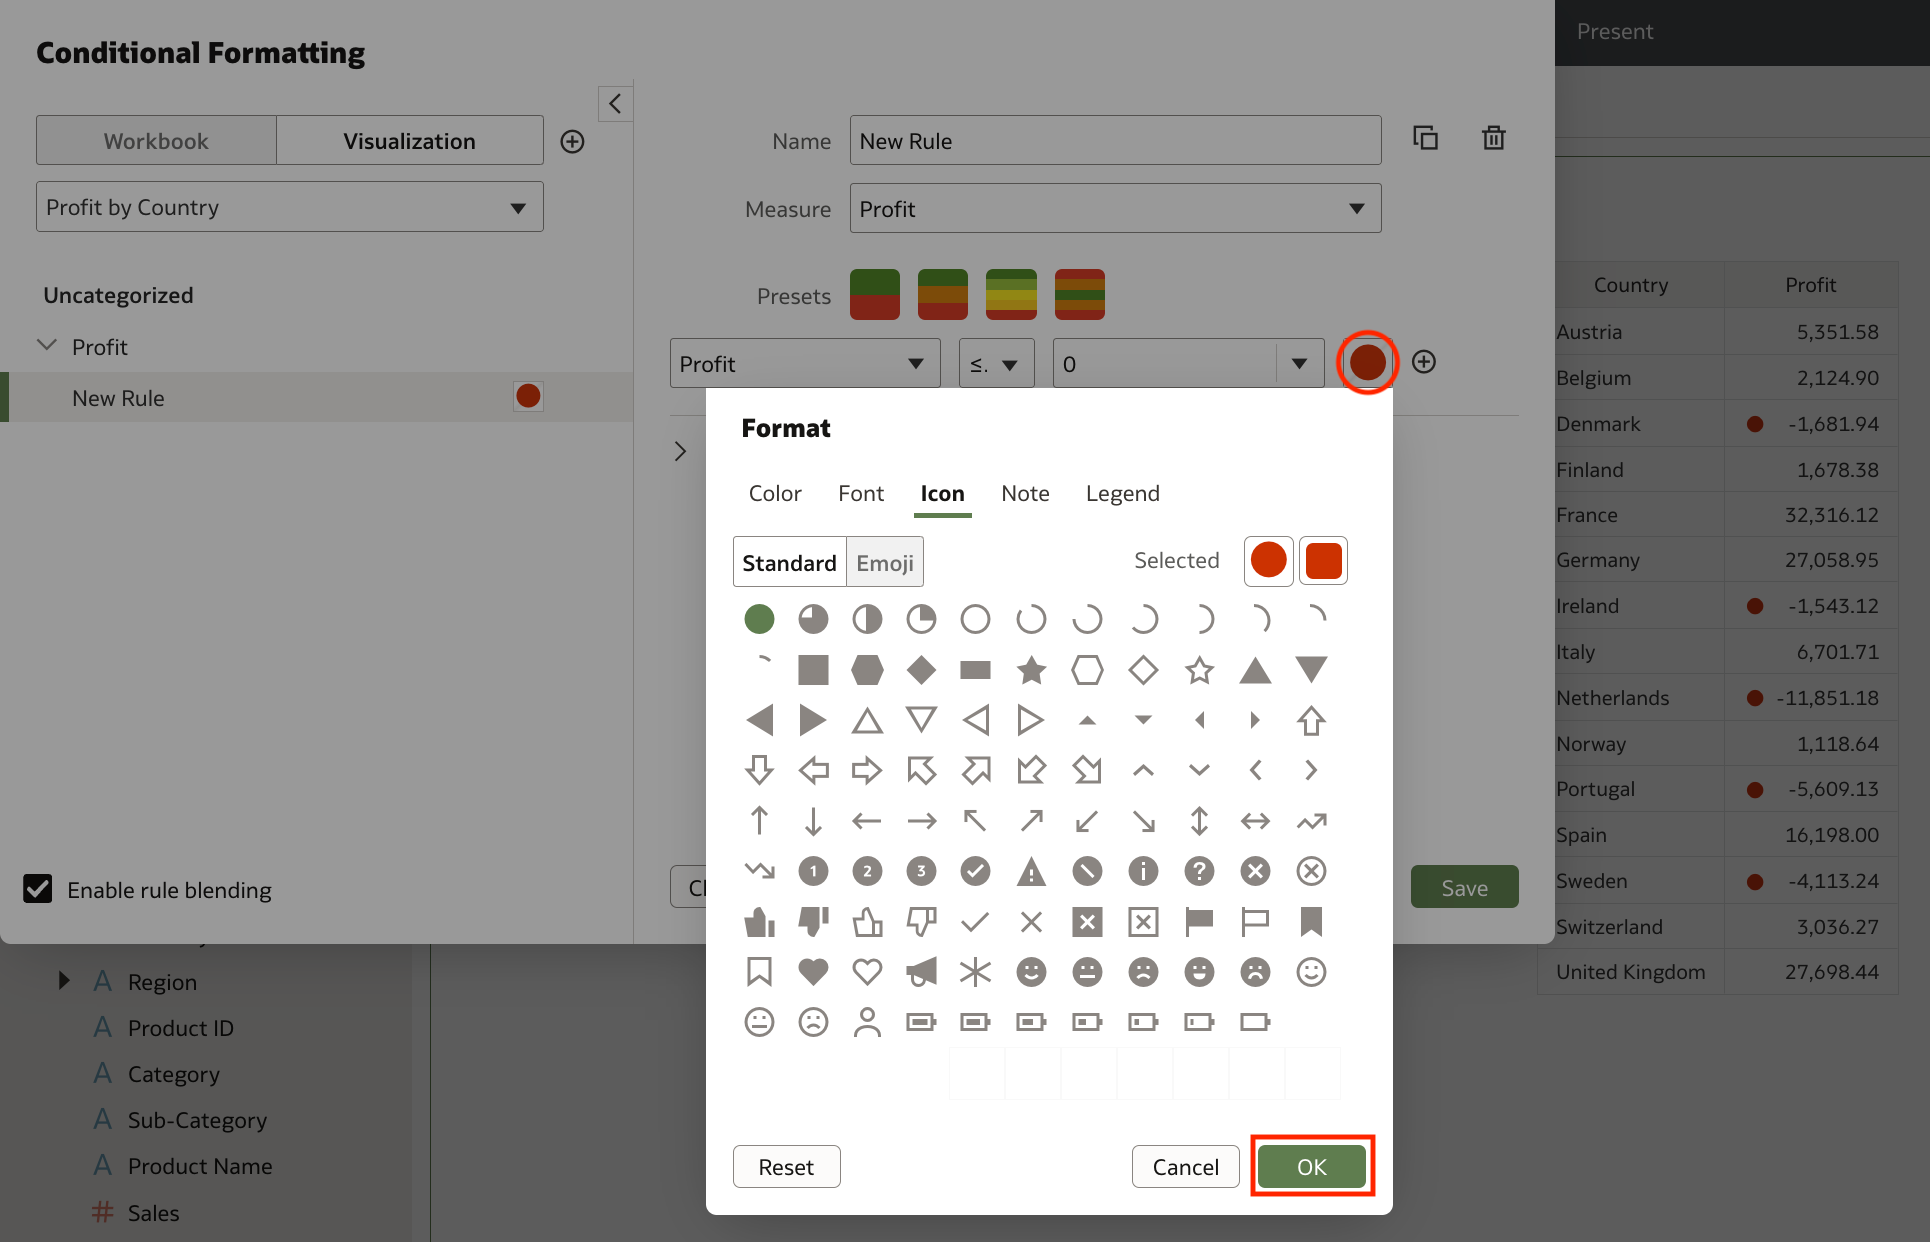
Conditional formatting rules allows authors to annotate measures in tables and pivot tables with icons and emojis. To use this feature, navigate to the new Icon tab in the Format dialog, select an image, and click on the Save button to apply the formatting (Figure 6).
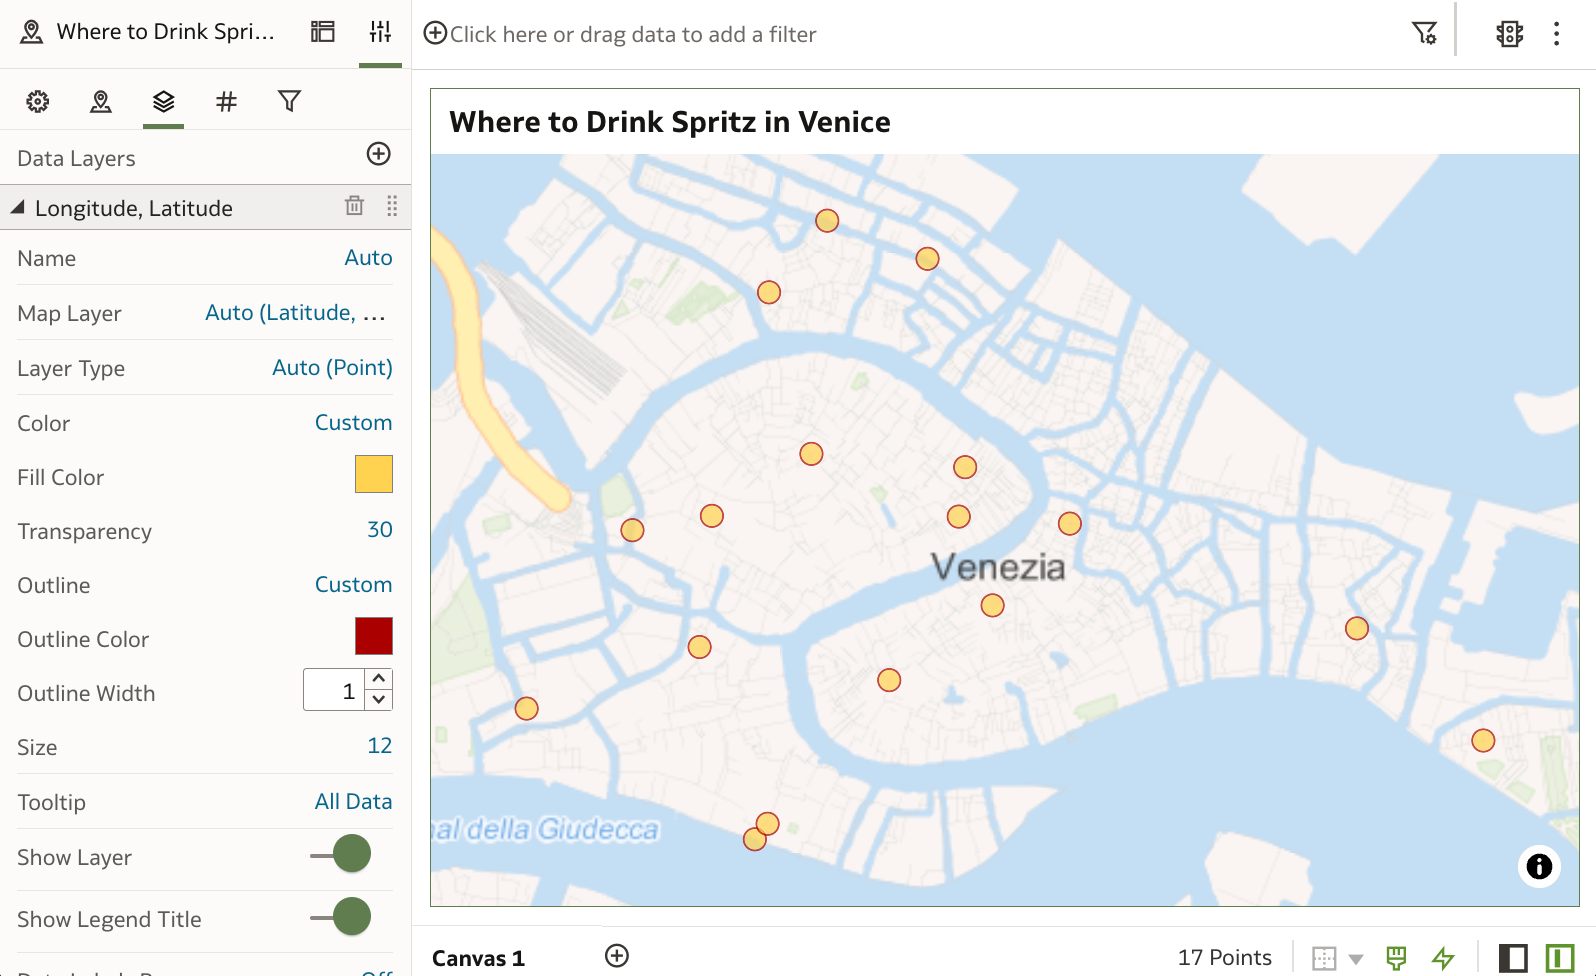
The Data Layers tab within the Grammar Panel includes additional properties for formatting default colors for region and point layers, as well as for selecting line thickness in line layers (Figure 7).
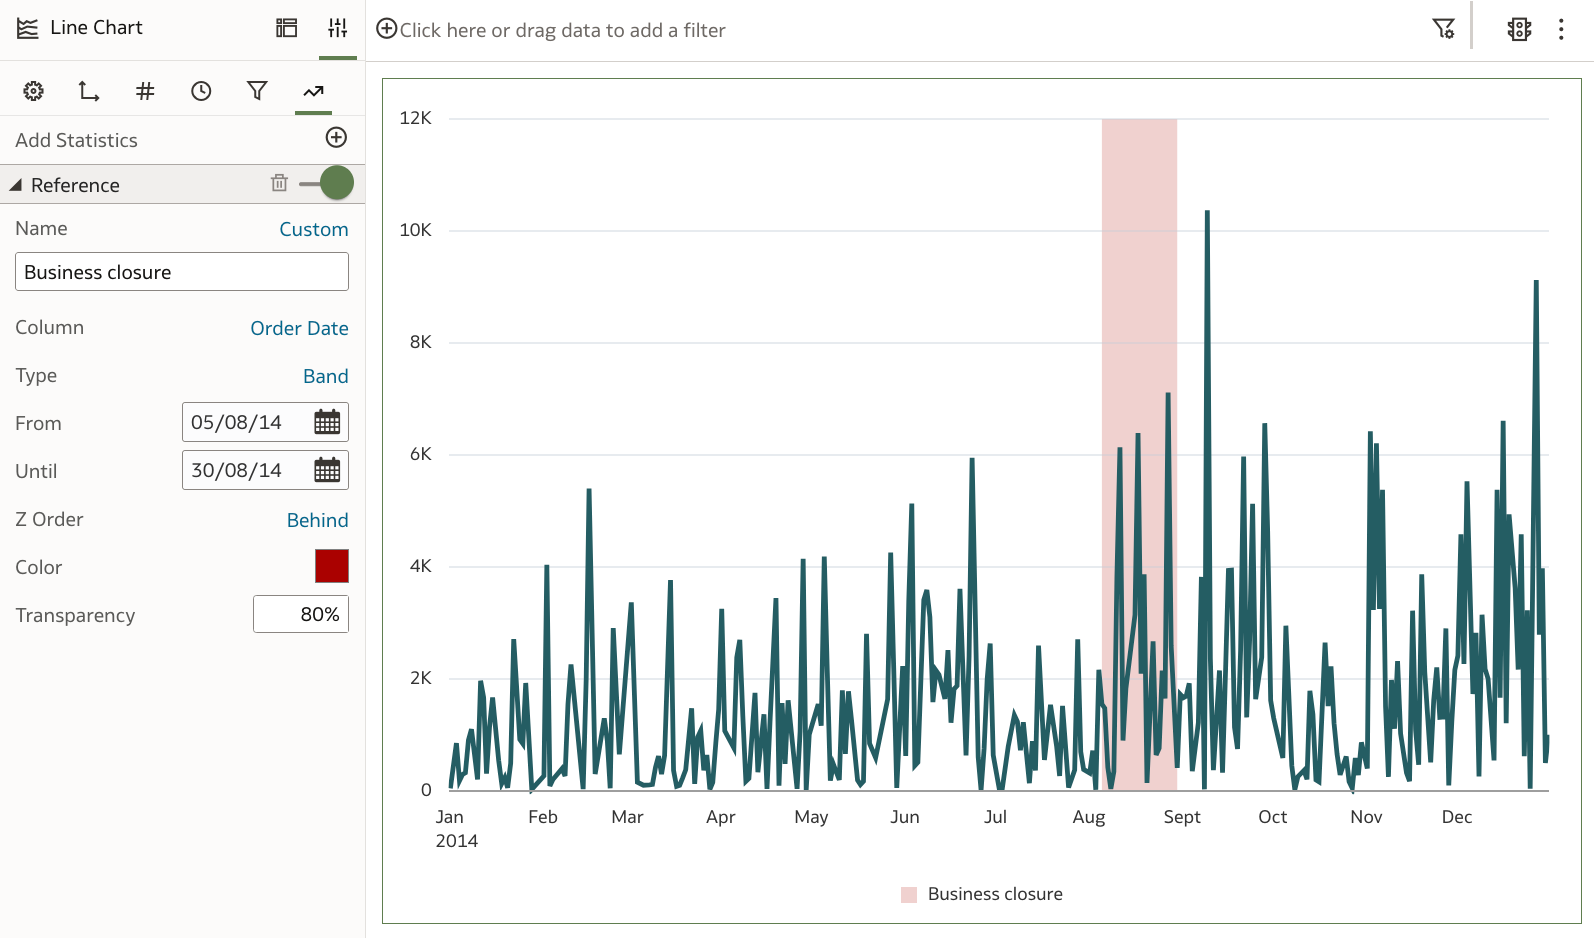
Date and date-time columns can be used to draw and format reference lines to enrich Bar, Combo, Line and Area visualizations (Figure 8).
Enhanced Parameters
This update also enhances parameters, streamlining the initialization process for users and reducing the likelihood of errors:
- Upon choosing the Column option to specify the list of values that a parameter can hold, any calculations within the My Calculations folder will be displayed alongside all of the dataset columns for selection.
- The default value used to initialize a parameter can now be selected from a drop-down list containing the available values previously defined.
- There is also a new Format Numbers property which determines if the parameter's numeric values contain the thousands and decimal formats (the formatting is determined by the browser language settings).
Other Features
- Control zoom in workbooks
- Execute Analytics Link data action in embedded workbook canvases
- Manage Catalog objects programmatically using REST APIs
- Merge datasets by column name in addition to the existing merge by column position in data flows
- Insert a link in the email body of scheduled workbook emails for downloading the PDF or PNG output
Desupported Features
- Albany fonts in analyses, dashboards, and pixel-perfect reports. You can use the Go Noto fonts instead.
- BI Composer Wizard. Oracle recommends to use workbooks for an easy-to-use and full-featured authoring experience.
- Catalog Manager GUI. Oracle recommends to use the Catalog Manager command line interface instead.
- Dashboard Fuse, Skyros, SkyrosCloud, blafp, and FusionFX styles. Oracle recommends to migrate dashboards to the modern Redwood or Alta styles.
- Manage Favorites. The option has been removed from the Favorites menu in Classic, but you can continue to add and remove favorites.
Conclusion
The January 2024 Update includes several new features, enhancements and fixes for Oracle Analytics Cloud that significantly improve the suite. If you are looking into Oracle Analytics Cloud and want to find out more, please do get in touch or DM us on X @rittmanmead. Rittman Mead can help you with a product demo, training and assistance with the migration process.