Oracle Analytics Server 2024: The 10 Best Features, Ranked

Oracle recently announced the general availability of Oracle Analytics Server 2024. While it introduces 100+ new capabilities, this article is focused on the top 10 ones according to my personal opinion. If you are interested in a comprehensive list of all the new features and enhancements please refer to the official documentation.
10. Navigation Menu
The Home page features a new Navigation Menu, offering a convenient pathway to shared workbooks and dashboards.
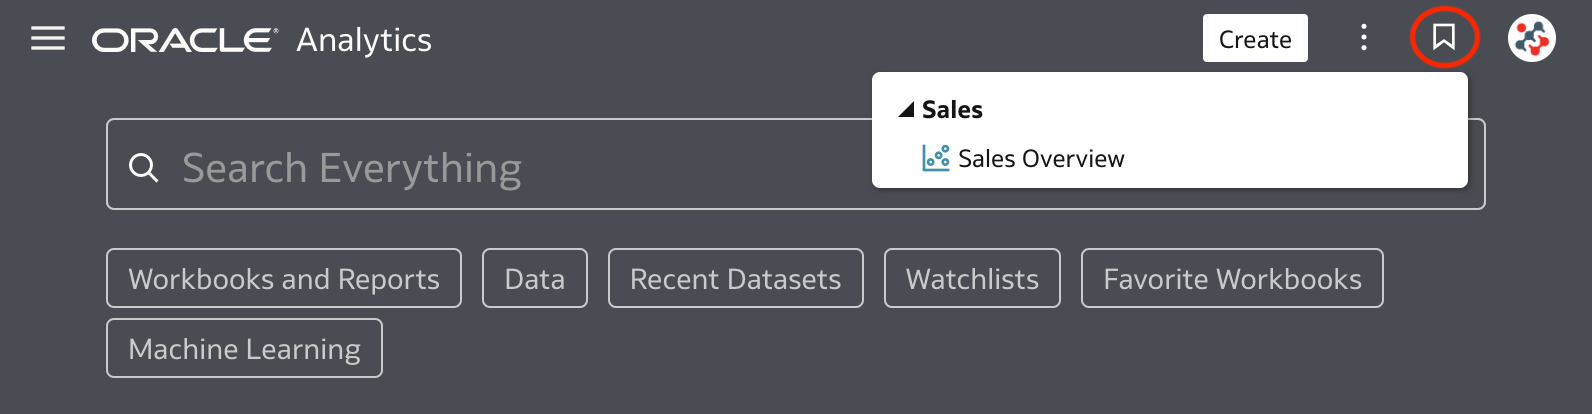
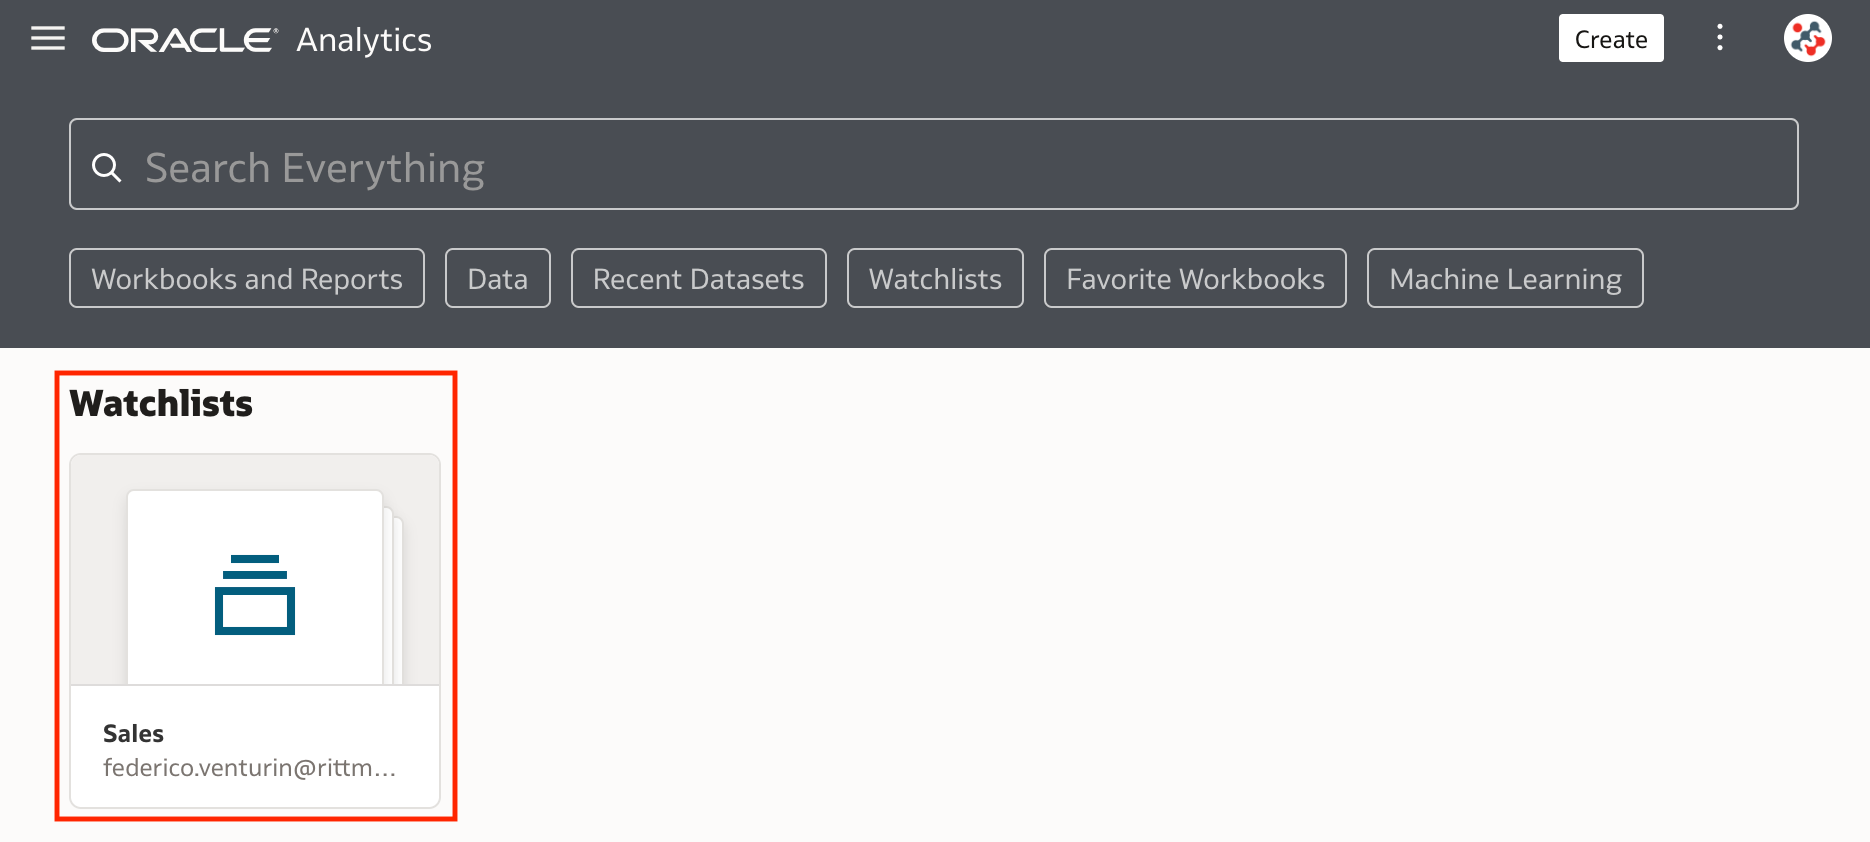
9. Watchlists
Watchlists allow consumer users to group together visualizations from one or more workbooks, and display them as visualization cards in the Home page.
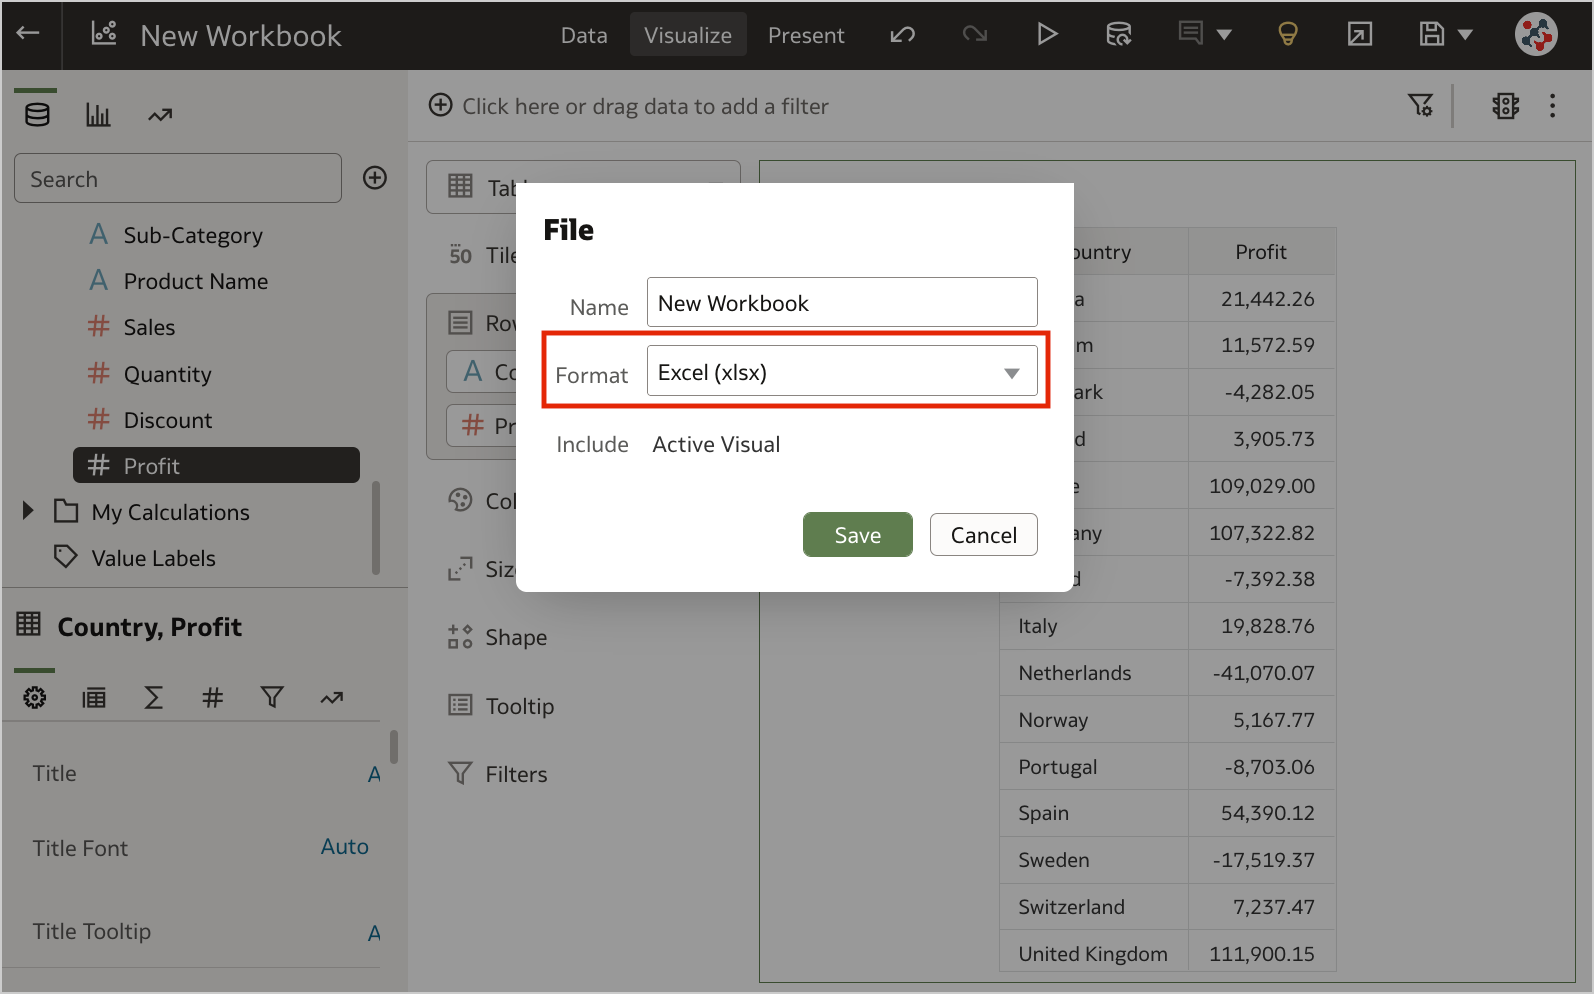
8. Export to Excel
Formatted data from table and pivot visualizations (up to 25,000 rows) can now be exported to the Microsoft Excel (XLSX) format.
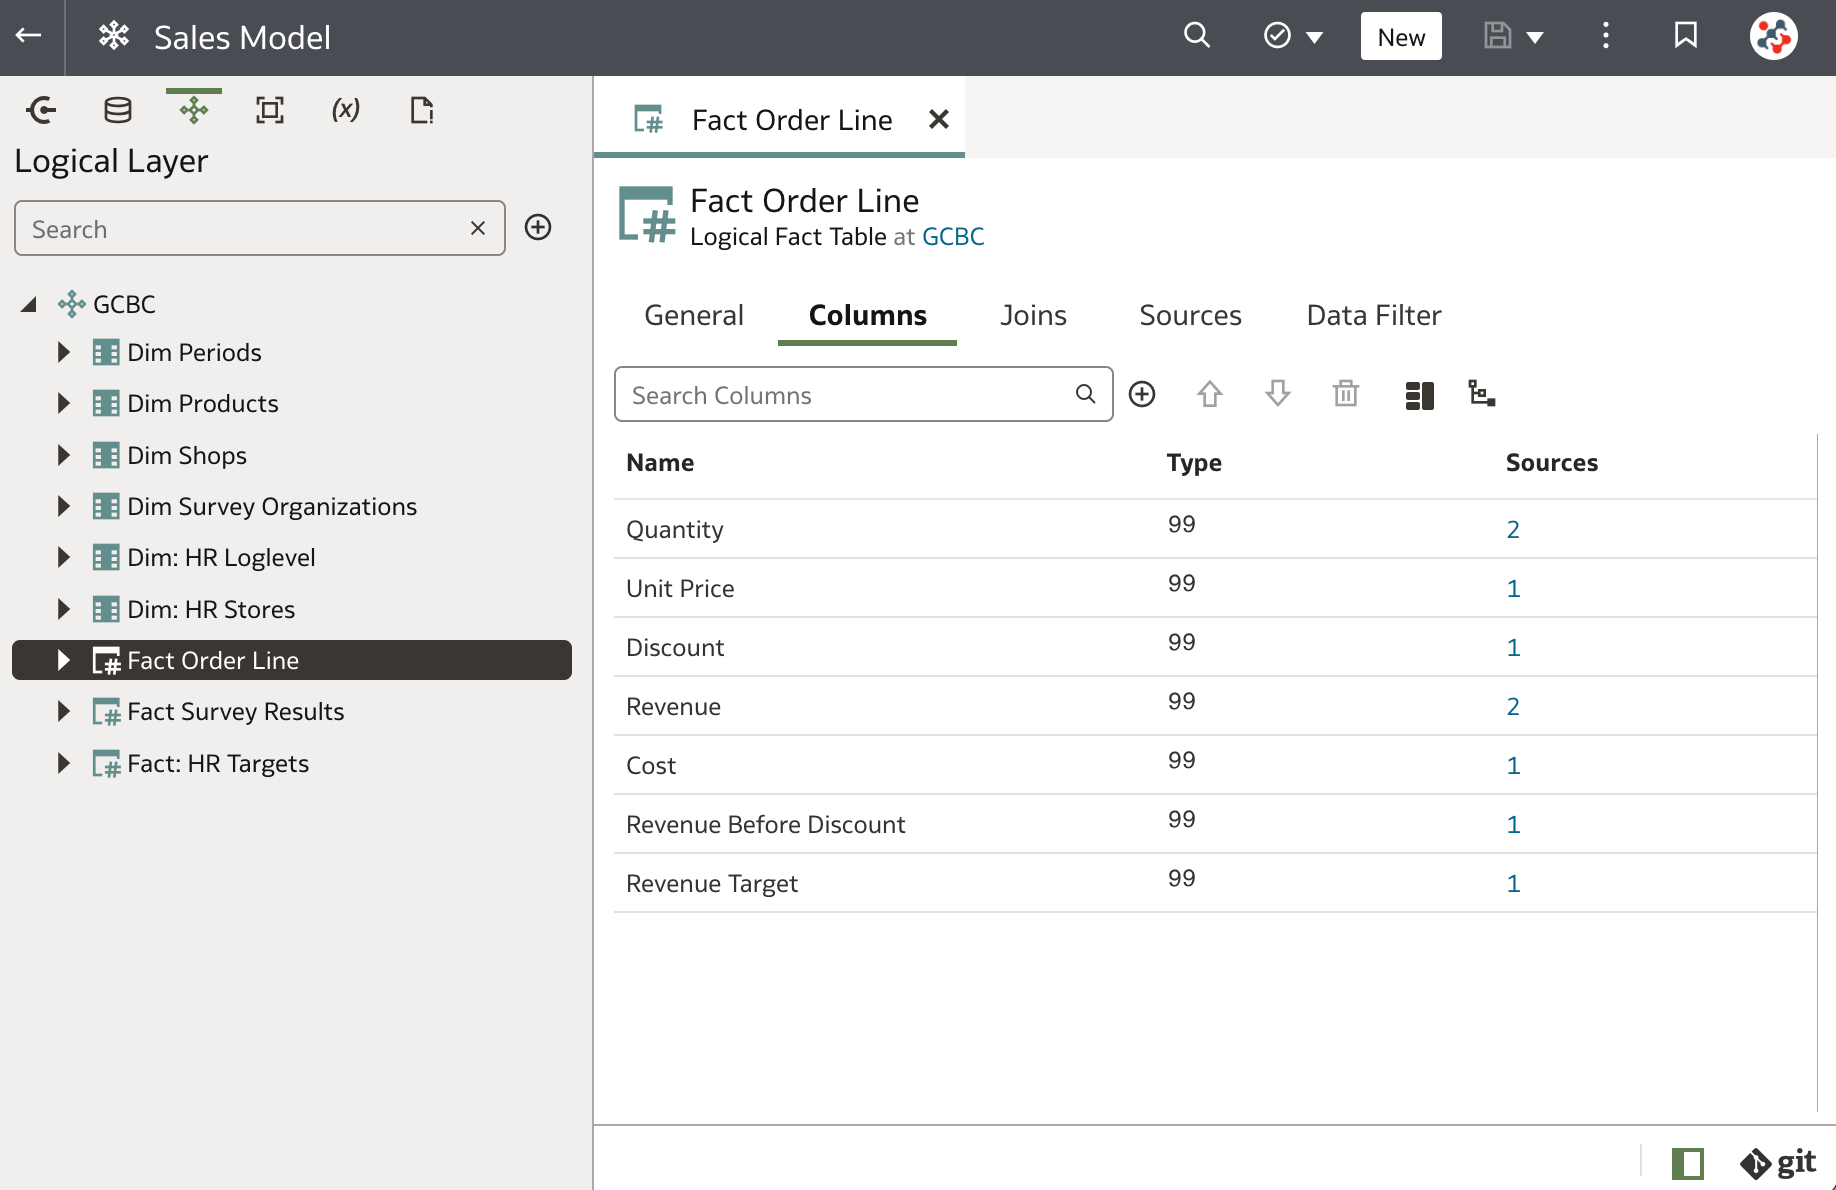
7. Semantic Modeler
The Semantic Modeler is a browser-based data modeling tool which provides a modern alternative to the Model Administration Tool.
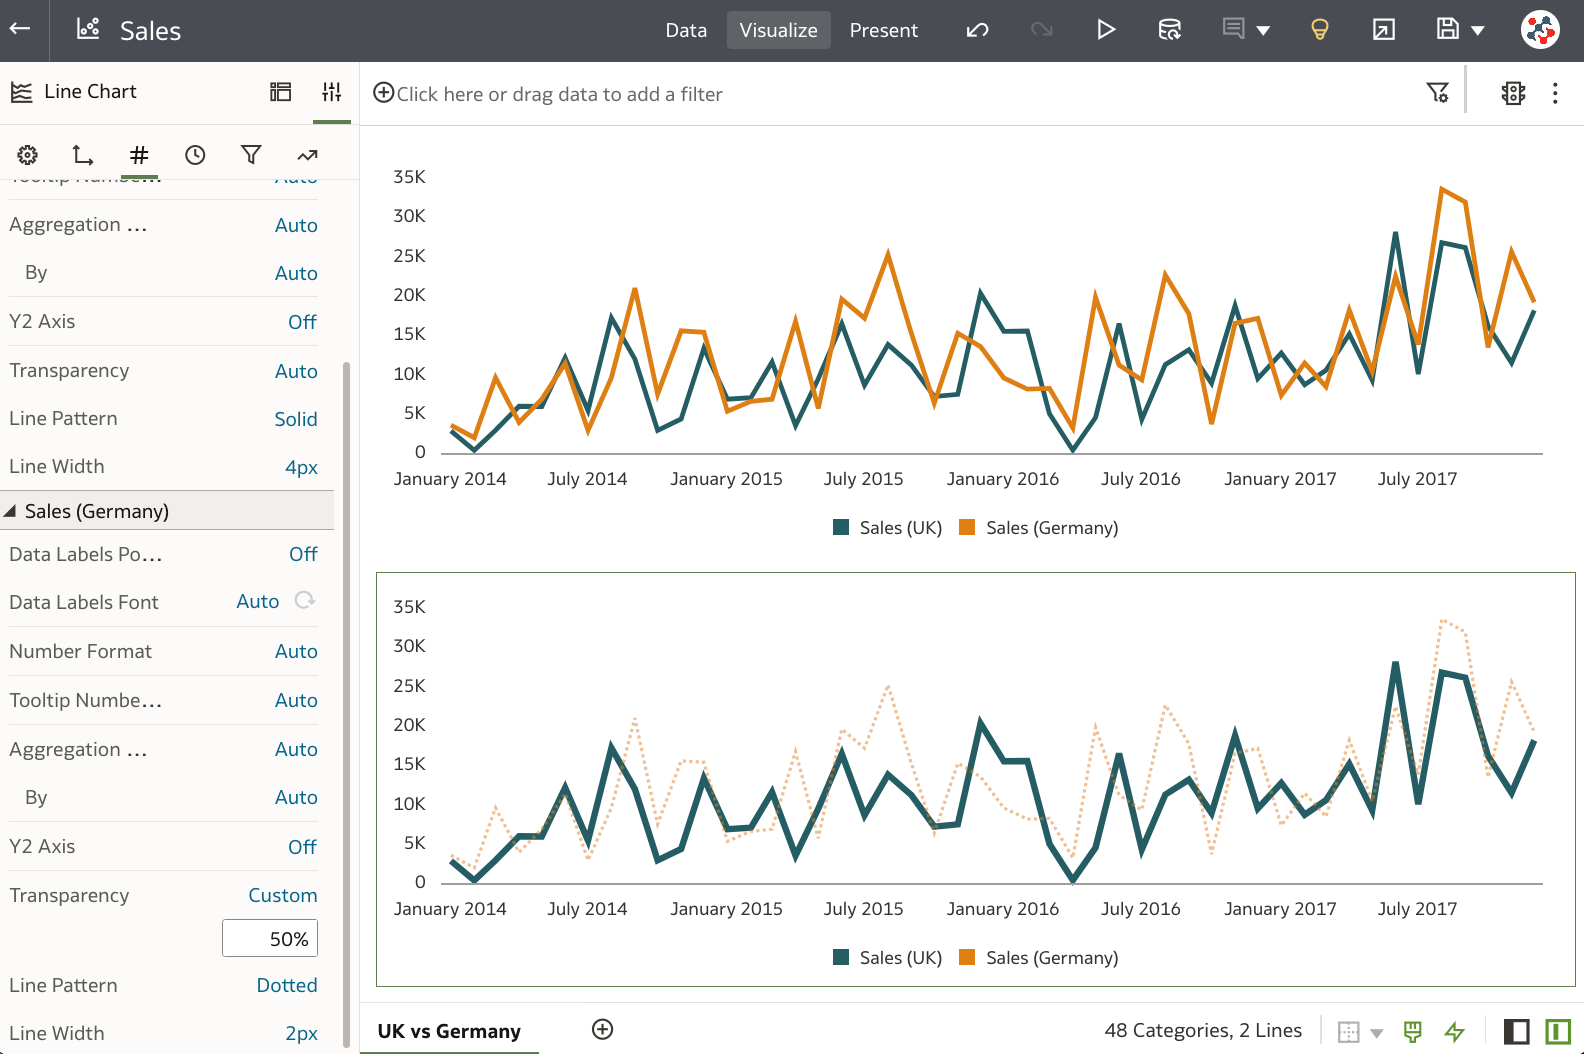
6. Enhanced Formatting Capabilities
The Visualize canvas provides a range of new formatting options, enabling you to enhance the appeal of visualizations within your workbooks.
For instance, you can now:
- Specify the line pattern, width, and transparency properties for Line, Area, Combo, Overlay, and Radar visualizations.
- Enhance Map visualizations by adding outlines to emphasise the boundaries of points and shapes, and display labels with advanced properties on Treemap and Grid Heat Map visualizations.
- Define conditional formatting rules to annotate measures in tables and pivot tables with icons and emojis.
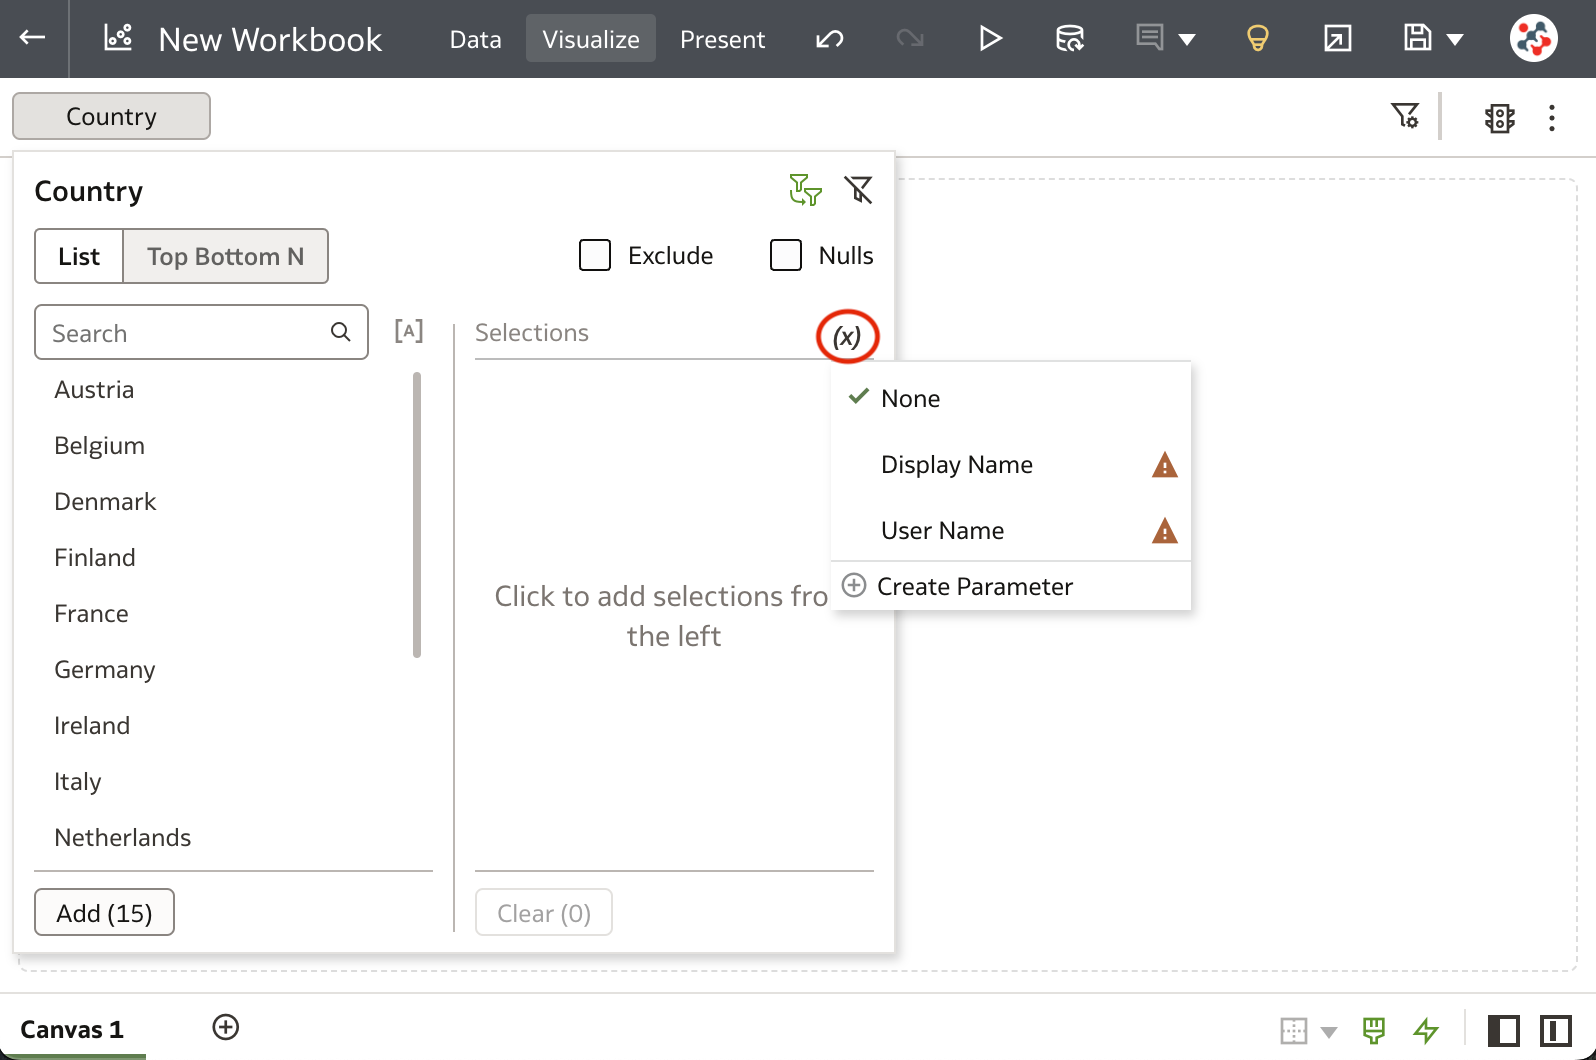
5. Enhanced Parameters
Parameters (the equivalent of presentation variables in Analytics Classic) were my favourite new feature in OAS 2023, and they have been further improved. They function as user-defined variables that hold and manage values that you can use in multiple places to dynamically manipulate workbooks. With a single click, authors can now create and bind parameters to list and range filters, eliminating the need to write logical SQL expressions to initialise possible values for parameters, and filter expressions to apply them to visualizations.
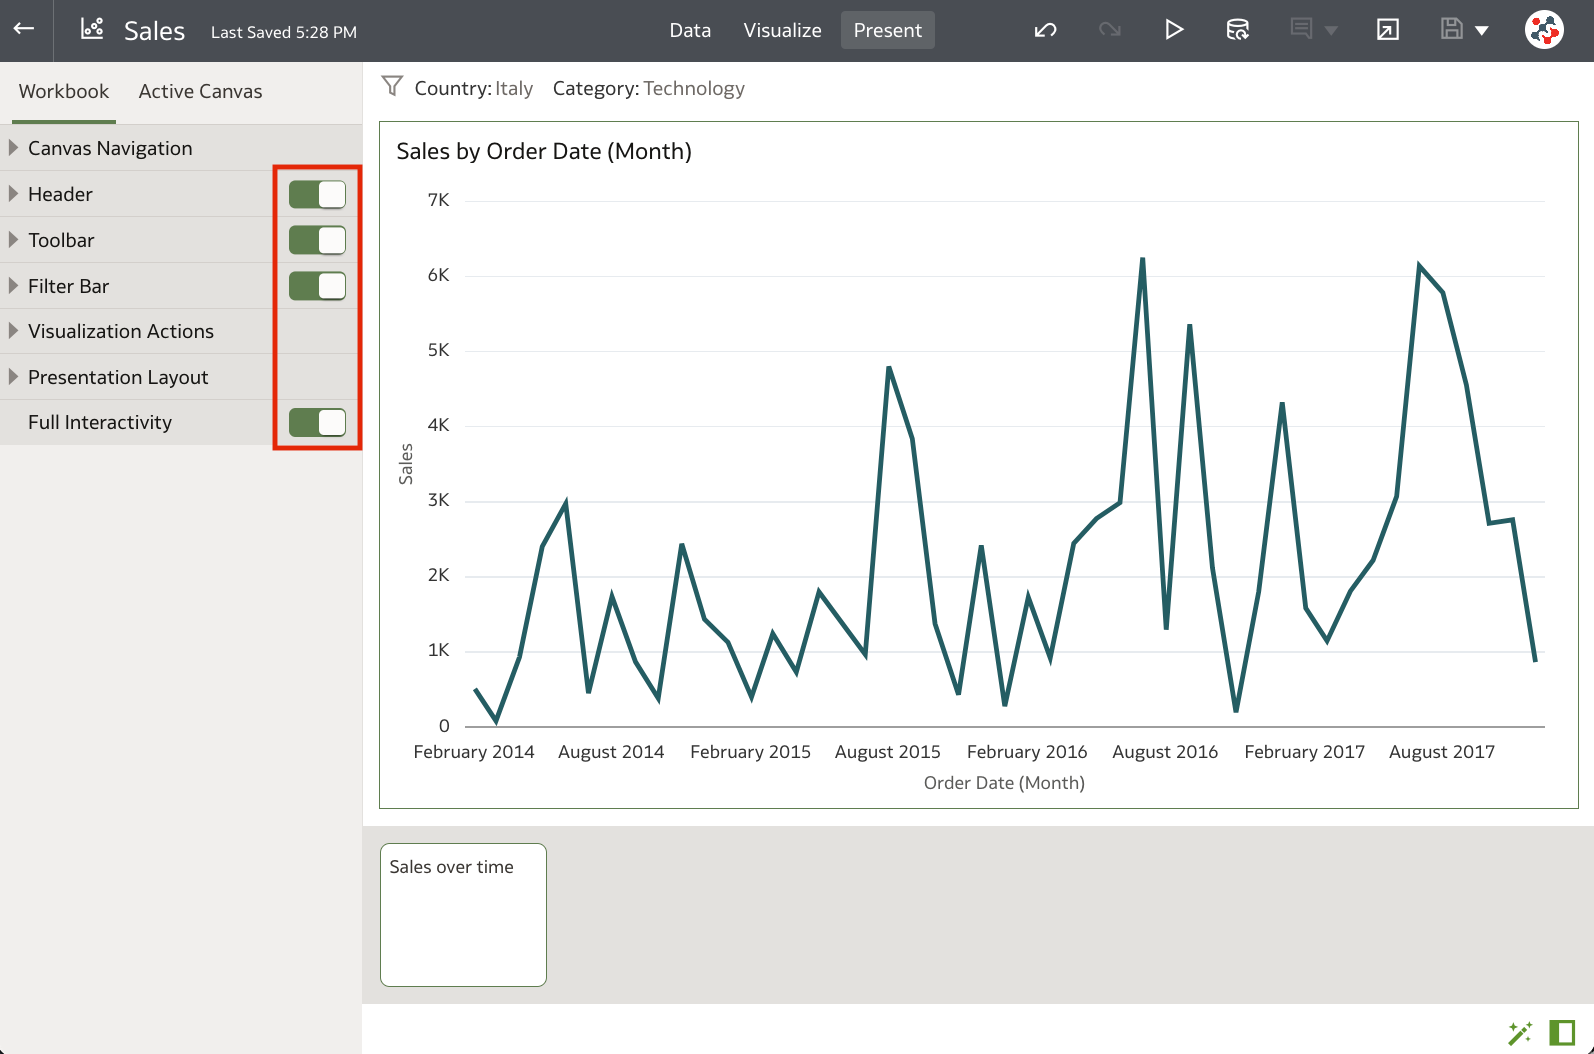
4. Enhanced Presentation Capabilities
The Present canvas provides several new settings, offering greater control over the presentation flow for consumer users:
- In the Workbook panel,
On/Offsettings have been replaced with toggle switches.. - In the Canvas Navigation section, the Style setting includes a new
Top Tabsoption, enabling you to showcase each canvas as a tab at the top of the page. - The Workbook panel includes a new Toolbar section, providing the ability to show or hide the workbook's toolbar, and eventually specify which toolbar option to display.
- The Filter Bar section includes various new options that enable you to define the filter interactions available to users.
- The Visualization Actions section allows you to globally enable interactions at the workbook level, and selectively disable them on a specific canvas.
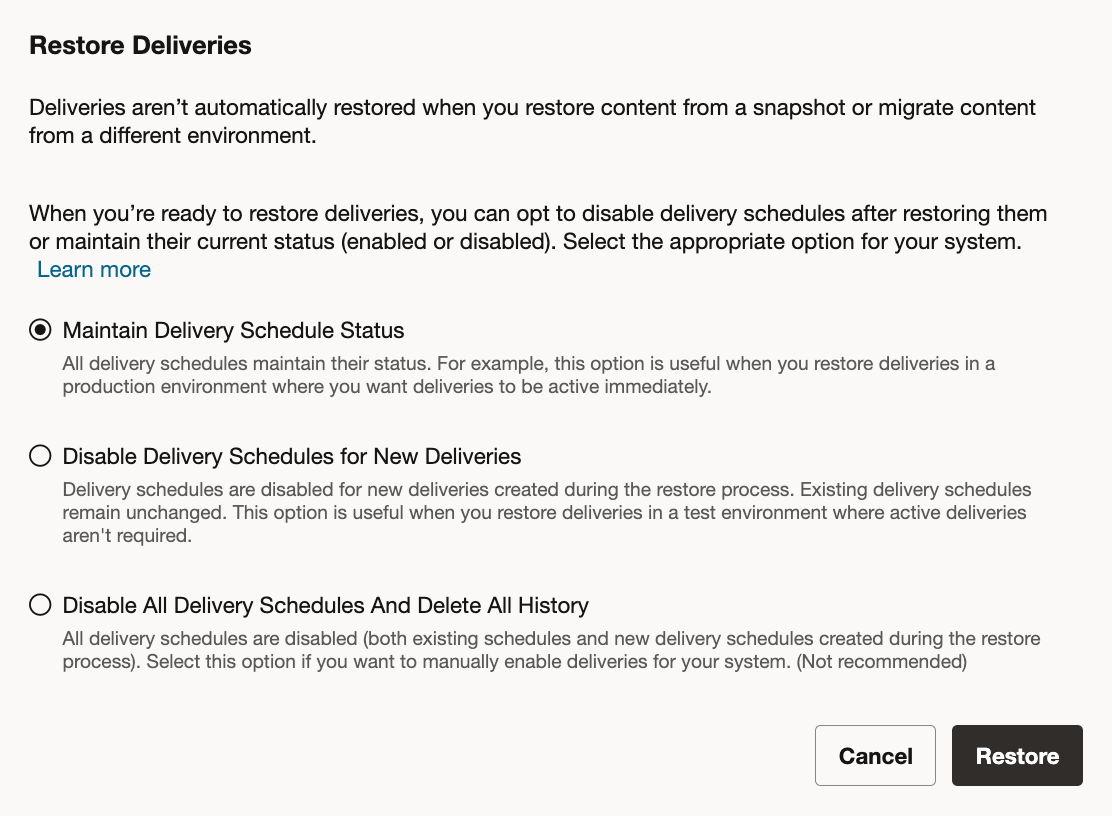
3. Restore Deliveries Options
Until now, when restoring agents from a snapshot or migrating them from a different environment, delivery schedules always ended up disabled in the target instance. The new Restore Deliveries options give administrators greater flexibility: for instance, they can enable delivery schedules immediately after restoration, eliminating the need for manual intervention or custom scripts!
2. Role-Based Filters
Role-based filters can now be defined in datasets enabling authors to set up row-level security, and ensuring that consumer users see only data that's relevant to their role. Role-based filters are applied when users access datasets from workbooks or data flows, but they don't affect the preview data displayed in the dataset editor.
It's worth noting that when you define at least one role-based filter for a dataset, any user who does not have that role won't be able to see any data in workbooks, including the dataset owner! To overcome this potential issue, Oracle recommends to create a filter for super users with the expression 1=1 to see all data.
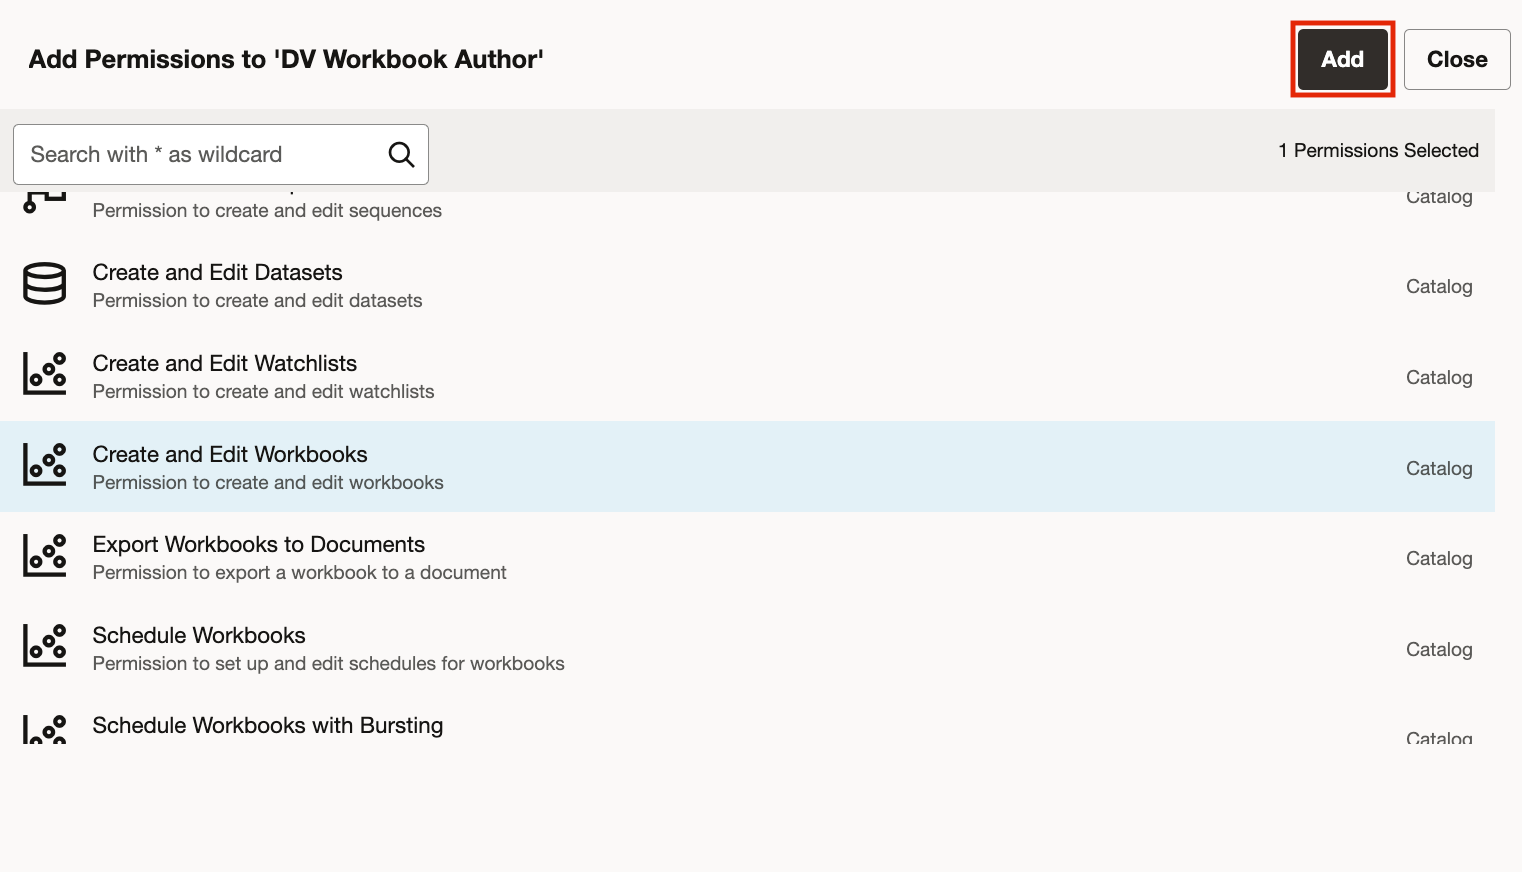
1. Fine-Grained Permissions
In the past, the all-or-nothing approach for handling permissions in Data Visualization posed a significant hurdle to its widespread adoption since administrators understandably preferred to fully disable it, rather than granting their users excessive power. The ability to handle individual permissions allows us to overcome the aforementioned barrier, enabling administrators to tune Data Visualization security at a finer grain than previously possible. You can create user-defined application roles, granting individual permissions to align with your specific requirements or revoking permissions that are no longer needed.
Conclusion
OAS 2024 includes an incredible amount of new features that significantly improve the platform, enabling customers to gain deeper insights from their data and take actions that result in better business outcomes.
If you are looking into Oracle Analytics and want to find out more, please do get in touch or DM us on Twitter @rittmanmead. Rittman Mead can help you with a product demo, training and assist within the upgrade process.