Two Tales of Data Storytelling


We’ve recently been focusing on how data is presented to various audiences using different methods. The audiences can vary greatly by subject knowledge and can be thought of in terms of:
- Subject matter experts: These individuals have a deep understanding of the topic and want to explore the data to generate new insights
- Subject data users: This group requires data to accessible and understandable with the aim of staying informed and making data driven decisions
- Knowledge seekers: These individuals want to understand the subject in more detail to either learn something new or change their current view
It was a thought provoking discussion on how data could be presented to each of these audiences. This reminded me of times in the past were we have used data storytelling to influence positive change within an organisation. Let me indulge you for a few minutes with a couple of my own tales of data storytelling.
Shifting Perspective
We were helping a large telecommunications company with the analysis of customer satisfaction survey responses, the key measure from the survey was the score attributed to the one mandatory question “likelihood to recommend”. The surveys were sent to customers based on interactions with the company, for example: service calls, sales calls, technician visits, etc.
The main belief within the organisation was that the response was a reflection of the interaction. This position was so embedded into the mindset the scores on the interactions were included within the performance review of individuals.
We could never see a good correlation between the outcome of an interaction and the response score. The data did not support the accepted position within the organisation!
Despite the absence of evidence, employees of the organisation were having their personal performance measured using this metric. It was simply because the relationship wasn’t understood an assumption had become the accepted truth.
One regional manager was constantly questioning the measure knowing that his top guys were being impacted. We worked in collaboration with the manager to gain a different perspective of the data. Then we worked together to convince senior management that the current understanding was incomplete and we needed to present the data in way that could be easily understood and accepted. A great way to educate an audience is to build up a story and guide the audience through the narrative.
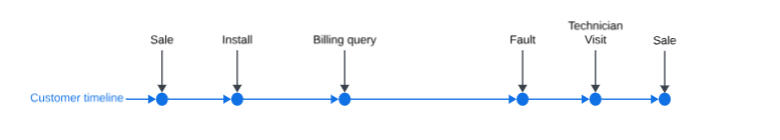
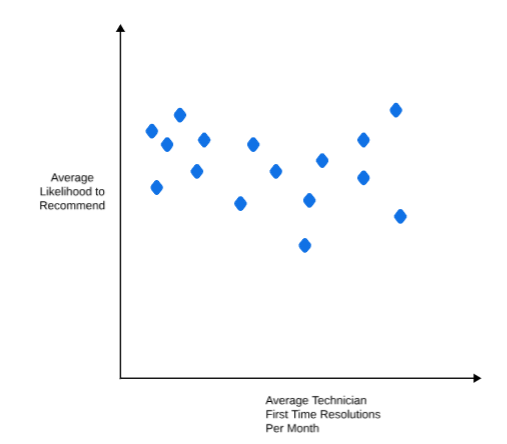
We really needed to set the scene that the measurement was not a reflection on the performance of the individual. One example included in setting the scene was to put the focus on how exceptional technicians with a great work record aren’t differentiated from technicians with a less exceptional work record.
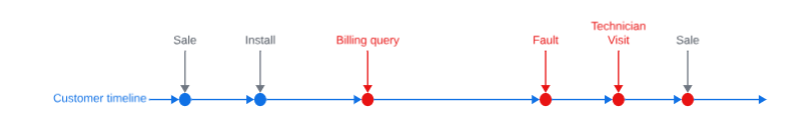
However, when looking at the measure from the perspective of the customer journey it was more clear. The more negative events a customer had on their journey the more likely they would not recommend the company. Presenting the information through that lens showed a clear correlation.
Therefore, the performance of an individual was being measured using a metric they could not directly influence. The new information resulted in the measure eventually being removed from the performance review.
This shift in perspective inspired the creation of some really powerful projects. First came more analysis providing the insight that after three negative events the response to the survey was very difficult to improve. This was followed with a drive to closely track customer interactions and proactively take action to prevent the third negative event.
As a consultant passionate about data analytics its such a great feeling to know your contribution is helping to make real positive changes.
Bringing Data to Life
Another nice example of data storytelling from previous engagements is from my time helping a large parcel delivery company. The project I was working on was focused on making the parcel delivery information available in the warehouse and presenting it through Oracle Analytics. Whilst performing some quality checks on the data I spotted some interesting rows that peaked my interest. During this same period we were looking for opportunities to showcase that there was a real benefit for spatial reporting using map layers.
During the data quality checking, I looked at the greatest distance between the geo tags of a delivery driver scanning a parcel and the customers address. It was a large enough distance to wonder if the driver had took the parcel on holiday!
Taking the data and summarising it revealed surprising results. It seems we had an untold story to tell.
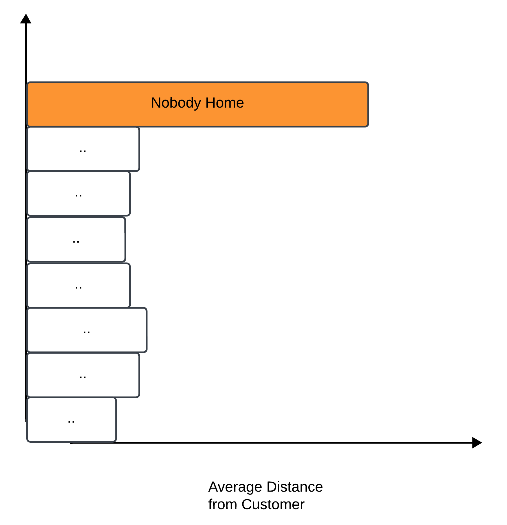
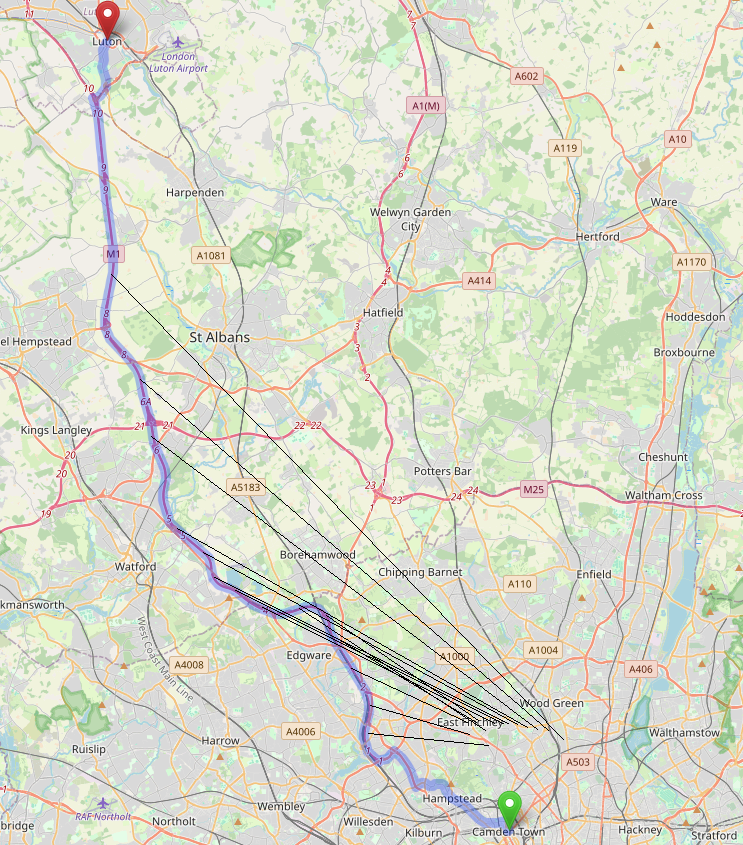
The distance between parcel scans and recipient locations in some cases appeared to be much larger than anticipated. This seemed like a great opportunity to take advantage of the geographical mapping capability. We took some of the driver journeys and mapped them against the recipient parcel scan locations. There were some surprising examples, here are mock ups of a few we found.
Driver scanning parcels driving on the motorway
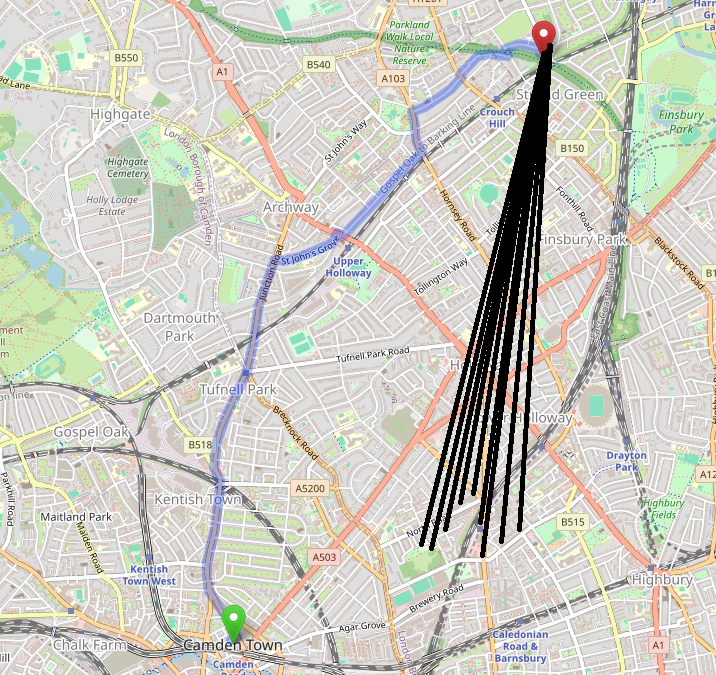
Driver scanning parcels in the pub car park
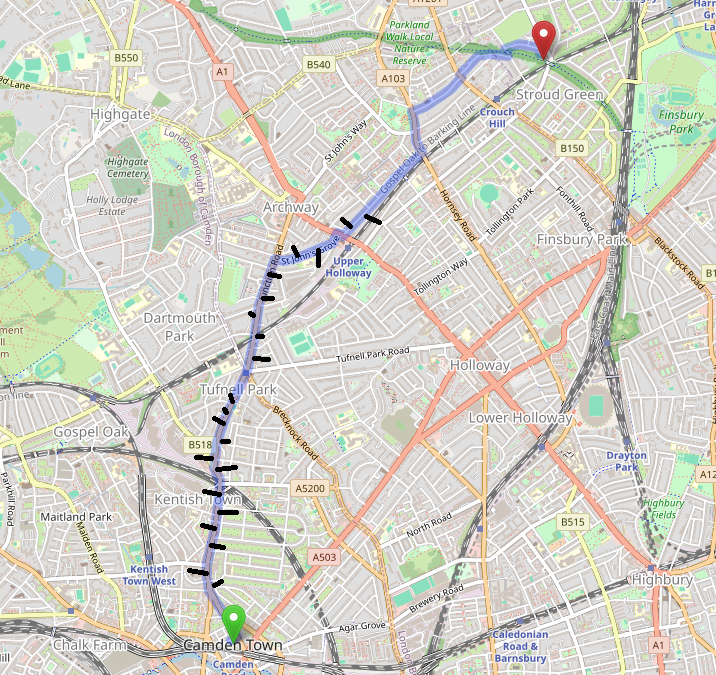
Driver delivering parcels as expected
Using this information we won over the hearts and minds of senior management. Presenting this information overlayed on a map brought the data to life in way that was not possible in table. Spatial reporting was not only embraced but was included in the 1-2-1 dashboard. The parcel delivery routes could be viewed on animated maps presenting the driver journey. This enabled managers to either playback the drivers journey at an increased speed or view the pattern of the journey instantly.
Final Thoughts
I hope these examples help to show how data storytelling can be used to drive positive change within an organisation. Its not just about making data available that is timely and accurate. We also need to do our part in guiding the audience through understanding the data.