So What's In the Oracle BI Apps Data Warehouse?
So before we start thinking about how we're going to extend and customize the Oracle BI Applications data warehouse (technically called the "Oracle Business Analytics Warehouse") it's probably worth having a think about what's in the warehouse in the first place. Now this isn't quite as easy as it seems as Oracle only grant access to the data model if you've got a license for the applications, which is sort of understandable as it's one of the main bits of IP that Oracle want to license you, but it does make things tricky if you want to evaluate what's in the data model to find out how much value it provides to you. One thing you can do though is take a look at what documentation is out there, and also reverse-engineer it a bit using the Oracle BI Administrator tool.
Looking at the packaging for the latest 7.9.5 release of the Oracle BI Applications, you can see that Oracle have merged a few of the previous licenses and products options and come up with the following new set of consolidated products.
First of all, the product options that apply to general ERP content:
- Oracle Financial Analytics Fusion Edition (includes the old General Ledger & Profitabily Analytics, Payables Analytics and Receivables Analytics)
- Oracle Supply Chain and Order Management Analytics Fusion Edition (includes the old Management Analytics, Order Fulfillment Analytics, Inventory Analytics)
- Oracle Procurement and Spend Analytics Fusion Edition (the old Produrement and Spend Analytics and Supplier Performance Analytics)
- Oracle Human Resources Analytics Fusion Edition (the old Human Resources Compensation Analytics and Human Resources Operations and Compliance Analytics)
These products generally have ERP routines already predefined for common ERP applications (Oracle E-Business Suite, SAP, Peoplesoft) and have been enhanced and extended a bit since Oracle took over Siebel.
There is then some horizontal (i.e. across industry) CRM content, which can of course be used with any ERP data but currently only has predefined extraction routines from the Siebel CRM application.
- Oracle Sales Analytics Fusion Edition (the old Sales Analytics and Usage Accelerator Analytics)
- Oracle Service Analytics Fusion Edition
- Oracle Contact Center Telephony Analytics Fusion Edition
- Oracle Marketing Analytics Fusion Edition (the old Marketing Analytics and Marketing Planning Analytics)
- Oracle Pricing Analytics
- Oracle Partner Analytics
There is also a bunch of industry-specific (vertical) CRM content again with predefined Siebel CRM extraction routines.
- Oracle Telecom Sales Analytics Fusion Edition
- Oracle Telecom Service Analytics Fusion Edition
- Oracle Telecom Marketing Analytics Fusion Edition
- Oracle Finance Sales Analytics Fusion Edition
- Oracle Finance Service Analytics Fusion Edition
- Oracle Finance Marketing Analytics Fusion Edition
- Oracle Finance Retail Analytics Fusion Edition
- Oracle Finance Institutional Analytics Fusion Edition
- Oracle Insurance Sales Analytics Fusion Edition
- Oracle Insurance Service Analytics Fuision Edition
- Oracle Insurance Marketing Analytics Fusion Edition
- Oracle Insurance Partner Manager Analytics Fusion Edition
- Oracle Pharma Sales Analytics Fusion Edition
- Oracle Pharma Marketing Analytics Fusion Edition
- Oracle Consumer Goods Trade Funds Analytics Fusion Edition
- Oracle Case Management Analytics Fusion Edition
plus a bunch of other industry-specific analytics (healthcare, automotive, oil gas and chemicals and so on) that have been discontinued and folded into the horizontal CRM applications.
Most of these products are licensed on a named user basis or based on the turnover of your organization, except the HR Analytics product that is licensed based on the number of employees at your organization. The minimum (as of FY09) number of named users is 25 which means that for small deployments you can potentially use OBISE1 as your BI Foundation layer, for deployments greater than 50 you can use OBIEE (both of these are charged on top of the BI Applications license). On top of this you'll need an OEM license for Informatica PowerCenter (Oracle can supply this) as all the extraction and load routines are (currently) written using this ETL tool.
So on the face of it there's a lot of content, focused at least now mostly on CRM (due to the Siebel heritage) but with a fair bit of financials, HR and order management content that supports general business activity.
Working with these subject areas are just over 450 separate dashboard pages (a page being a tab, so one dashboard might contain a number of pages) and a bunch of content in the Common Enterprise Information Model.
Taking a look at the Oracle BI Administration tool, you can see that the business model and mapping layer is actually made up of a set of different models. I've expanded one of them, Workforce Analytics, so you can see what's inside it.
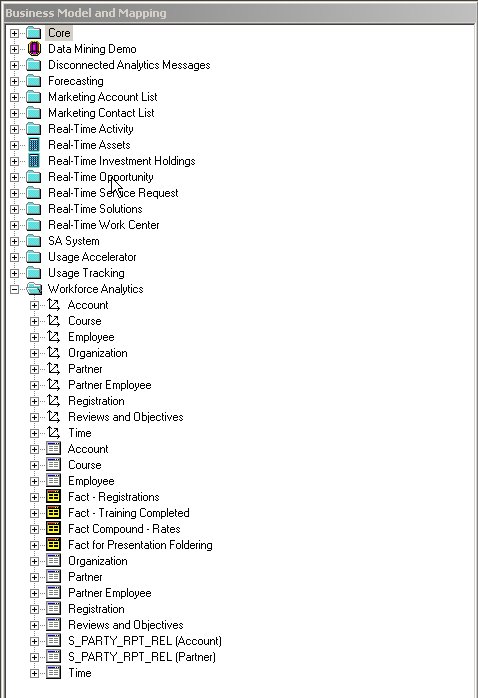
Now you can't really see it from the screenshot but there must be around 300 or so dimensions (as in drill paths and hierarchies) in the model, around 300 or so dimension tables and probably the same amount of fact tables, so even if you could get hold of the data model as a diagram and print it out, it's not going to be all that comprehensible.
So on the basis that you want to see the logical and physical data model for the warehouse, so that you can determine where you'll need to load data to support customizations, one approach that I use is to firstly, locate the report on the dashboard you're working with and then bring it up in Answers to look at how it's constructed, like this:
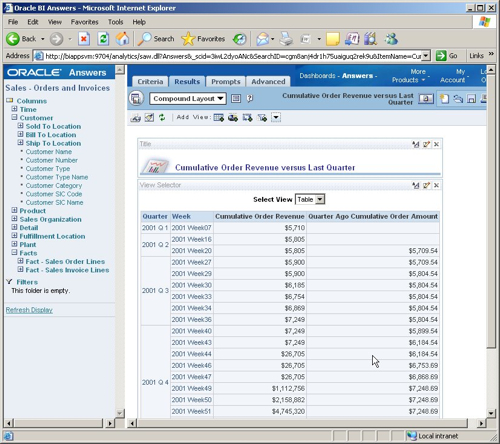
Looking at this report and in particular the subject area that it's based on, you can see that this subject area consists of two fact tables (Sales Order Lines and Sales Invoice Lines) and a bunch of dimension tables.
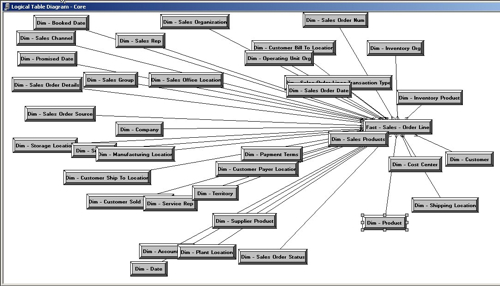
So now, if we go back to the Administration tool and build a business model diagram based on the Sales Order Lines fact table, you can see this logical model, which is a useful way of picturing the logical set of facts and dimensions within the subject area:
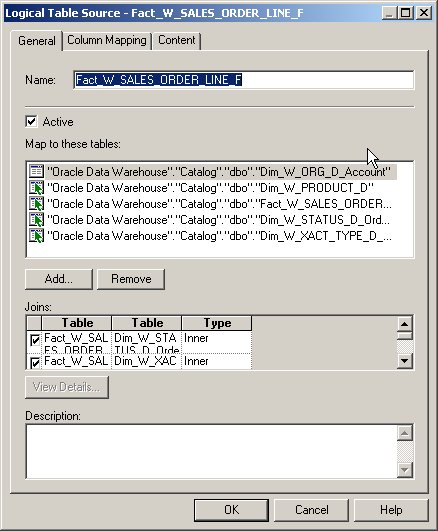
You can actually take this a step further and use the logical fact table to generate a diagram that shows the physical tables that are used to support it, but with a typical fact table the diagram gets very complex and muddled as there are so many other tables within the data warehouse that joins to it. A better way of visualizing what tables support, say, a dimension is to edit the logical table source for the logical dimension table and see what physical tables are mapped to it, like this:
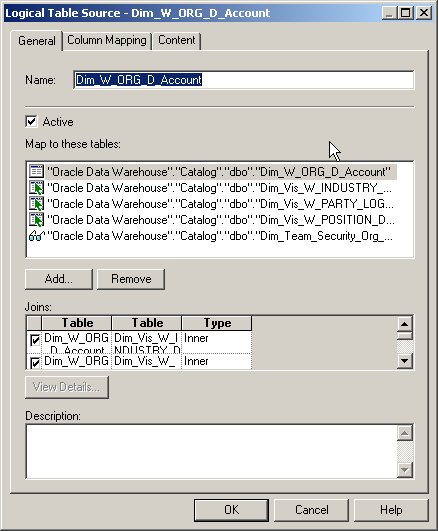
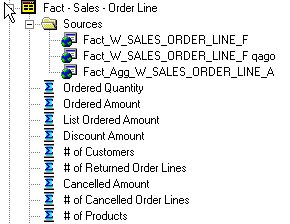
Working through the various logical fact tables and dimension tables within the metadata layer, this sort of approach is common, where multiple physical tables are joined together to provide the data for a single dimension table. Taking a look at the Order Lines fact table, you can initially see that it has three logical table sources, but two of them are for quarter ago and and order lines aggregated:
This joining brings up the point of course that there's considerable scope for performance optimization of a vanilla, out-of-the-box implementation of the BI Apps data warehouse. Indexing is provided by the load routine (though I don't think it covers bitmap indexes, bitmap join indexes and the like) and there's no automatic creation of materialized views, Oracle dimensions and so on, although as you'd see from the fact table logical table sources in the previous diagram but one, there is support for OBIEE-created aggregates. You could of course denormalize all of these fact table sources into a single table, or if you were particularly adventurous you could swap out the tables for an Oracle OLAP analytic workspace or even an Essbase cube. This is certainly an area I'll be looking at in future blog postings.
So now we know where to go to get our fact and dimension data, it's worth thinking about the other part of the equation, which is around the load process. Each set of facts and dimensions is supported by both Source-Independent Load (SIL) load routines that take staging data and load it into the reporting structures, and Source-Dependent Extract (SDE) routines, customized for each data source, to extract data and place it into the staging area ready for loading.
So, taking one of the fact table source (W_SALES_ORDER_LINE_F) and using the DAC Repository to show the Informatica mappings that are used to load it, you can see a key routine, SIL_SalesOrderLineFact that is used to load it.
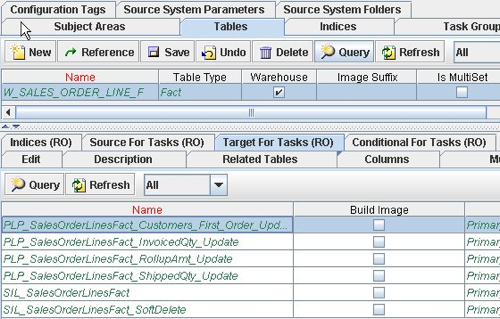
Then, you can focus in on this routine and see what tables it uses to load the fact table.
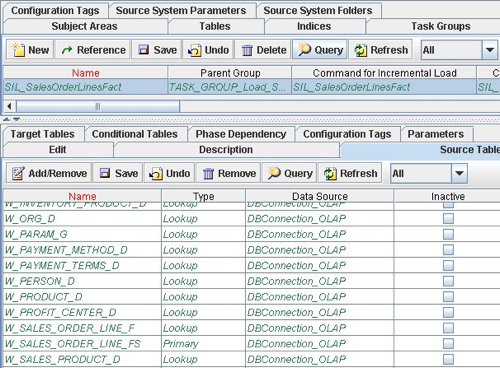
In this way you can trace the flow of data back and reconstruct what tables are used to hold your warehouse data, where the data came from and what routines you will need to customize to add new or amended data into the warehouse.
So, now we know at least where to look when working out what part of the data model holds our data, and we know how to identify which load routines need to be customized to add this data in, it's time to look at a few scenarios for loading in and customizing the data in the warehouse. Back in a few days.