TIMESTAMPS and Presentation Variables
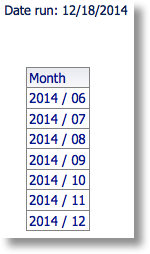
TIMESTAMPS and Presentation Variables can be some of the most useful tools a report creator can use to invent robust, repeatable reports while maximizing user flexibility. I intend to transform you into an expert with these functions and by the end of this page you will certainly be able to impress your peers and managers, you may even impress Angus MacGyver. In this example we will create a report that displays a year over year analysis for any rolling number of periods, by week or month, from any date in time, all determined by the user. This entire document will only use values from a date and revenue field.
The TIMESTAMP is an invaluable function that allows a user to define report limits based on a moving target. If the goal of your report is to display Month-to-Date, Year-to-Date, rolling month or truly any non-static period in time, the TIMESTAMP function will allow you to get there. Often users want to know what a report looked like at some previous point in time, to provide that level of flexibility TIMESTAMPS can be used in conjunction with Presentation Variables.
To create robust TIMESTAMP functions you will first need to understand how the TIMESTAMP works. Take the following example:
![]()
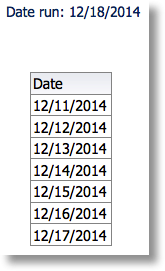
Here we are saying we want to include all dates greater than or equal to 7 days ago, or from the current date.
- The first argument, SQL_TSI_DAY, defines the TimeStamp Interval (TSI). This means that we will be working with days.
- The second argument determines how many of that interval we will be moving, in this case -7 days.
- The third argument defines the starting point in time, in this example, the current date.
So in the end we have created a functional filter making Date >= 1 week ago, using a TIMESTAMP that subtracts 7 days from today.
Note: it is always a good practice to include a second filter giving an upper limit like "Time"."Date" < CURRENT_DATE. Depending on the data that you are working with you might bring in items you don’t want or put unnecessary strain on the system.
We will now start to build this basic filter into something much more robust and flexible.
To start, when we subtracted 7 days in the filter above, let’s imagine that the goal of the filter was to always include dates >= the first of the month. In this scenario, we can use the DAYOFMONTH() function. This function will return the calendar day of any date. This is useful because we can subtract this amount to give us the first of the month from any date by simply subtracting it from that date and adding 1.
Our new filter would look like this:
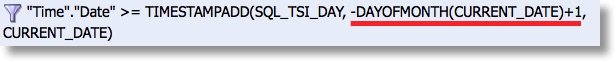
For example if today is December 18th, DAYOFMONTH(CURRENT_DATE) would equal 18. Thus, we would subtract 18 days from CURRENT_DATE, which is December 18th, and add 1, giving us December 1st.

(For a list of other similar functions like DAYOFYEAR, WEEKOFYEAR etc. click here.)
To make this even better, instead of using CURRENT_DATE you could use a prompted value with the use of a Presentation Variable (for more on Presentation Variables, click here). If we call this presentation variable pDate, for prompted date, our filter now looks like this:
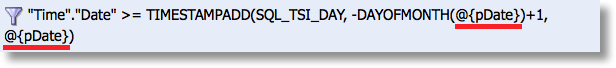
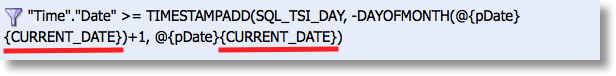
A best practice is to use default values with your presentation variables so you can run the queries you are working on from within your analysis. To add a default value all you do is add the value within braces at the end of your variable. We will use CURRENT_DATE as our default, @{pDate}{CURRENT_DATE}. Will will refer to this filter later as Filter 1.
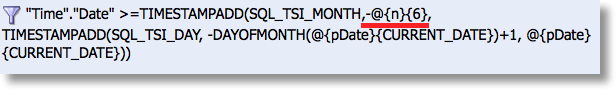
{Filter 1}:
As you can see, the filter is starting to take shape. Now lets say we are going to always be looking at a date range of the most recent completed 6 months. All we would need to do is create a nested TIMESTAMP function. To do this, we will “wrap” our current TIMESTAMP with another that will subtract 6 months. It will look like this:
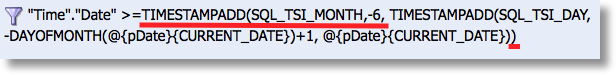
Now we have a filter that is greater than or equal to the first day of the month of any given date (default of today) 6 months ago.
To take this one step further, you can even allow the users to determine the amount of months to include in this analysis by making the value of 6 a presentation variable, we will call it “n” with a default of 6, @{n}{6}. We will refer to the following filter as Filter 2:
{Filter 2}:
For more on how to create a prompt with a range of values by altering a current column, like we want to do to allow users to select a value for n, click here.
Our TIMESTAMP function is now fairly robust and will give us any date greater than or equal to the first day of the month from n months ago from any given date. Now we will see what we just created in action by creating date ranges to allow for a Year over Year analysis for any number of months.
Consider the following filter set:
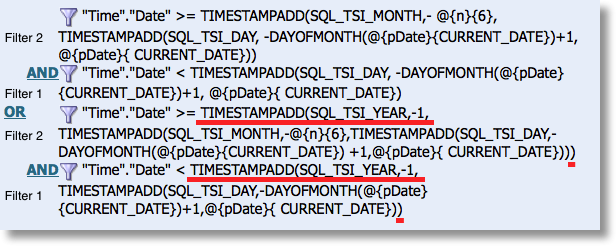
This appears to be pretty intimidating but if we break it into parts we can start to understand its purpose.
Notice we are using the exact same filters from before (Filter 1 and Filter 2). What we have done here is filtered on two time periods, separated by the OR statement.
The first date range defines the period as being the most recent complete n months from any given prompted date value, using a presentation variable with a default of today, which we created above.
The second time period, after the OR statement, is the exact same as the first only it has been wrapped in another TIMESTAMP function subtracting 1 year, giving you the exact same time frame for the year prior.

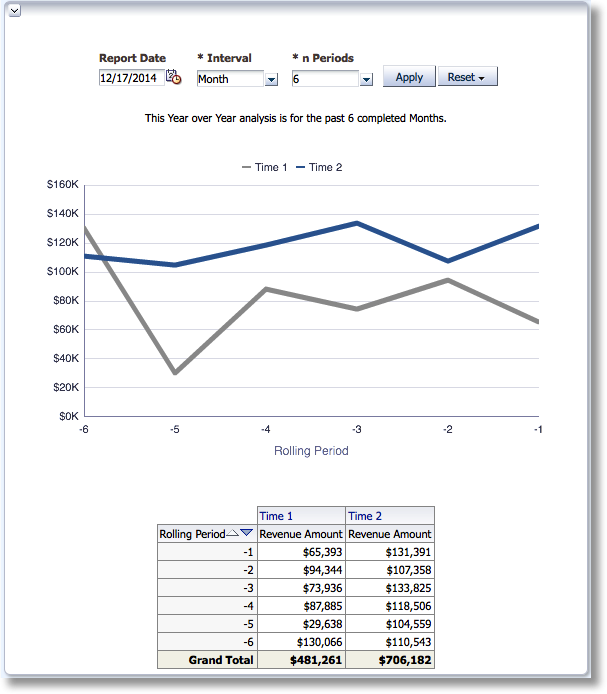
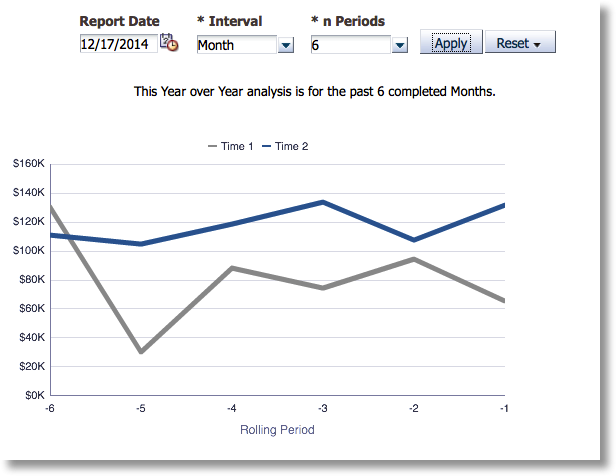
This allows us to create a report that can run a year over year analysis for a rolling n month time frame determined by the user.
A note on nested TIMESTAMPS:
You will always want to create nested TIMESTAMPS with the smallest interval first. Due to syntax, this will always be the furthest to the right. Then you will wrap intervals as necessary. In this case our smallest increment is day, wrapped by month, wrapped by year.
Now we will start with some more advanced tricks:
- Instead of using CURRENT_DATE as your default value, use yesterday since most data are only as current as yesterday. If you use real time or near real time reporting, using CURRENT_DATE may be how you want to proceed. Using yesterday will be valuable especially when pulling reports on the first day of the month or year, you generally want the entire previous time period rather than the empty beginning of a new one. So, to implement, wherever you have @{pDate}{CURRENT_DATE} replace it with @{pDate}{TIMESTAMPADD(SQL_TSI_DAY,-1,CURRENT_DATE)}
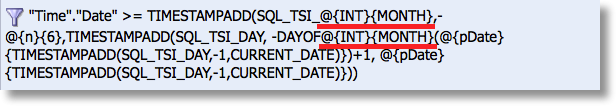
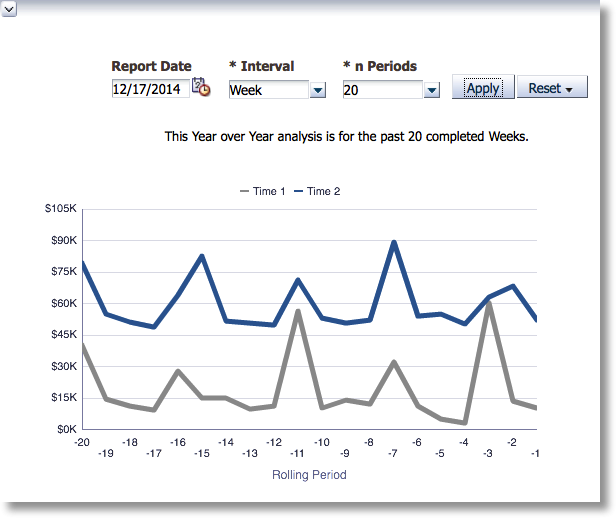
- Presentation Variables can also be used to determine if you want to display year over year values by month or by week by inserting a variable into your SQL_TSI_MONTH and DAYOFMONTH statements. Changing MONTH to a presentation variable, SQL_TSI_@{INT}{MONTH} and DAYOF@{INT}{MONTH}, where INT is the name of our variable. This will require you to create a dummy variable in your prompt to allow users to select either MONTH or WEEK. You can try something like this: CASE MOD(DAY("Time"."Date"),2) WHEN 0 'WEEK' WHEN 1 THEN 'MONTH' END


In order for our interaction between Month and Week to run smoothly we have to make one more consideration. If we are to take the date December 1st, 2014 and subtract one year we get December 1st, 2013, however, if we take the first day of this week, Sunday December 14, 2014 and subtract one year we get Saturday December 14, 2014. In our analysis this will cause an extra partial week to show up for prior years. To get around this we will add a case statement determining if '@{INT}{MONTH}' = 'Week' THEN subtract 52 weeks from the first of the week ELSE subtract 1 year from the first of the month.
Our final filter set will look like this:
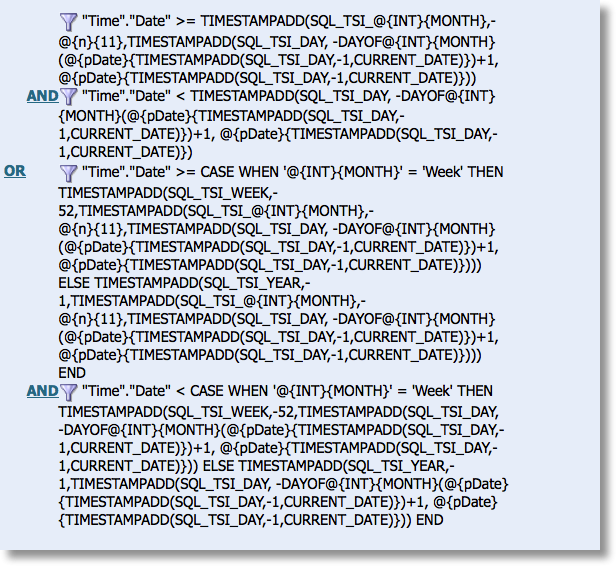
With the use of these filters and some creative dashboarding you can end up with a report that easily allows you to view a year over year analysis from any date in time for any number of periods either by month or by week.
That really got out of hand in a hurry! Surely, this will impress someone at your work, or even Angus MacGyver, if for nothing less than he or she won’t understand it, but hopefully, now you do!
Also, a colleague of mine Spencer McGhin just wrote a similar article on year over year analyses using a different approach. Feel free to review and consider your options.
Calendar Date/Time Functions
These are functions you can use within OBIEE and within TIMESTAMPS to extract the information you need.
- Current_Date
- Current_Time
- Current_TimeStamp
- Day_Of_Quarter
- DayName
- DayOfMonth
- DayOfWeek
- DayOfYear
- Hour
- Minute
- Month
- Month_Of_Quarter
- MonthName
- Now
- Quarter_Of_Year
- Second
- TimestampAdd
- TimestampDiff
- Week_Of_Quarter
- Week_Of_Year
- Year
Presentation Variables
The only way you can create variables within the presentation side of OBIEE is with the use of presentation variables. They can only be defined by a report prompt. Any value selected by the prompt will then be sent to any references of that filter throughout the dashboard page.
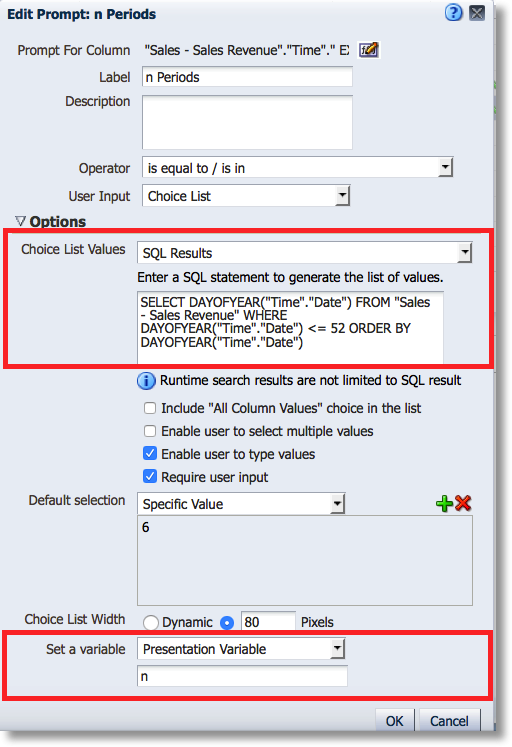
In the prompt:

From the “Set a variable” dropdown, select “Presentation Variable”. In the textbox below the dropdown, name your variable (named “n” above).
When calling this variable in your report, use the syntax @{n}{default}
If your variable is a string make sure to surround the variable in single quotes: ‘@{CustomerName]{default}’
Also, when using your variable in your report, it is good practice to assign a default value so that you can work with your report before publishing it to a dashboard. For variable n, if we want a default of 6 it would look like this @{n}{6}
Presentation variables can be called in filters, formulas and even text boxes.
Dummy Column Prompt
For situations where you would like users to select a numerical value for a presentation variable, like we do with @{n}{6} above, you can convert something like a date field into values up to 365 by using the function DAYOFYEAR("Time"."Date").
As you can see we are returning the SQL Choice List Values of DAYOFYEAR("Time"."Date") <= 52. Make sure to include an ORDER BY statement to ensure your values are well sorted.