Connecting Oracle Data Visualization Desktop to OBIEE


Recently at Rittman Mead we have been asked a lot of questions surrounding Oracle’s new Data Visualization Desktop tool and how it integrates with OBIEE. Rather than referring people to the Oracle docs on DVD, I decided to share with you my experience connecting to an OBIEE 12c instance and take you through some of the things I learned through the process.
In a previous blog, I went though database connections with Data Visualization Desktop and how to create reports using data pulled directly from the database. Connecting to DVD to OBIEE is largely the same process, but allows the user to pull in data at pre-existing report level. I decided to use our 12c ChitChat demo server as the OBIEE source and created some sample reports in answers to test out with DVD.
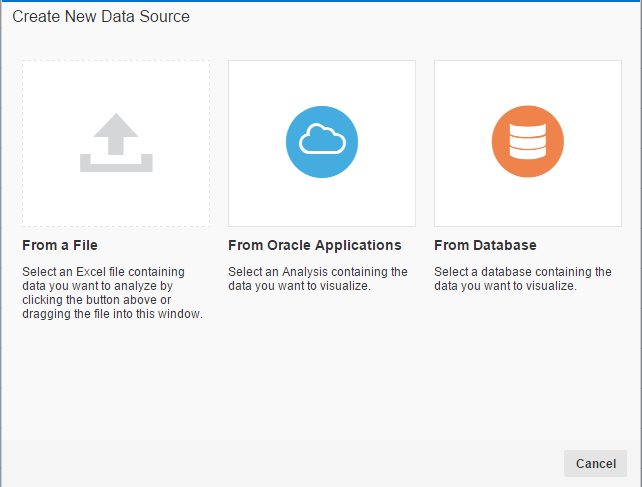
From the DVD Data Sources page, clicking "Create New Data Source" brings up a selection pane with the option to select “From Oracle Applications.”
Clicking this option brings up a connection screen with options to enter a connection name, URL (location of the reports you want to pull in as a source), username, and password respectively. This seems like a pretty straightforward process. Reading the Oracle docs on connectivity to OBIEE with DVD say to navigate to the web catalog, select the folder containing the analysis you want to use as a source, and then copy and paste the URL from your browser into the URL connection in DVD. However, using this method will cause the connection to fail.
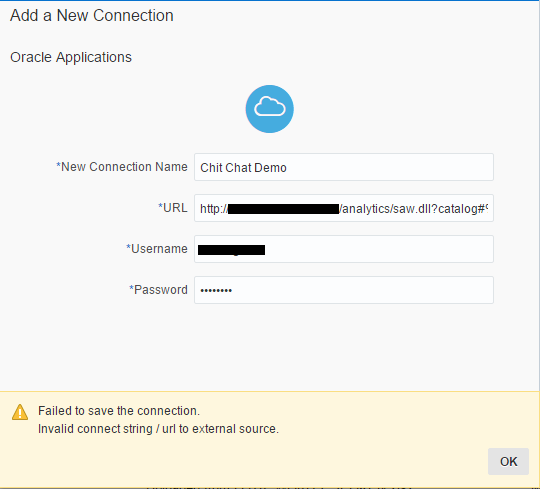
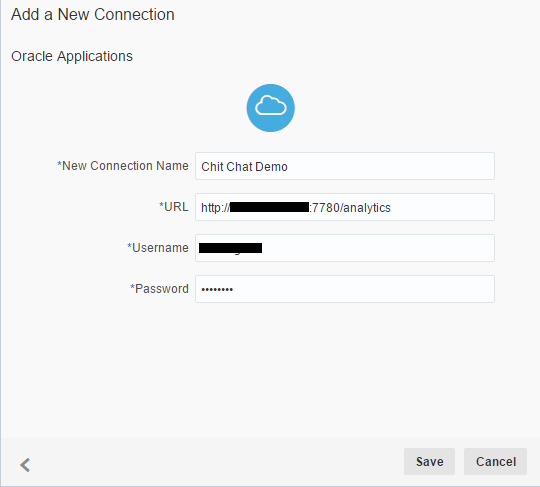
To get Data Visualization Desktop to connect properly, you have to use the URL that you would normally use to log into OBIEE analytics with the proper username and password.
Once connected, the web catalog folders are displayed.
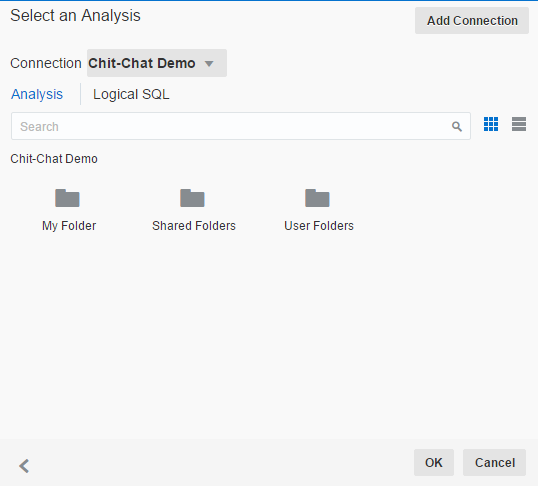
From here, you can navigate to the analyses you want to use for data sources.
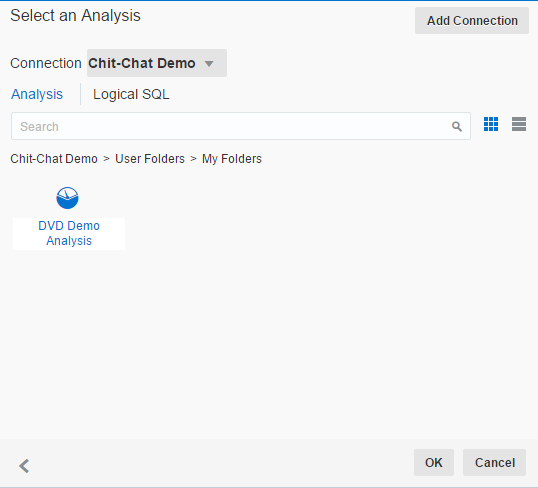
Selecting the analysis you want to use as your data source is the same process as selecting schemas and tables from a database source. Once the selection is made, a new screen is displayed with all of the tables and columns that were used for the analysis within OBIEE.
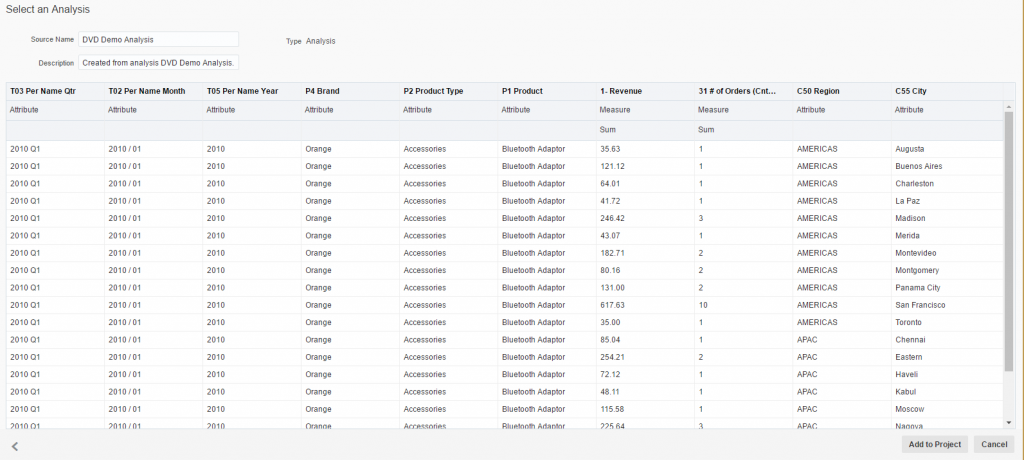
From here you can specify each column as an attribute or measure column and change the aggregation for your measures to something other than what was imported with the analysis.
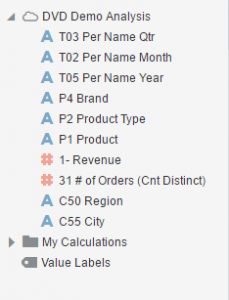
Clicking "Add to Project" loads all the data into DVD under Data Elements and is displayed on the right hand side just like subject area contents in OBIEE.
The objective of pulling data in from existing analyses is described by Oracle as revisualization. Keep in mind that Data Visualization Desktop is meant to be a discovery tool and not so much a day-to-day report generator.
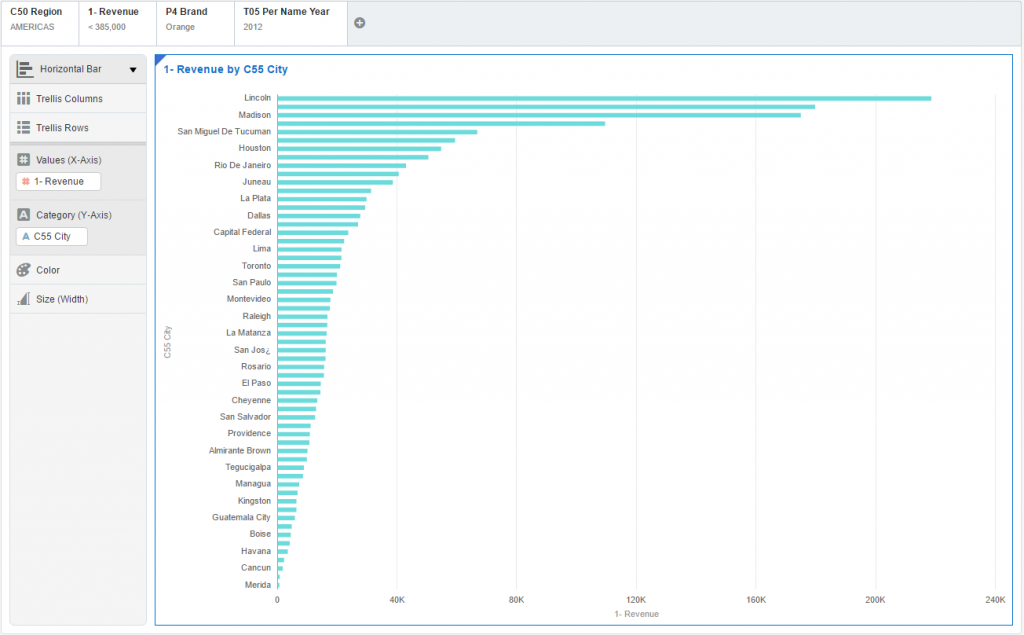
The original report was a pivot table with Revenue and Order information for geographical, product and time series dimensions. Let’s say that I just wanted to look at the revenue for all cities located in the Americas by a specific brand for the year 2012.
Dragging in the appropriate columns and adding filters took seconds and the data loaded almost instantaneously. I changed the view to horizontal bar and added a desc sort to Revenue and this was my result:
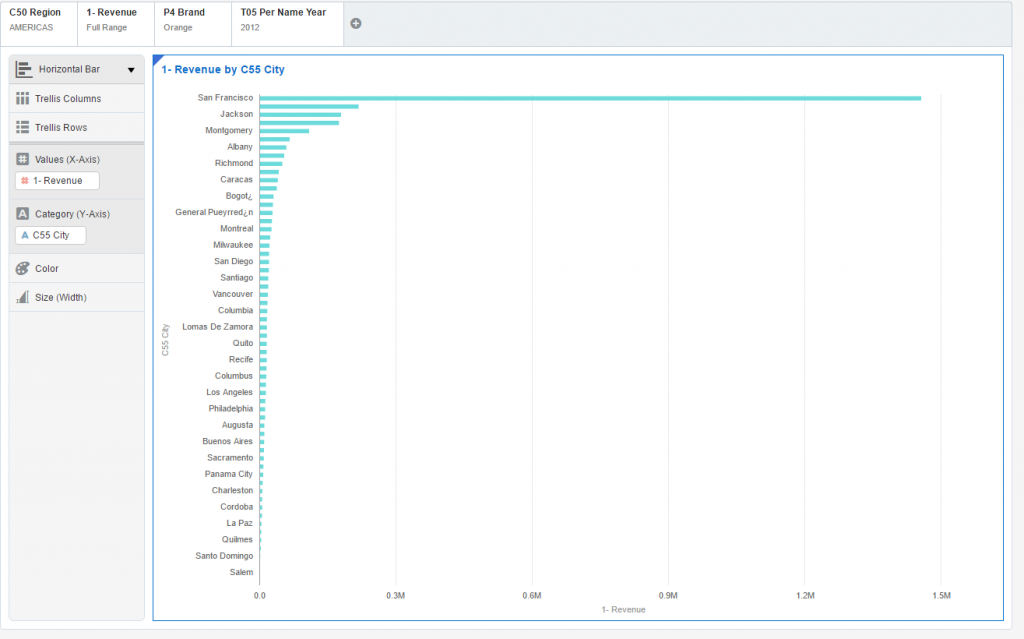
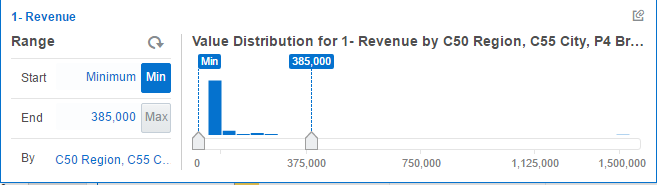
Notice how the revenue for San Fransisco is much higher than any of the other states. Let’s say I want to get a closer look at all the other states without seeing the revenue data for San Fransisco. I could create a new filter for City and exclude San Fransisco from the list or I could just create a filter range for Revenue. Choosing the latter gave me the option of moving a slider to change my revenue value distribution and showed me the results in real time. Pretty cool, right?
Taking one report and loading it in can open up a wide range of data discovery opportunities but what if there are multiple reports I want to pull data from? You can do this and combine the data together in DVD as long as the two reports contain columns to join the two together.
Going back to my OBIEE connection, there are two reports I created on the demo server that both contain customer data.
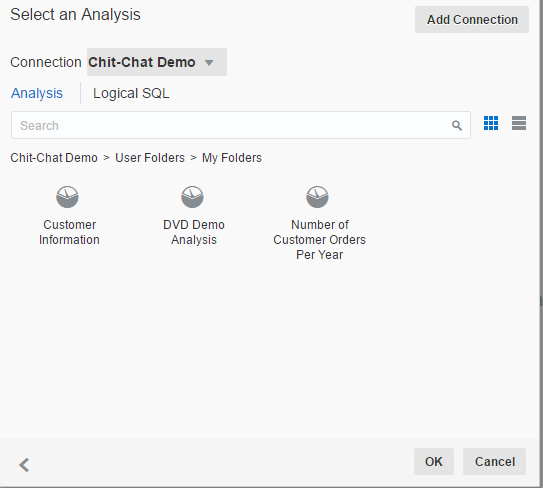
By pulling in both the Customer Information and Number of Customer Orders Per Year report, Data Visualization Desktop creates two separate data sources which show up under Data Elements.
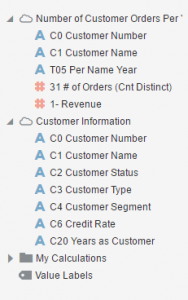
Inspecting one of the data sources shows the match between the two is made on both Customer Number and Customer Name columns.
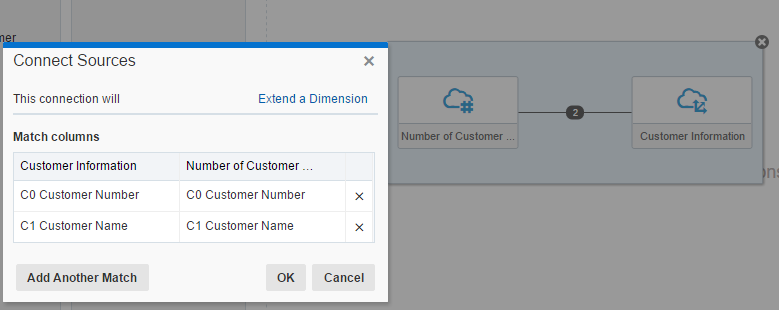
Note: It is possible to make your own column matches manually using the Add Another Match feature.
By using two data sets from two different reports, you can blend the data together to discover trends, show outliers and view the data together without touching the database or having to create new reports within OBIEE.
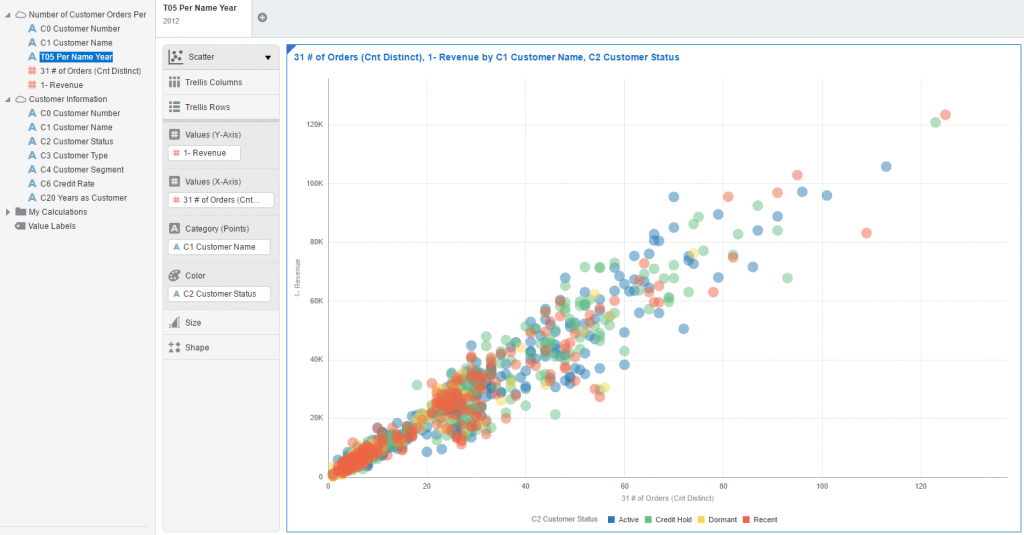
The ability to connect directly to OBIEE with Data Visualization Desktop and pull in data from individual analyses is a very powerful feature that makes DVD’s that much greater. Combining data from multiple analyses blend them together internally creates some exciting data discovery possibilities for users with existing OBIEE implementations.