OBIEE 12.2.1.1.0 - New Feature Guide


Oracle has recently released version 12.2.1.1.0 for OBIEE 12c, which has a variety of exciting new features for Data Visualization, BI Publisher, Dashboards in OBIEE, and ODBC connections. It can be performed as an in-place upgrade (performed by the Upgrade Assistant) or as a fresh install. The upgrade process is explained at length here. There is also an example Linux in-place upgrade from 12.2.1.0 to 12.2.1.1 which can be found here. Let's take an in-depth look at some of the new features.
Data Visualization (aka Visual Analyzer)
A variety of features have been added to Data Visualization, which brings it closer to its standalone counterpart, Data Visualization Desktop.
Visualize Data from Oracle Applications
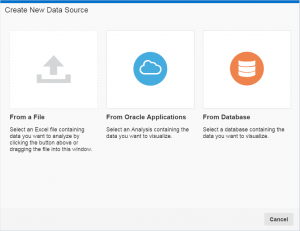
One of the most powerful exploratory features of Data Visualization Desktop is the ability to use your OBIEE analyses as direct datasources. This allows user to "revisualize" and explore the data contained within one or more analyses in different ways. Oracle has added this same feature in data visualization. To access this feature from the DV Home Page, click on Data Sources > Create New Data Source.
You are then presented with three choices: From a File, From Oracle Applications or From Database (more on this later).
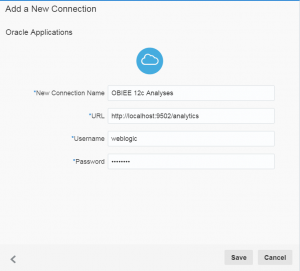
Selecting From Oracle Applications opens a new window where you enter your connection information.
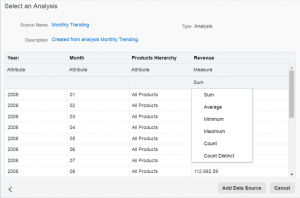
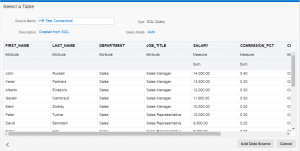
Once you enter the connection information, you are able to view all of the folders you have access to within the OBIEE catalog. Selecting an analysis and clicking ok brings you to another screen where you can specify between measures and attributes for your columns and change the specified aggregation for your measure columns.
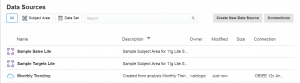
Clicking Add Data Source adds the analyses to the Data Source page
.
Visualize Data from Databases
Another feature added to DV is the ability to connect directly to a database. It allows you to add tables directly from a database schema or write a SQL statement to select the data you want.
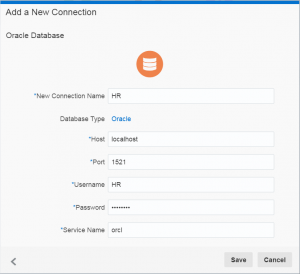
To connect to a database as a data source, select Data Sources from the Home Page then Create New Data Source > From Database. This brings up a connection window to enter your connection details.
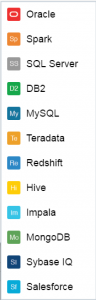
From here, you can also select from a large selection of database types other than the default Oracle Type. Clicking on Oracle brings up the list which matches the selections available in the latest release of Data Visualization Desktop.
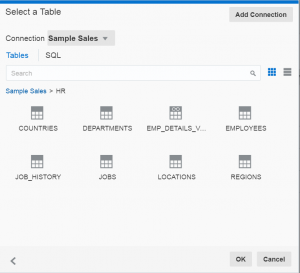
Choosing to add tables from a database schema allows you to add data sources, one table at a time.
In some situations, you might want to create one datasource selection from a database from multiple tables. You can achieve this by clicking on the SQL tab after making your database connection and writing a custom sql statement.
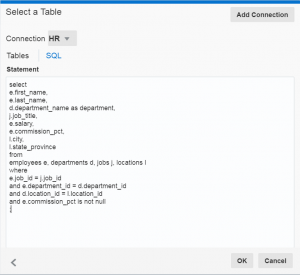
Clicking OK brings you to a results screen with all of the columns previously defined in your sql statement and also give you the ability to rename your datasource and to change the aggregation type for your measure columns.
Modifying Uploaded Data Sources
Also known as "Data Wrangling", Oracle has added the ability to manipulate a dataset depending on the column data type. By invoking a logical SQL function, Data Visualization does the work for you and can create a new column or edit an existing one. To show an example of this, I created a new VA Project and uploaded a sample Excel file.
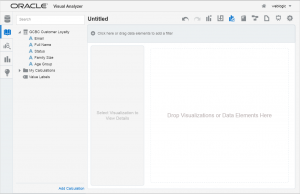
In the top left menu bar, there is an option called Stage. Clicking on it opens the datasource and shows all of the columns present and the first 100 records.
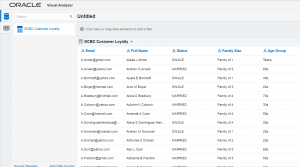
Note: If you have more than one file, clicking on the name of the file in the top left will reveal a dropdown menu where you can choose between them.
To edit or add a column, navigate to the right of the column you wish to edit and click on the options icon ![]() .
.
This brings up the options menu where you can select from a variety of different options for editing or adding column depending on the datatype.
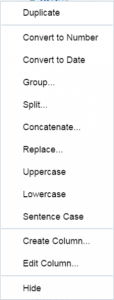
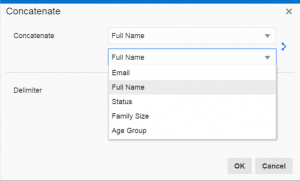
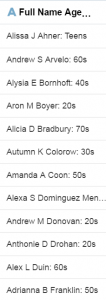
Using the Concatenate function, I was able to create a new column that showed the full name of each customer combined with data in the Age Group column separated by a colon.
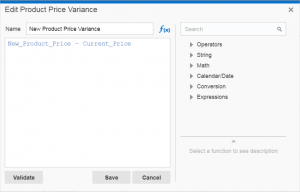
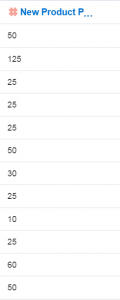
If you chose to create a new column, a Create New Data Element window opens allowing you to input logical SQL functions similar to the edit column formula feature in OBIEE Analytics.
New and Enhanced Visualization Types
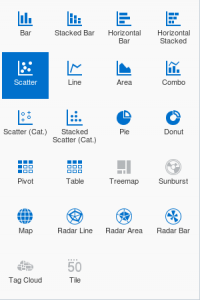
DV now includes new visualizations including donut charts, text boxes, sunburst, combo, scatter (cat.) and stacked scatter (cat.), which brings it in line with the offerings from Data Visualization Desktop.
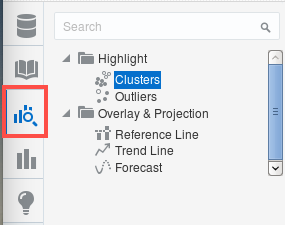
Also included (assuming you have installed and configured Oracle's R distribution) is the ability to add clusters, outliers, reference lines, trend lines and forecast. There are two ways to add these to your visualizations. The first is by selecting the Analytics option in the horizontal menu bar on the far right side and then choose the desired function. Double clicking on a function automatically adds it to your visualization.
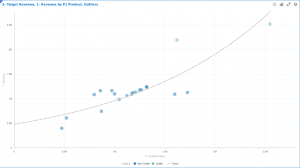
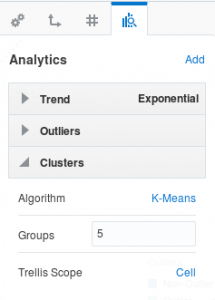
Another option is to add them directly from Menu > Properties > Analytics within your visualization. You can add analytic functions and, depending on the function, there are a variety of different options to change how the function is displayed.
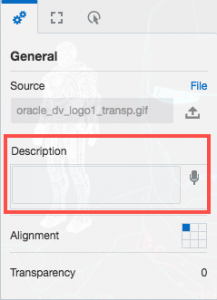
You can also add URLs or links to insights within Tiles, Text Boxes and Image visualizations and, if you use Chrome for Windows or Android, there is a dictation option within properties that you can use to add descriptions.
Customize Color Schemes
One of the more frustrating absences from DV up to this point was the ability to customize colors in your visualizations. Oracle has not only added this feature but given you the ability to customize and save these customizations, making color conformance for a group of users or across an entire organization a breeze.
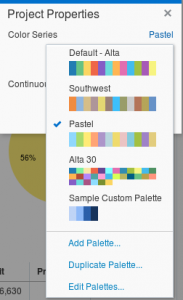
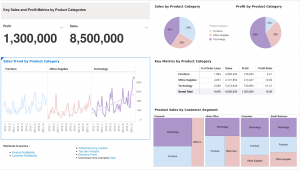
Let's start by looking at an example of applying color to an entire project. To access the project color properties, click on Canvas Settings > Project Properties. By clicking on the color selection in the Color Series section, you can choose from one of four default selections or create your own custom palette.
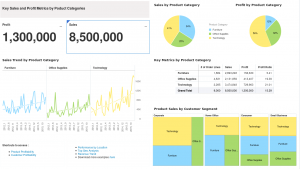
Notice how each measure is assigned a color and that color is continuous across the entire project.
You can also manage colors from inside of an individual visualization. To do this, click on Menu > Color > Manage Color Assignments. From here you can assign colors to each measure individually and it is then displayed across the entire project.
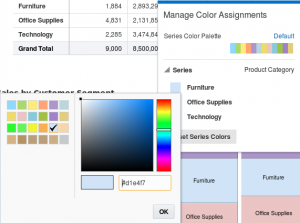
Another option is to change a color by right clicking on an individual data point.
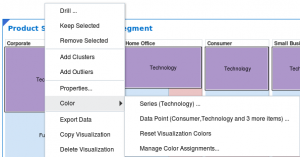
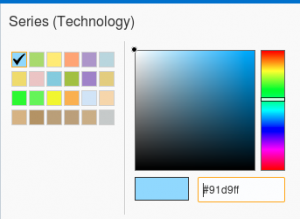
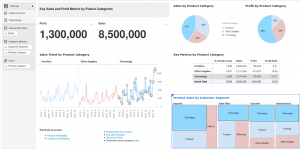
In this example, I right clicked on Technology and changed its color which then changed it for every visualization in the project.
Data Blending
Oracle added the ability to specify which data source takes precedence over the other when blending two data sources together. This can be very useful when you have a project that includes data from two data sources and there are match values in one data source that are not in the second. Let's look at an example.
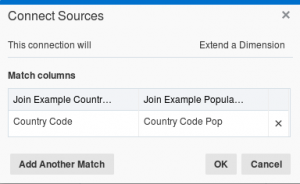
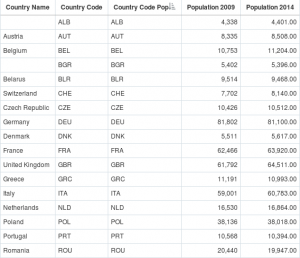
I have two data sources. One contains population information and one contains country name and they are matched on the country codes.
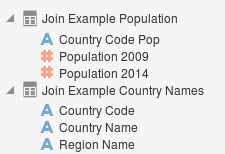
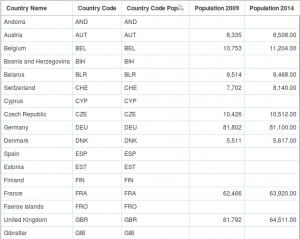
Notice in the example that there are countries that have no population facts and and population facts that have no countries.
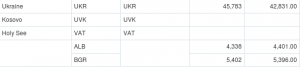
So that we can see only the countries which have population information, click on one of the columns in the report, right click and select Properties > Data Sets. Here you are presented with an option for each source: All Rows or Matching Rows.
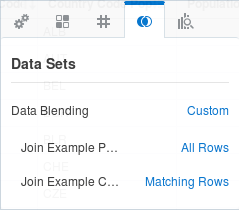
Changing the source that contains country information to Matching Rows will keep only the countries that have corresponding population information.
Share Reports as Read-Only
It is now possible to share a report with other users as read-only. They will still be able to interact and edit filters, but won't be able to see the authoring content controls. They are also able to go back an forth between presentation mode.
Other Features
Two other features for DV introduced in 12.2.1.1 is the ability to upload data files up to 50mb in size. Also you can hide the filter panel from view to increase canvas space for your projects.
BI Publisher
Oracle has also updated BI Publisher 12c to version 12.2.1.1. You can see the official document here.
Deliver documents to Oracle Document Cloud Service
You are now able to deliver BI Publisher reports to the Oracle Documents Cloud service via a delivery channel in BI Publisher. You can deliver reports to cloud storage from both on-premise or a cloud deployment of BI Publisher.
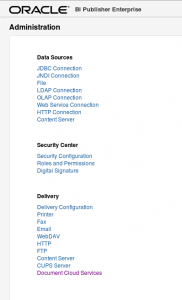
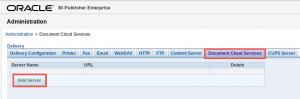
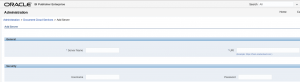
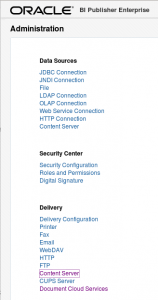
You can set up this feature under Administration > Delivery > Document Cloud Services within BI Publisher 12.2.1.1.
Here, under the Document Cloud Services tab, you can add the connection details to your cloud server.
Use WebCenter Content as a Data Source
You can now read text data files from WebCenter Content. You can create a Content Server data source under Administration > Delivery > Content Server
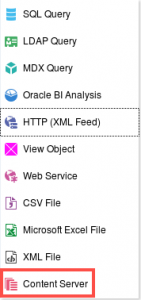
After you create your Content Server as a data source, you can create Content Server as a dataset in a BI Publisher data model and retrieve text data files stored in Web Center Content by Document ID.
Attach PDF to Your Invoices
You can now send PDF attachments along with invoices with BI Publisher 12.2.1.1. You can attach PDFs along with the invoice while bursting. The process is explained in more detail in the BI Publisher 12.2.1.1 documents here.
Integrate Using RESTful APIs
BI Publisher 12.2.1.1 introduces a set of REST APIs that allow you to view reports in an application. It connects to the BI Publisher Server through a URL and uses JSON objects to contain data. You can read more about RESTful APIs in BI Publisher in the BI Publisher 12.2.1.1 new features guide here.
Deliver Email Body in HTML Format along with Report as Attachment
You can use standard HTML4 formatting tags to create the email body, include a logo or images, add hyperlinks and more. Reports will be generated as attachments to the email.
Manage Custom Fonts
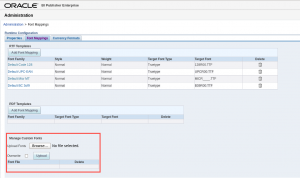
In BI Publisher 12.2.1.1, you can manage custom fonts from the Administration page, and once uploaded, these custom fonts can be displayed in reports.
Manage PGP Keys for FTP Delivery Encryption
In BI Publisher 12.2.1.1, Administrators can upload and manage PGP Keys from the Administration page. FTP delivery encryption is now a self-service feature. More details can be found in the BI Publisher 12.2.1.1 documents.
Dynamic Memory Guard
You can now separately configure limits for online and offline reports. The limits can be made dynamic by using variables, system defined functions and operators and, when the data changes, the dynamic memory guard will adjust.
You can access the Memory Guard in the Administration page under Runtime Configuration > Properties.
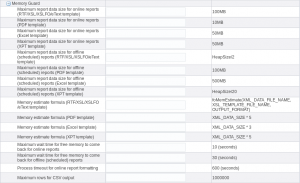
More information can be found in the BI Publisher 12.2.1.1 documents.
Enabling Encryption for File Data Security on Cloud
You can now enable File Data Encryption in the Administration page and your data files with be encrypted at the time of uploading them on the server.
OBIEE Dashboard Subpages
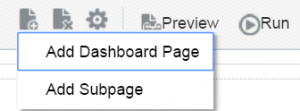
A new feature for OBIEE 12.2.1.1 is the ability to add subpages within dashboards. This feature will allow dashboard designers to create multiple subpages for each dashboard page. To add a subpage, click on the desired dashboard page and click the "Add Dashboard Page" icon and select "Add Subpage."
The Add Subpage window will then be displayed where you can name your subpage and add a description.
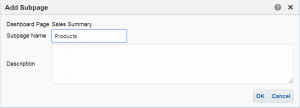
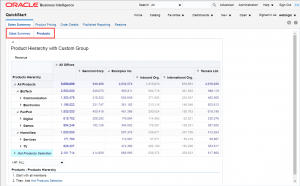
Once you click OK, the subpage will be added to the dashboard page and adding content to the subpage is the exact same process as adding content to a dashboard page.
RPD - Enable Data Driven Fragment Selection
A new feature for RPD developers is the ability to improve the performance of fragmented logical table sources by using the Enable Data Driven Fragment Selection feature. More information on how to enable this feature can be found in the 12.2.1.1 documents here.
Additional Data Sources Supported
New data sources are supported for 12.2.1.1 using DataDirect 7.1.5. These include Amazon RedShift, Oracle Service Cloud, Greenplum, Salesforce, and Teradata. Connections to Apache Spark and MongoDB are also available using 8.0.
Conclusion
All in all, the 12.2.1.1 update for OBIEE 12c adds some very powerful features. Data Visualization is now a very complete product and it's new features and native connectors make it a powerful addition to the new era of data visualization. For Oracle Cloud users, the integration for BI Publisher and Data Visualization makes the "report and share" process easier than ever.