Analysing Social Media Data for the Lightyear Foundation - Part 2

In my last post, I described the basics around connecting to social media data sources using Python. This is in aid of collating information for the Lightyear Foundation, a charity specialising in science education in the UK and Ghana. In this blog, I will demonstrate how to use those integrations to record data into a PostgreSQL database. I've chosen this database in so as to keep everything free and open source.
One of the downsides with some of the publicly available APIs is that they only store a certain amount of history. These makes analysing long term trends a bit more difficult. By recording the data periodically, in an ETL-like fashion, we can circumvent this. Given the vast amount of data available for social media it would not be appropriate to store all of the data in a relational database. Instead, we can store summary statistics for long term trend analysis.
All of the code used in this blog is on this public Git repository. You are welcome to download this and poke around as you follow the blog. Note that there is configuration in config.ini and a keys/google-api.json file required in order to get these working yourself.
Database Integration
The Python module psycopg2 was used to execute transactions against the PostgreSQL database with Python. The script lyf/psql.sql contains a host of functions I wrote to perform useful database and ETL actions.
psql.truncate: Truncates a table.psql.insert: Inserts a single row to a table.psql.upsert: Updates a row to a table if a matching key is found, else inserts the row.psql.update: Updates values in a table based on matching keys.psql.delete: Deletes rows from a table based on aWHEREclause.psql.lookup: Updates columns based on a lookup to another table. Useful for assigning foreign keys from natural keys.psql.load_csv: Loads data from a CSV file into a table, mapping header names in the file to columns in the table.psql.query: Executes a SQL statement and returns the data.
Google Analytics
For Google Analytics (GA), there is availability of many dimensions and metrics but I have chosen merely a useful subset to put into a star schema.
Dimensions
For efficiency, I wrote a method to dynamically load dimension tables from a tsv file.
table	ga_dims	columns	keys
d_ga_source	"ga:sourceMedium,ga:source,ga:medium,ga:socialNetwork"	"source_medium,source,medium,social_network"	"source_medium"
d_ga_platform	"ga:operatingSystem,ga:deviceCategory,ga:operatingSystemVersion"	"os,device_category,os_version"	"os,device_category,os_version"
d_ga_geo	"ga:continent,ga:subContinent,ga:country,ga:countryIsoCode,ga:region,ga:cityId,ga:city"	"continent,sub_continent,country,country_code,region,city_id,city"	"city_id"
d_ga_page	"ga:pageTitle"	"page_title"	"page_title"
The column table refers to the table name in the PostgreSQL schema, which are created manually before executing the script. ga_dims is a comma separated list of GA dimension codes. Note that this is an upper limit of 7 dimensions allowed for a GA API query. columns is another list of equal length describing the mapping to the columns in the database table. Finally keys is a comma separated list of which columns are unique natural keys for the database table. This is so the script can perform updates as well as inserts.
This input file is parsed by load_ga_dims.py which executes a Google API query for each dimension and upserts the records into the database. Essentially, the ETL for this process is defined quite simply by the TSV file and can be changed with relative ease. It doesn't have the scope, flexibility or scale as ODI or Informatica, but for a quick, free version it will suffice.
Fact
The fact table is much simpler to load as we just need to execute a single GA query which specifies only the dimension natural keys and the metrics. The script load_ga_fact.py will go and fetch the dimension warehouse key (always integer) as well as any metrics specified in the file. I've opted for:
- Sessions
- Bounces
- Bounce Rate
- Average Session Duration
- Session Duration
- Page Views
- Time on Page
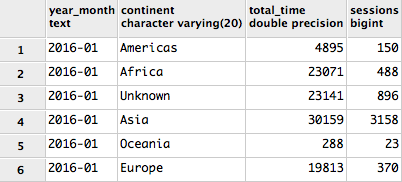
Finally there is an integer date ID and some denormalised attributes: Longitude and Latitude. With Google its easy to retrieve a "full load" as the API allows querying of history as well as incremental loads which filtered for today's date. Below is an example query returning the total session time and number of sessions by continent for Jan 2016:
select
	dt.year_month,
	geo.continent,
	sum(session_duration) as total_time,
	sum(ga.sessions) as sessions
from
	f_ga_daily ga
	inner join d_ga_geo geo on geo.geo_id = ga.geo_id
	inner join d_date dt on dt.date_id = ga.date_id
where dt.yyyymm = 201601
group by dt.year_month, geo.continent
order by dt.year_month;
The extract I wrote for Facebook was much simpler, using date as the sole dimension. If required, dimension tables could be created for posts and videos or other similar data, but in this case we just want to look at trends over time. The measures selected are:
- Total Likes
- Total Posts
- Total Videos
- Total Video Likes
- New Posts
- New Videos
- Impressions
- Reach
- Engaged Users
- New Likes
- New Unlikes
- Video Views
- Page Views
- Post Likes
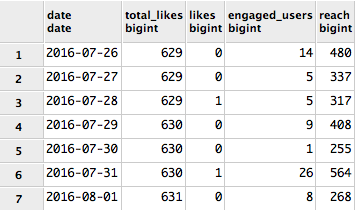
There's no way of extracting history data from Facebook's API, so we need to load data regularly using f_facebook_daily.py. Below is a time series query of likes and reach for a few days:
select
	dt.date,
	sum(total_likes) total_likes,
	sum(new_likes) likes,
	sum(engaged_users) engaged_users,
	sum(reach) reach from
f_facebook_daily fb inner join d_date dt on dt.date_id = fb.date_id
group by date
order by 1;
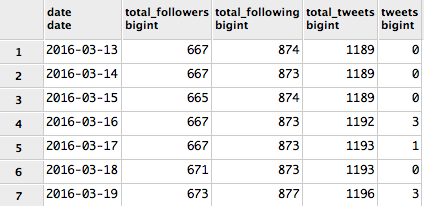
The Twitter API is not as rich as the Google or Facebook APIs and is limited to only 15 queries an hour. For my ETL scripts this shouldn't matter, but once again no history is available. The script for this load is f_twitter_daily.py. The measures we've got are:
- Total Followers
- Total Following
- Total Tweets
- Followers
- Following
- Tweets
select
	dt.date,
	sum(total_followers) total_followers,
	sum(total_following) total_following,
	sum(total_tweets) total_tweets,
	sum(tweets) tweets from
f_twitter_daily tw inner join d_date dt on dt.date_id = tw.date_id
group by date
order by 1;
YouTube
The data for videos and views over time are stored in a flatten fact table. Given the small number of attributes for videos and the lack of interconnectivity with the other information, I just denormalised on them onto the fact table. For measures we have:
- Total Views
- Views
- Total Likes
- Likes
- Total Dislikes
- Dislikes
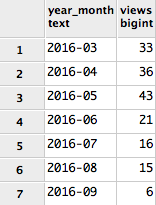
Once again this is loaded incrementally, storing records for each video for each day. The incremental loading script is f_youtube_daily.py. The below query shows how many views the videos got by month:
select
	dt.year_month,
	sum(yt.views) views
from
	f_youtube_daily yt
	inner join d_date dt on dt.date_id = yt.date_id
group by dt.year_month
order by 1, 2;
MailChimp
The MailChimp API allows extraction of information about subscriber lists and campaigns. f_mc_lists_daily.py will load in today's fact data as well as updating the subscriber list dimension. The measures include:
- Members
- Unsubscribed
- Cleaned
- Total Members
- Total Unsubscribed
- Total Cleaned
- Total Campaigns
- Open Rate
- Average Subscribe Rate
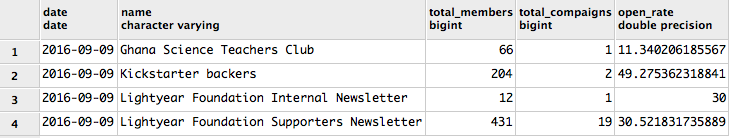
Below is an example query showing a snapshot of the subscriber list data as of 9th September 2016.
select
	dt.date,
	ml.name,
	sum(mc.total_members) total_members,
	sum(mc.total_campaigns) total_compaigns,
	avg(mc.open_rate) open_rate
from
	f_mc_lists_daily mc
	inner join d_date dt on dt.date_id = mc.date_id
	inner join d_mc_lists ml on ml.list_id = mc.list_id
where date = '2016-09-09'
group by dt.date, ml.name
order by 1, 2;
Summary
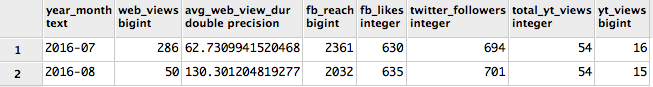
Now we've got all these different facts, we can write BI style summary queries to compare all of the data, or provide regular reports. This is a query across multiple fact tables conforming on the date dimension. It shows summary statistics for each fact per month.
with
ga as
(
	select dt.year_month, sum(ga.sessions) as sessions, avg(ga.avg_session_duration) as avg_session_duration
	from
		f_ga_daily ga
		inner join d_date dt on dt.date_id = ga.date_id
	where dt.year = 2016
	group by dt.year_month
	order by 1
),
fb as
(
	select dt.year_month, last(total_likes) as total_likes, sum(fb.reach) as reach
	from
		f_facebook_daily fb
		inner join d_date dt on dt.date_id = fb.date_id
	where dt.year = 2016
	group by dt.year_month
	order by 1
),
tw as
(
	select dt.year_month, last(total_followers) as total_followers
	from f_twitter_daily tw
	inner join d_date dt on dt.date_id = tw.date_id
	where dt.year = 2016
	group by dt.year_month
	order by 1
),
yt as
(
	select dt.year_month, sum(views) as views, last(total_views) as total_views
	from
		f_youtube_daily yt
		inner join d_date dt on dt.date_id = yt.date_id
	where dt.year = 2016
	group by dt.year_month
	order by 1
)
select
ga.year_month, ga.sessions as web_views, ga.avg_session_duration as avg_web_view_dur, fb.reach as fb_reach,
fb.total_likes as fb_likes, tw.total_followers as twitter_followers, yt.total_views as total_yt_views, yt.views as yt_views
from
ga
	inner join fb on ga.year_month = fb.year_month
	inner join tw on ga.year_month = tw.year_month
	inner join yt on ga.year_month = yt.year_month;
So there we have it, a open-sourced ETL package for a handful of social media sites that will track history. The final tables can be used as a source for any reporting tools you want, and the data can all be tied together by date. This is particularly useful for showing summary trends over time. However, I don't store even a fraction of the amount of data that we can get in real time from the APIs. The next blog entry will show how to use open source technologies to visualise this data as well as the real time information.