Data Visualization Desktop 12.2.2.0

Yesterday Data Visualization Desktop (DVD) Version 12.2.2.0 was released. DVD, since its first release, aims to extend Oracle's Data Visualization portfolio by adding a desktop tool allowing data visualization capabilities directly to end users without the intervention of the IT department, in line with the Gartner's bi-modal IT.
The new version adds several capabilities to the existing product like visualization types, data sources and a wrangling option. This post will share the details of the new release additional features.
Installation
After downloading DVD, the installation is pretty simple, just double click on the Oracle_Data_Visualization_Desktop_V2_12_2_2_0_0.msi file, choose the installation folder and click on "Install".
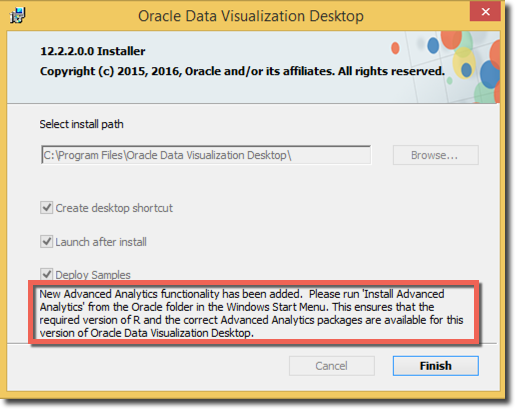
Once the installation is finished, be aware of the message in the last screen, it says that the correct version of R and the set of packages need to be installed in order to be used with DVD for Advanced Analytics. Those can be installed via the "Install Advanced Analytics" file placed in Start Menu -> Programs -> Oracle.
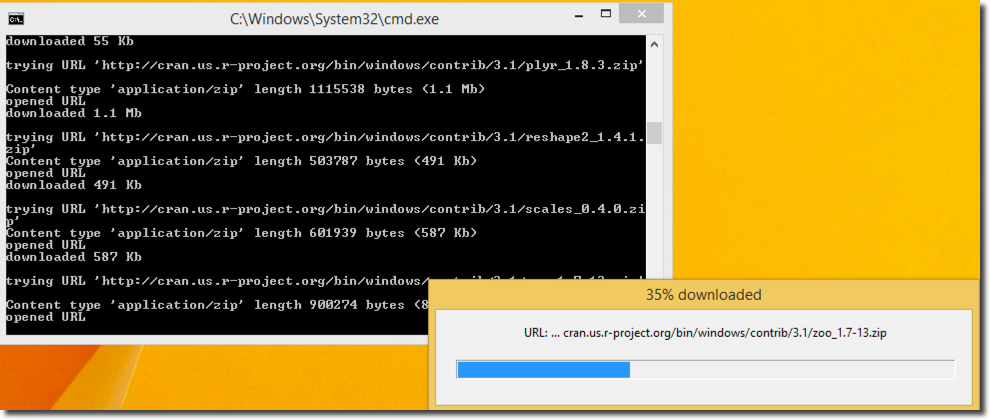
This setup allows to chose the R installation location, installs R and then downloads from cran.us.r-project.org the relevant packages.
New Visualisations
The first set of improvements in the new release is about the new out of the box visualisation, and new set of graphs is now available:
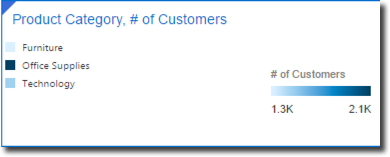
- List: Shows a list of the dimension's values together with a gradient colouring based on the measure selected
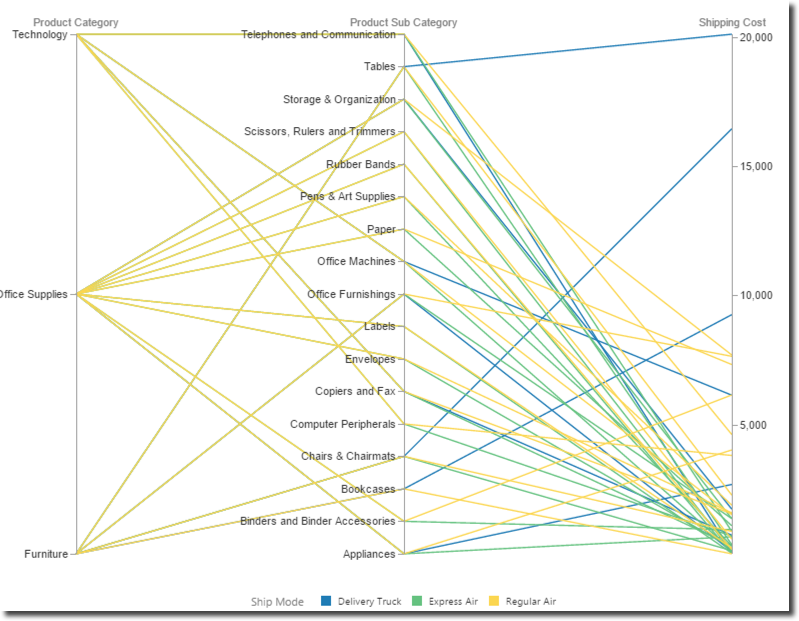
- Parallel Coordinates: Shows multiple dimensions on the same chart enhancing the ability to quickly get an insight about possible connections between them
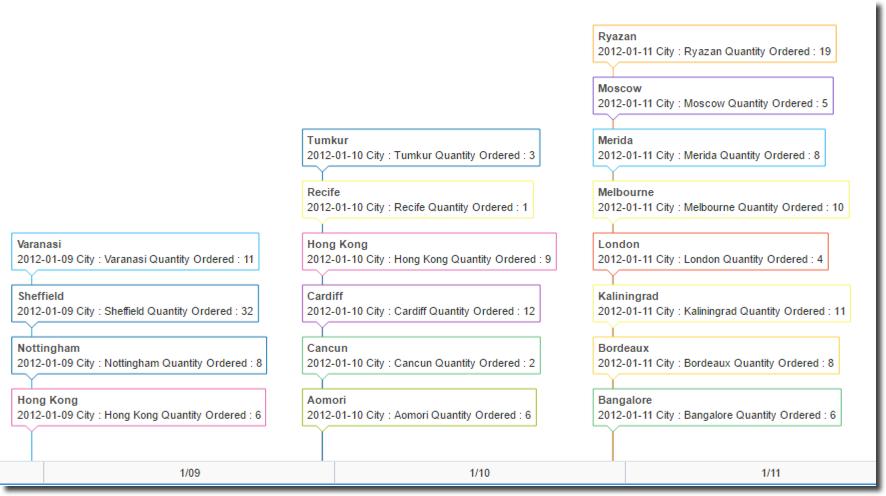
- Timeline: It's an effective way of showing time related facts, each fact is shown along a timeline, with one or more distinguishing attributes, the example shows the quantity shipped by day and city.
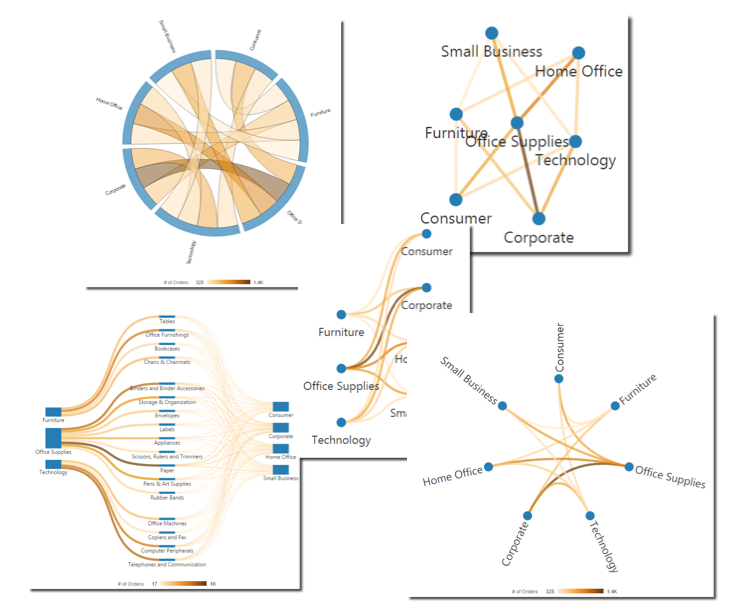
- Network Diagrams: Chord, Circular, Network and Sankey Diagrams are used to shows inter-relationship between elements
Other visual enhancements include a multi-canvas layout that can be exported with a single click and a hierarchical or gradient colouring for the charts.
Data Sources
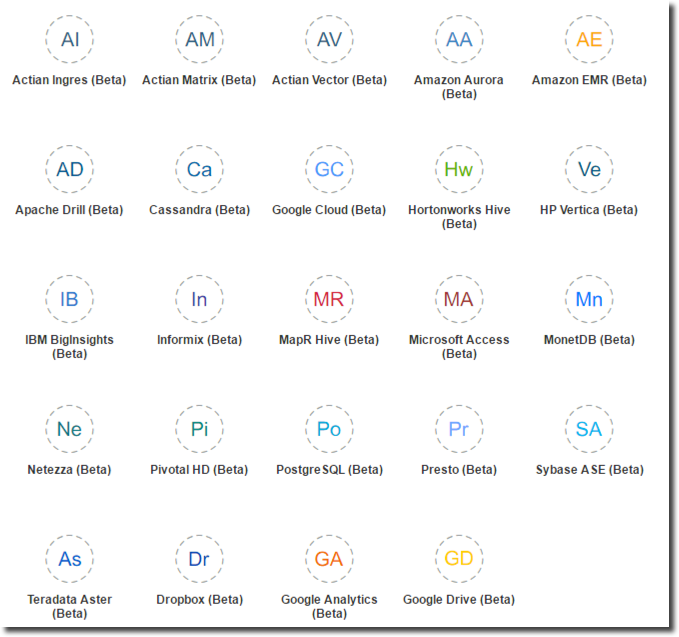
A lot of new data sources have been added to DVD, some of them still in beta phase. A bunch of new databases are now supported like Netezza, Amazon Aurora and PostgreSQL.
An interesting enhancement is the connection to Dropbox and Google Drive allowing DVD to source files stored in Cloud. Finally DVD's exposure to Big Data world has been enhanced by the addition of the connectivity to tools such as Apache Drill, Presto and Cassandra.
Excel Editing
Excel sheets used as data source now can be edited and the DVD project refreshed without the need of manually reloading the spreadsheet.
Data Flows
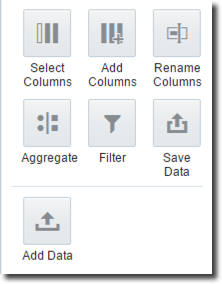
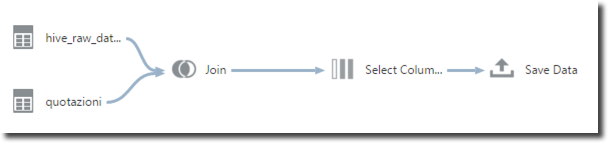
There is a new component in DVD called Data Flow allowing the end user some basic transformations of the data like joining two datasets (even if coming from different sources), filtering, aggregating, adding columns based on custom formulas and storing the result on the local file system.
In the example below two files coming from Hive (but the source can also be different) are joined and a subset of columns is selected and stored locally.
Data Flows can be stored in DVD and re-executed upon request. The list of Data Flows is available under Data Sources -> Data Flows. In the next blog post I'll show a typical Analyst use case in which Data Flow can help automating a series of data loading, cleansing and enriching steps.
Data Insights
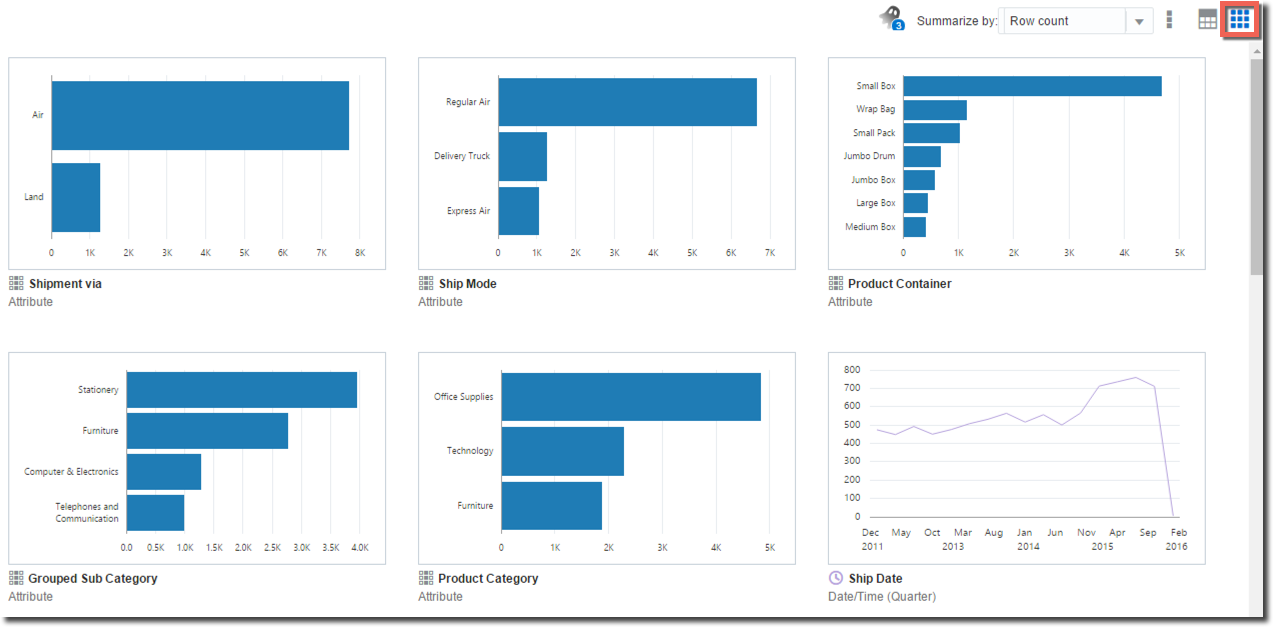
Data Insights provides a way of quickly understand the dataset available, by default it shows a series of graphs, one for every attribute, with the cardinality of each attribute's value. A drop down menu allows to show the same graphs based on any measure defined in the dataset.
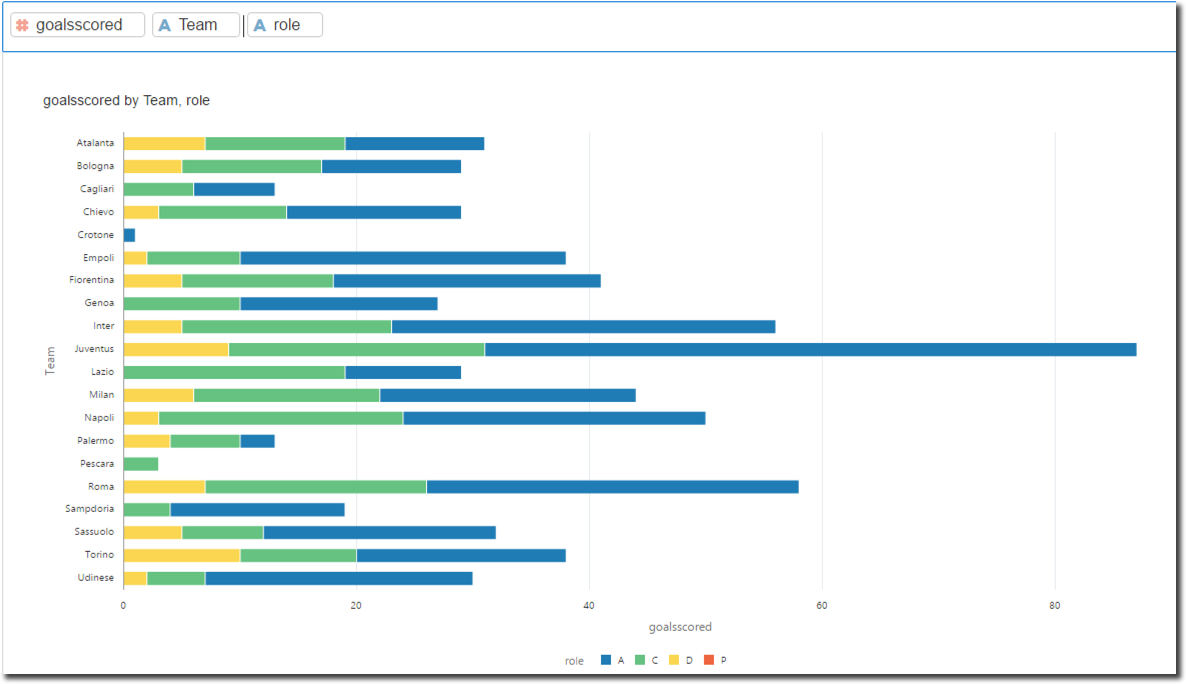
BI Ask
The new DVD version contains also BI Ask, providing the ability to create queries with natural language which is automatically interpreted and presented in suggested visualisations.
As you could read in this post the new version of Data Visualization Desktop adds a series of really interesting features enabling not only the data visualisation but also data exploration and wrangling. In the next blog post we'll see a typical DVD use case and how the new Data Flow option could be used to couple data coming from various sources.