Oracle Data Visualization Desktop: Star Schemas and Multiple Fact Sources

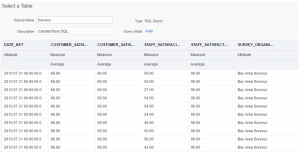
Once added to a project, columns I specified with my custom SQL query now shows up as one source.
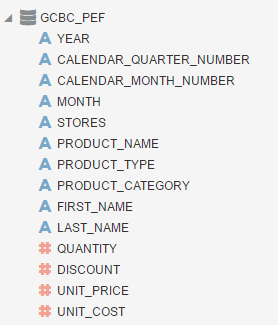
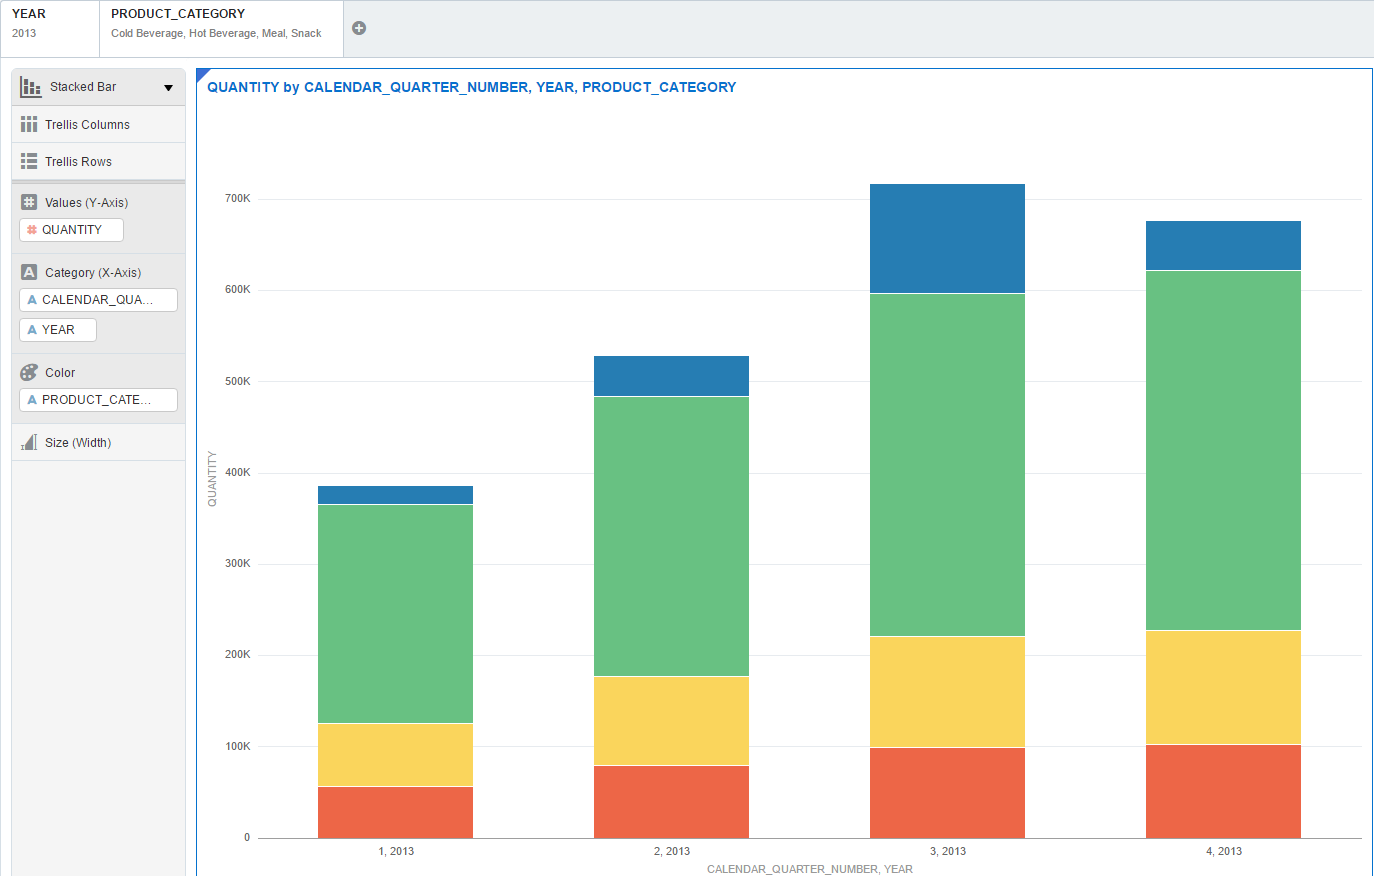
Now that I have a custom data source with only the data I want to explore, I can easily create an analysis without having to sift through multiple data sources.
** A note about Data Visualization Desktop and caching: When using the above method of writing SQL to create a virtual table, it is loaded into the cache. You should only use this method for very compact models. If the virtual table contains too much data, you can still add it as a data source but it may be too big to cache, causing your columns not to load when creating analyses.*
Although having one fact source is common in relational models, using multiple fact sources is sometimes unavoidable in dimensional modeling.
In my sample data, I have another schema called GCBC_SURVEYS which contains two fact tables containing satisfaction scores for both customers and staff and one dimension table containing the organization that conducted the surveys.
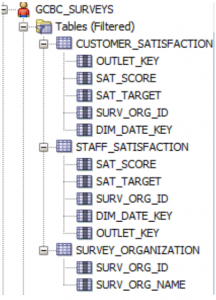
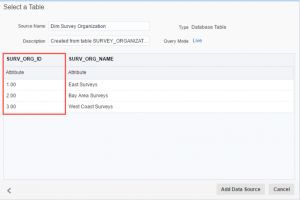
For this example, I’m going to try to add each table as a data source manually first and attempt to join the two fact tables to my dimension table. When using this method, pay close attention to change any key and ID columns from Measure to Attribute so they aren’t aggregated. Data Visualization Desktop sees a numeric datatype and assumes it’s a measure.
Once I've added in all of the GCBC_SURVEYS tables as data sources, I’m going to load them all into a project and create my joins using source diagram. When I joined each fact table to the dimension table on the SURV_ORG_ID, notice how DVD automatically created a join between my two fact tables.
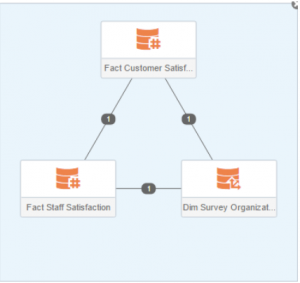
This is not desirable because, due to the presence of a circular join, we run the risk of double counting. When I try to break the join between the two fact tables, DVD asks which data source I want to break conformance from.
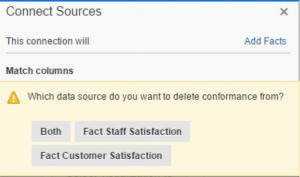
When I select one of the fact sources, it will not only break the join between the two fact sources but also the join between the fact and the dimension table.
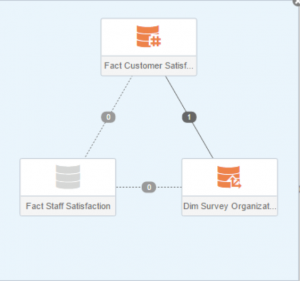
As of this writing, I have not found a way to only break joins between fact tables if they are using the same key to connect to the dimension table.
The only workaround to this I’ve found is to write SQL statement to pull in the columns and create the joins into one virtual table. This way I could specify the joins without DVD creating one between the fact sources.
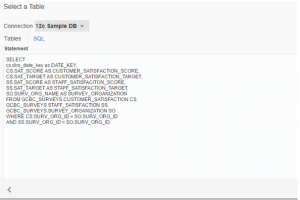
Once I created my virtual table, I could use it to create a report and use both fact sources.
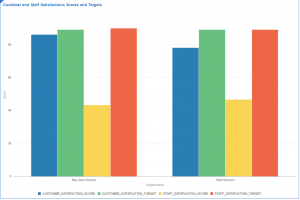
Although it can take some time to set up all the data sources you want to use for your model, Data Visualization Desktop packs some powerful features when it comes to dimensional modeling. The ability to use more than one fact source when needed adds another area of flexibility to DVD. Whether you are pulling in each table and then creating your model or writing a SQL to create one virtual table, DVD has the flexibility to be able to accommodate a variety of different scenarios.