Create Your Own DVD Plugin in 22 minutes

Introduction
Oracle DVD played well for the task of elections data analysis. But I faced some limitations and had to curtail my use of one of my favourite charts - Scatter chart. While DVD’s implementation of it looks good, has smooth animations and really useful, it is not suitable for visualisations of huge datasets. Election dataset has about 100K election precinct data rows and if I try to plot all of them at one chart I will get something close to this. It doesn't really important what is the data, just compare how charts look like.
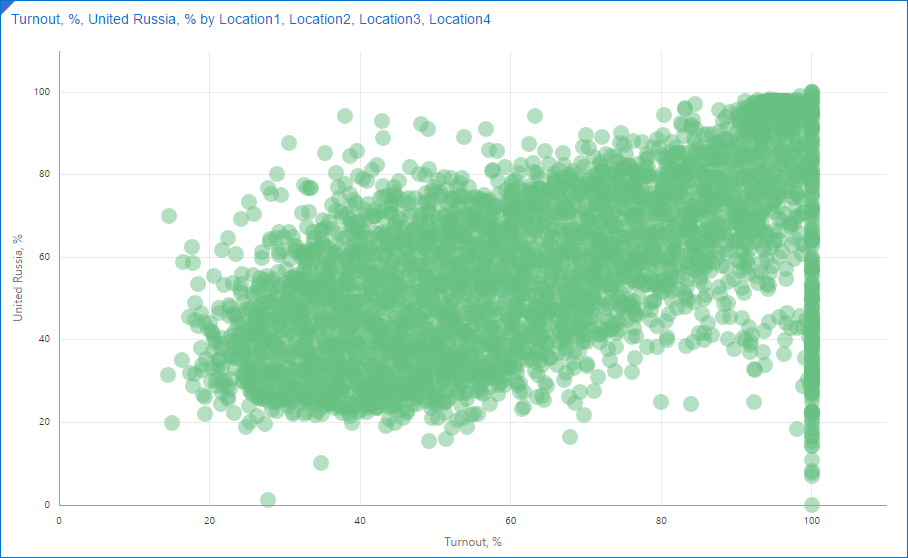
This picture can give us about zero insights. Actually, I'm not even sure if shows my 100K points. What I want to get is something like this:
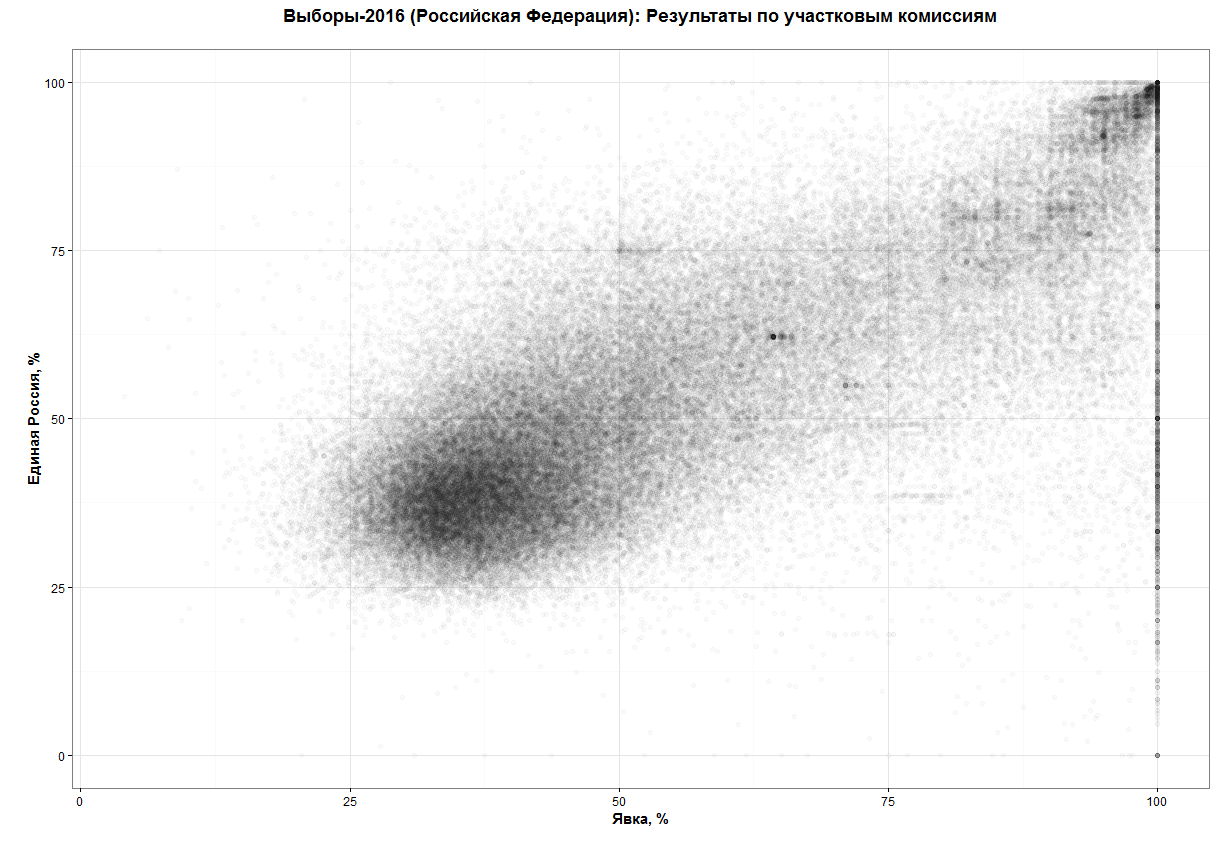
(source: https://habrahabr.ru/post/313372/)
What can I see at this chart and can't see at the vanilla one? First of all, it gives a much better understanding of points distribution other the plot. I can see a relatively dense core around coordinates [30;40] and then not so dense tail growing by both dimensions and again a small and very dense core in the top right corner.
Secondly, it not only shows dense and sparse areas but shows that there are exist a few points which have an unexplainably high concentration. Around [64;62], for example.
Luckily DVD allows me (and anyone else too) create custom plugins. That's what I'm going to show here. The plugin I'm going to do is something I'd call Minimum Viable Product. It's very, very simple and needs a lot of work to make it good and really useful.
The code I'm going to show is the simplest I can invent. It doesn't handle errors, exceptions and so on. It should be more modular. It possibly could use some optimisation. But that was done for a purpose. And the purpose is called 'simplicity'. If you want a more comprehensive sample, there is a link to the Oracle's guide in the Summary. I want to show you that writing a DVD plugin is not a rocket science. It takes less than half an hour to build your own DVD plugin.
And the clock starts now!
[0:00-5:40] Setup Environment and DVD SDK
Setup
Download and install DVD. I presume you already have it, because from my experience people who doesn't have it very rarely feel a need for its plugins. Hence I didn't include download and installation times into 22 minutes.
Create a folder to store your plugins and some Gradle-related configs and scripts. It may be any directory you like, just select your favourite place.
Next step is to define some environment variables.
- The first one is
DVDDESKTOP_SDK_HOMEand it should point to thу DVD folder. In most of the cases, it isC:\Program files\Oracle Data Visualisation Desktop. - The second variable is
PLUGIN_DEV_DIRit points to the folder you created 40 seconds ago. These two variables seem not to be absolutely necessary, but they make your life a bit easier. - And one more change to the environment before going further. Add
%DVDESKTOP_SDK_HOME%\tools\binto thePATHvariable (do you feel how your life became easier withDVDDESKTOP_SDK_HOMEalready defined so you can start using it right now?).
And the last step is to initialise our development environment. Go to the plugins directory and execute the initialization command. Open cmd window and execute:
cd %PLUGIN_DEV_DIR%
bicreateenv
This will not only initialise everything your need but create a sample plugin to explore and research.
Let's take a look at what we got. In the folder we have created before (%PLUGIN_DEV_DIR%) this command generated the following structure.
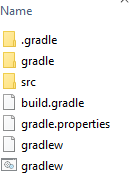
All names here are more than self-explanatory. You won't need to do anything with .gradle and gradle, and src stores all the code we will develop. Please notice that src already has sample plugin sampleviz. You may use it as a referrence for your own work.
Create First Plugin
Every plugin consists of a few parts. We don't need to create them from scratch every time. Oracle gives us a simple way of creating a new plugin. If you didn't close cmd window from previous steps execute the following:
bicreateplugin viz -id com.rittmanmead.demo -subType dataviz
Obviously, you should use your own company name for the id. The last word (demo) plus word Plugin is what user will see as a visualisation name. Obviously we can change it but not today.
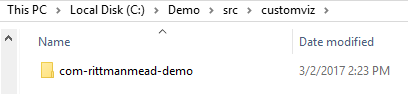
This will create a fully operational plugin. Where can we find it? You shouldn't be too surprised if I say "In src folder".
And we may test it right now. Yes, its functionality is very limited, but you didn't expect it to do something useful, right?
Start SDK
Now we should start Oracle DVD in SDK mode. The main difference from the normal mode is that DVD will start in the default browser. That's not a typo. DVD will start as a usual site in a browser. It's a good idea to select as the default a browser with good developer console and tools. I prefer Chrome for this task but that's not the only choice. Choose the browser you'd normally use for site development. When you finish with setting up of the default browser do:
cd %PLUGIN_DEV_DIR%
.\gradlew run
If you don't have an ultrafast computer I'd recommend you to make some tea at this point. Because the very first start will take a long time. Actually, it will consume most of the first stage time.
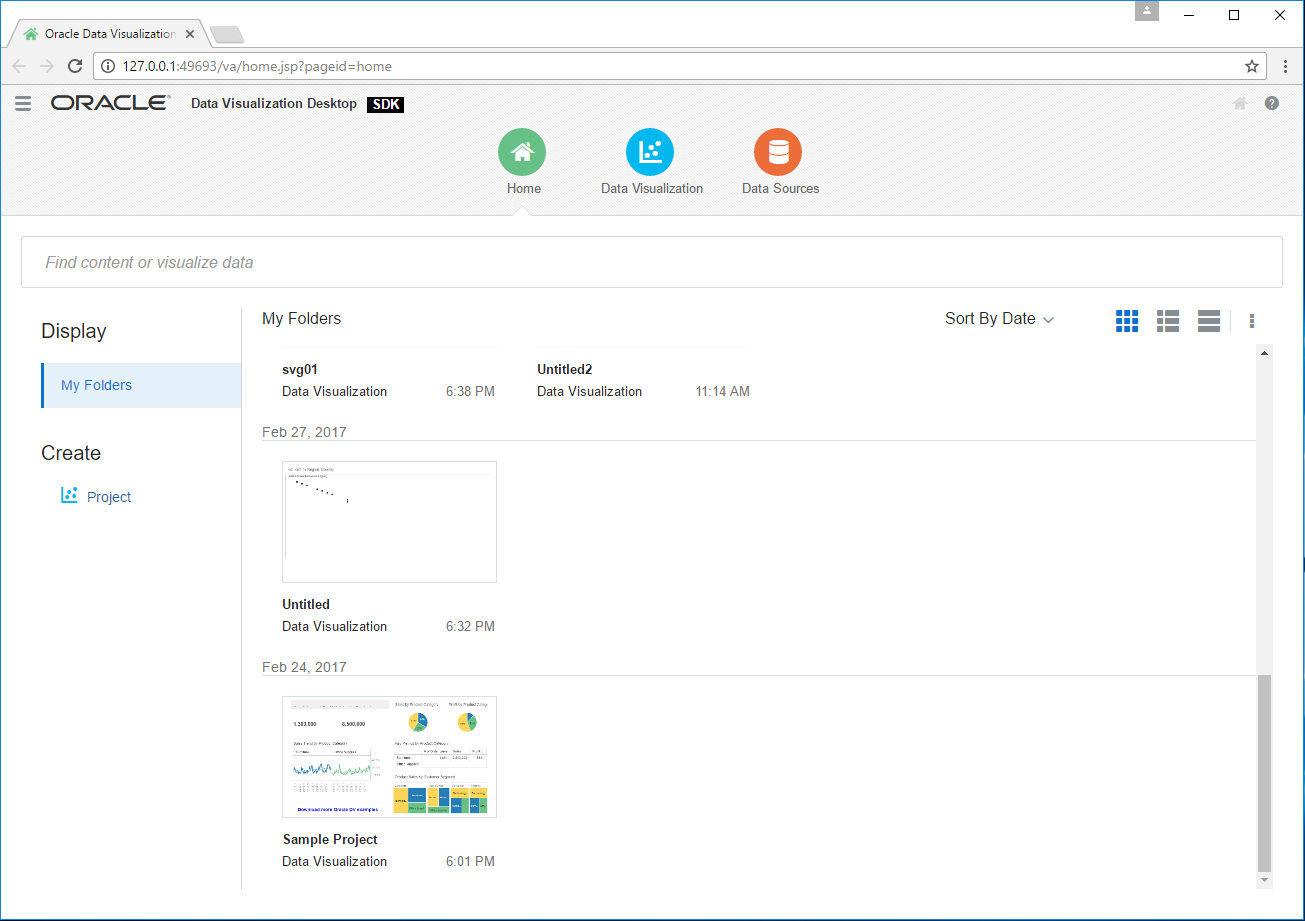
[5:40-6:15] Test the Plugin
We didn't start changing the first plugin yet, so I expect everything to be OK at this point. But anyway it's a good idea to test everything. I think we can afford 30-40 seconds for this.
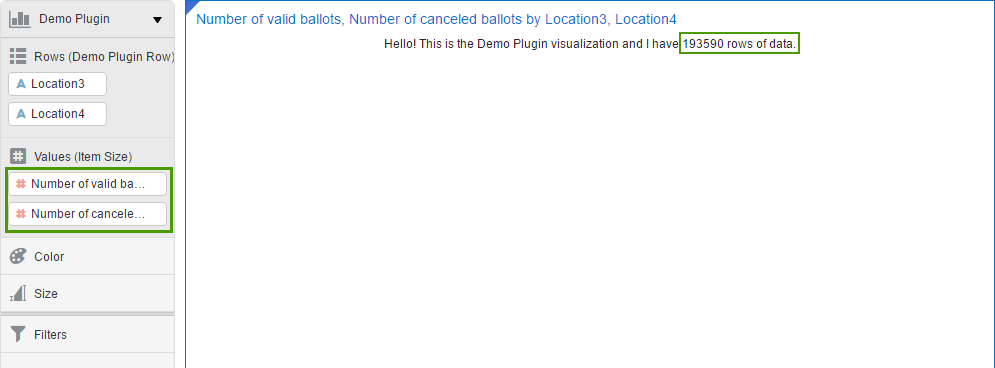
And again I assume you know how to use DVD and don't need a step-by-step guide on creating a simple visualisation. Just create a new project, select any data source, go to Visualisations, find your plugin and add it. You may even add some data to the plugin and it will show how many rows your data has. I think that's a good place to start from.
[6:15-22:00] Add Functions
Change parameters
If you didn't skip testing phase and played with this new toy for a while you may have noticed two things we need to change right now. First, for a chosen type of visualisation, I need that my plugin can accept two measures. You possibly noticed that I was unable to add Number of cancelled ballots as a second measure. By default a plugin accepts not more than one (zero or one). Luckily it can be changed very easily.
We can find all parameter about measures, rows, columns etc inside of extensions folder. In this case it is %PLUGIN_DEV_DIR%\customviz\com-rittmanemad-demo\extensions. Here we can find two folders. The first one is oracle.bi.tech.pluginVisualizationDataHandlerand it has only one file com.rittmanemad.demo.visualizationDataHandler.JSON. This file allows us to define which types of input data our plugin has (measures, columns, rows, colour etc.), what are their types (measures/dimensions), which is the default one and so on.
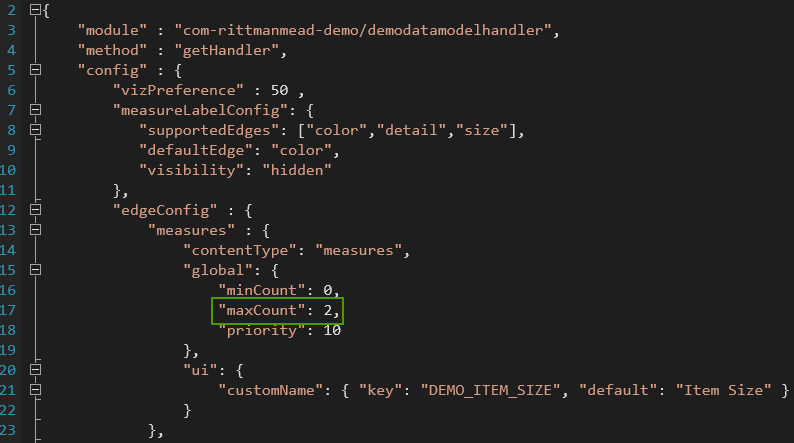
Here we should change maxCount to 2. This will allow us to add more than one measure to our visualisation.
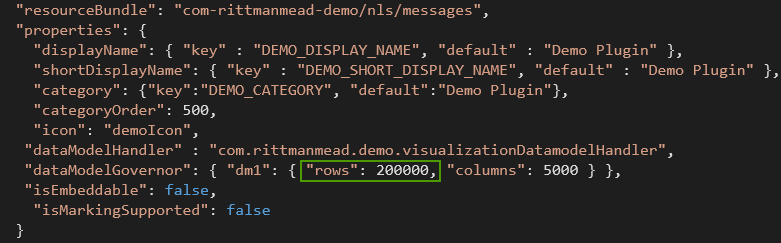
The second thing I want to change is the number of data points. Elections dataset has data about 100K precinct commissions. And DVD's default is 10K. We can change this value in the second configuration file from extensions folder. Its name is oracle.bi.tech.Visualization. There is again only one JSON file com.rittmanmead.demo.json. We need to change rows to 200000.
Why 200000 if I need only 100000 points? Well, it's about how data will be passed to our code. Every measure is a separate row, so I need 100K points with 2 measures each and that gives me 200000 rows. It looks like right now that's the only way to have more than one measure in a plugin (at least it's my best knowledge for DVD 12.2.2.2.0-20170208162627).
Note. I could change here some things like plugin name, input data types shown to user and so on but my aim is simplicity.
Now we should restart DVD SDK in order to use new parameters.
Write code
For my custom scatter chart I'm going to use d3js JavaScript library. It will allow me to concentrate more on logic and less on HTML manipulation. To add it to my plugin I should add a couple of strings in the beginning of my code.
Before:
define(['jquery',
        'obitech-framework/jsx',
        'obitech-report/datavisualization',
        'obitech-reportservices/datamodelshapes',
        'obitech-reportservices/events',
        'obitech-appservices/logger',
        'ojL10n!com-rittmanmead-demo/nls/messages',
        'obitech-framework/messageformat',
        'css!com-rittmanmead-demo/demostyles'],
        function($,
                 jsx,
                 dataviz,
                 datamodelshapes,
                 events,
                 logger,
                 messages) {
After (I added two lines starting with d3):
define(['jquery',
        'obitech-framework/jsx',
        'obitech-report/datavisualization',
        'obitech-reportservices/datamodelshapes',
        'obitech-reportservices/events',
        'obitech-appservices/logger',
      'd3js',
        'ojL10n!com-rm-domoViz/nls/messages',
        'obitech-framework/messageformat',
        'css!com-rittmanmead-demo/demostyles'],
        function($,
                 jsx,
                 dataviz,
                 datamodelshapes,
                 events,
                 logger,
               d3,
                 messages) {
That's all. Now I can use d3js magic. And that's cool.
OK, it's time to make our plugin do something more useful than a simple counting of rows. All plugin code is in demo.js file and the main procedure is render. It is called every time DVD needs to update the visualisation. The initial version of this function is really small. Without comments there are only four rows. It retrieves data, counts rows, then finds a container to write and writes a message.
Demo.prototype.render = function(oTransientRenderingContext) {
      // Note: all events will be received after initialize and start complete.  We may get other events
      // such as 'resize' before the render, i.e. this might not be the first event.

      // Retrieve the data object for this visualization
  var oDataLayout = oTransientRenderingContext.get(dataviz.DataContextProperty.DATA_LAYOUT);

      // Determine the number of records available for rendering on ROW
      // Because we specified that Category should be placed on ROW in the data model handler,
      // this returns the number of rows for the data in Category.
  var nRows = oDataLayout.getEdgeExtent(datamodelshapes.Physical.ROW);

      // Retrieve the root container for our visualization.  This is provided by the framework.  It may not be deleted
      // but may be used to render.
  var elContainer = this.getContainerElem();
  $(elContainer).html(messages.TEXT_MESSAGE.format("Demo Plugin", "" + nRows));
};
First of all, I need to know the actual size of the plotting area. I simply added that after var elContainer = this.getContainerElem();:
  [...]
  var elContainer = this.getContainerElem();

  //container dimensions
  var nWidth = $(elContainer).width();
  var nHeight = $(elContainer).height();
  [...]
The template plugin has code for pulling the data into the script (oDataLayout variable). But for my scatter plot, I need to put this data into an array and find the minimum and the maximum value for both measures. This part of the code is my least favourite one. It looks like currently we can't make two separate measures in a custom viz (or at least I can't find the solution), therefore instead of two nice separate measures, I have them as different rows. Like:
| ... | ... | ... |
| PEC #1 | Turnout,% | 34,8% |
| PEC #1 | United Russia,% | 44,3% |
| PEC #2 | Turnout,% | 62,1% |
| PEC #2 | United Russia,% | 54,2% |
| PEC #3 | Turnout,% | 25,9% |
| PEC #3 | United Russia,% | 33,2% |
| ... | ... | ... |
I really hope that any solution for this will be found. So far I just put even and odd rows into X ad Y coordinates. At the same time, I determine minimum and maximum values for both axes.
  //temporary measure
  var tmp_measure;

  //current measure
  var cur_measure;

  var vMinimax=[Number.MAX_VALUE, Number.MIN_VALUE];
  var hMinimax=[Number.MAX_VALUE, Number.MIN_VALUE];

  for(var i=0;i<nRows;i++){

    if(i%2==1){
      cur_measure=Number(oDataLayout.getValue(datamodelshapes.Physical.DATA, i, 0, false));
      vMinimax[0]=Math.min(vMinimax[0], cur_measure);
      vMinimax[1]=Math.max(vMinimax[1], cur_measure);
      points.push([cur_measure,tmp_measure]);
    }
    else{
      tmp_measure=Number(oDataLayout.getValue(datamodelshapes.Physical.DATA, i, 0, false));
      hMinimax[0]=Math.min(hMinimax[0], tmp_measure);
      hMinimax[1]=Math.max(hMinimax[1], tmp_measure);
    }
  }
The next part of the code is about handling multiple calls. I should handle things like changing measures or dimensions. I simply delete the old chart and create a new empty one.
  var oSVG;

  //Delete old chart if exists
  d3.select("#DemoViz").remove();

  //Create new SVG with id=DemoViz
  oSVG=d3.select(elContainer).append("svg");
  oSVG.attr("id","DemoViz");

  //Set plot area size
  oSVG=oSVG
       .attr("width", nWidth)
       .attr("height", nHeight)
       .append("g");
Now I have an array with data. I have a prepared SVG plot for drawing. And I have no reason not to combine all this into a chart.
  //Compute scaling factors
  var hStep=(nWidth-40)/(hMinimax[1]-hMinimax[0]);
  var vStep=(nHeight-40)/(vMinimax[1]-vMinimax[0]);

  //Draw
  oSVG.selectAll("rect")
      .data(points)
      .enter()
      .append("rect")
      .attr("x", function(d) {return 20+d[1]*hStep;})
      .attr("y", function(d) {return nHeight-(20+d[0]*vStep);})
      .attr("height",1).attr("width",1)
      .attr('fill-opacity', 0.3);
What I should mention here is opacity. If its value is too high (almost no opacity) the chart looks like this:
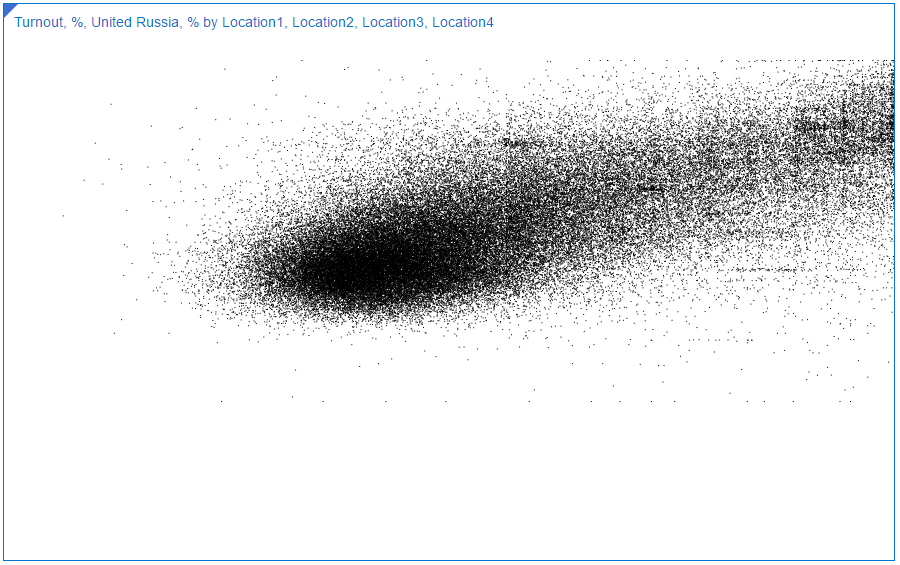
If I make dots more opaque, the chart looks (and works) better. This is how it looks like with fill-opacity=0.3.
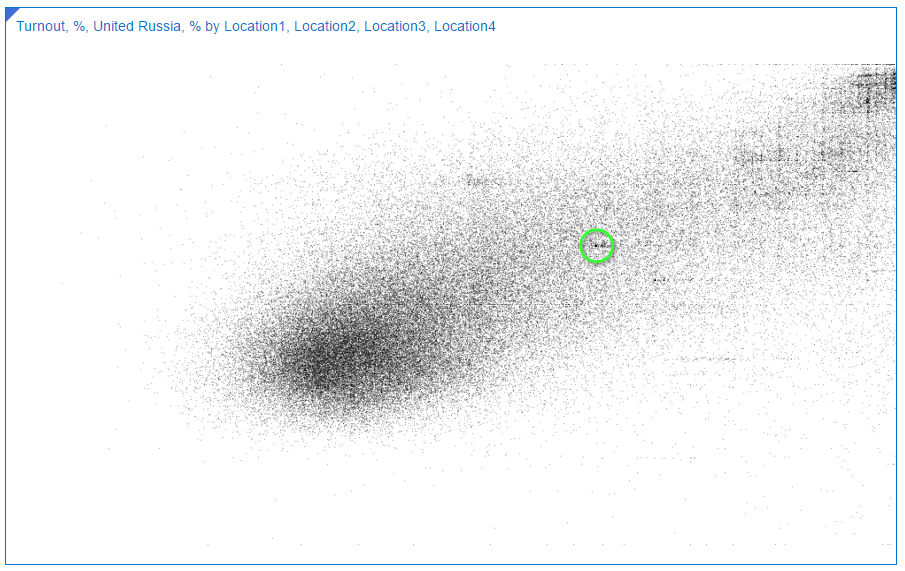
Look at the black point in the middle. It's there because a lot of commissions has exactly the same values for both measures. That's how we could find Saratov region anomaly.
[22:00-] Summary and TODOs
This shows how we may enhance Oracle DVD with our own visualisation. Yes, it's really, really, really simple. And it needs a lot of work in order to make it more useful. First of all, we should make it more reliable. This realisation doesn't test input parameters for correctness. And we also need to add interactivity. The chart should be zoomable and selectable. It should work as a filter. It should react to resize. It needs visible axes. And so on. But we can create it in less than a half of hour and I think as a first step it works well. I hope you don't afraid of making your own plugins now.
If you need more complex sample, take a look at the Oracle's tutorial. It covers some of these TODOs.