Oracle Analytics Cloud November 2023 Update: What's New?

The November 2023 Update for Oracle Analytics Cloud came out a few days ago and in this article, I'm going to have a look at the features it includes. If you are also interested in a comprehensive list of the defects fixed by the update, please refer to Doc ID 2919336.1.
Fine-tuning Permissions in Data Visualization
Since it's release, Data Visualization followed an all-or-nothing approach about permissions: if you are a member of the DVContentAuthor role, then you can create any kind of object (i.e. workbooks, datasets, data flows, connections, sequences, and machine learning models). This has always been one of the biggest barriers to Data Visualization adoption, since administrators often preferred to fully disable it rather than giving too much power to their end users. I can't blame them: it's like giving a driver license as a gift to all people who own a car!
The November 2023 Update finally breaks the aforementioned barrier by allowing you to handle fine-grained permissions on objects and control who can do what in Data Visualization! 🥳
Whilst I'm really happy about it, I have to admit that it has not been implement as I - and no doubt others who know the Manage Privileges page in Classic - was expecting:
- You can't grant/revoke permissions for the predefined application roles
- You are forced to create user-defined application roles, grant/revoke permissions for them, and eventually replace the predefined ones in order to fine-tune your security
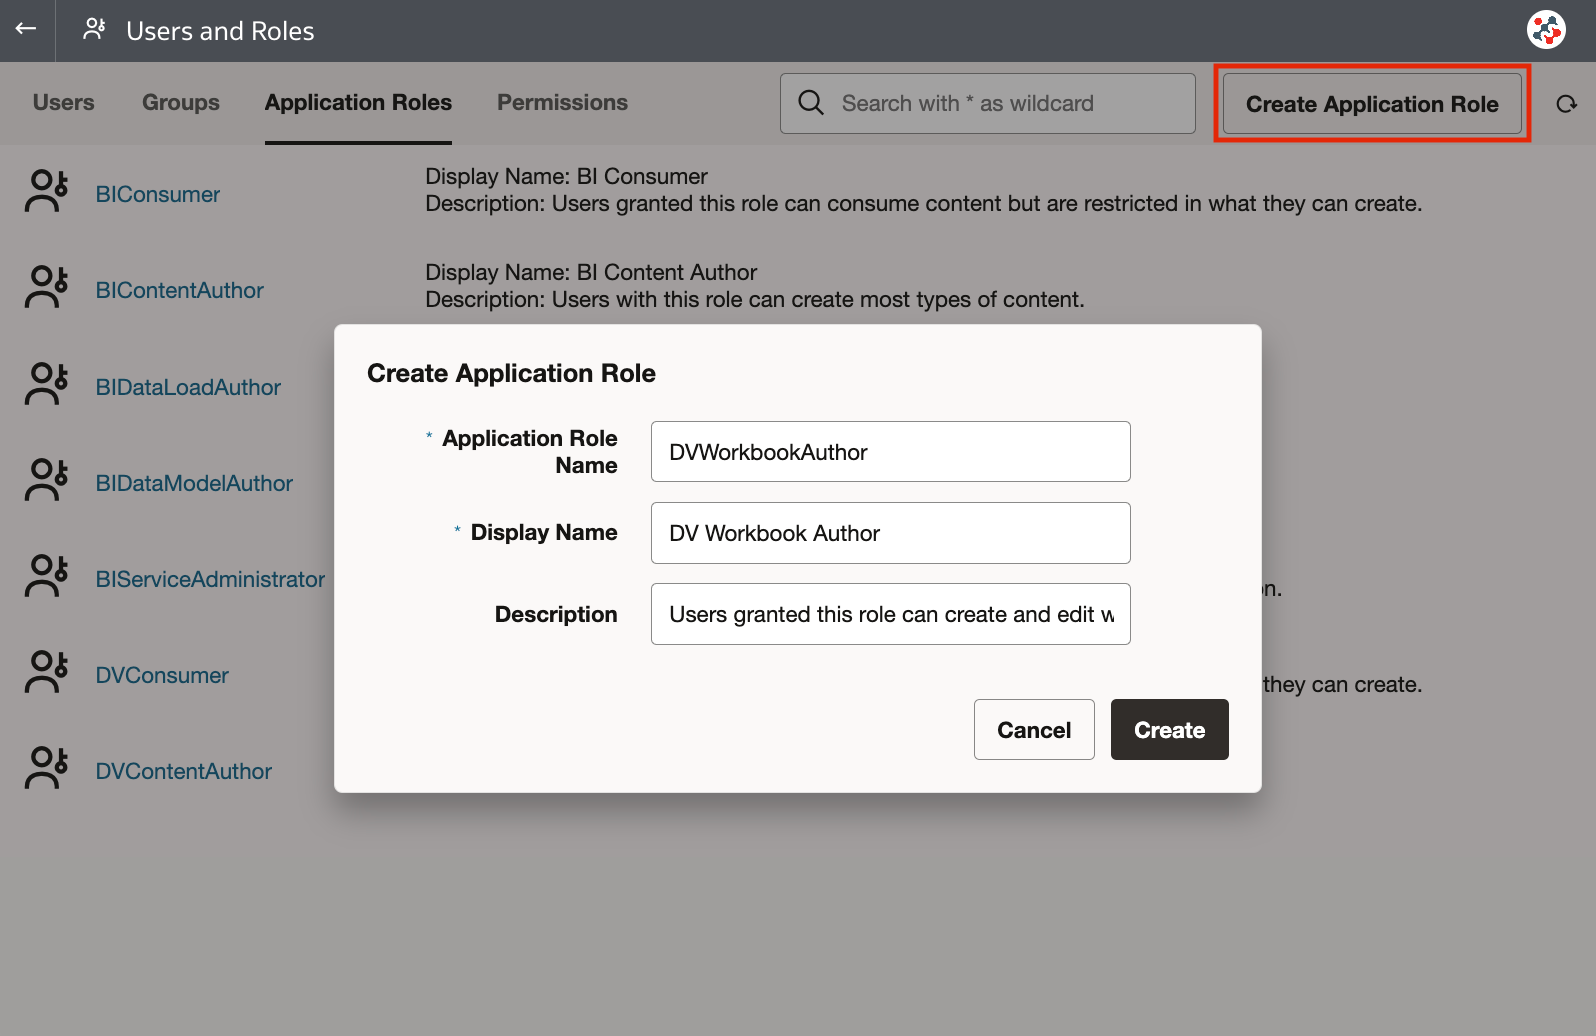
Let's suppose that you want to allow your users to create and edit only workbooks in Data Visualization. First of all, click on Users and Roles in the Console page, select the Application Role tab, and click on the Create Application Role button to create a new user-defined application role (Figure 1).
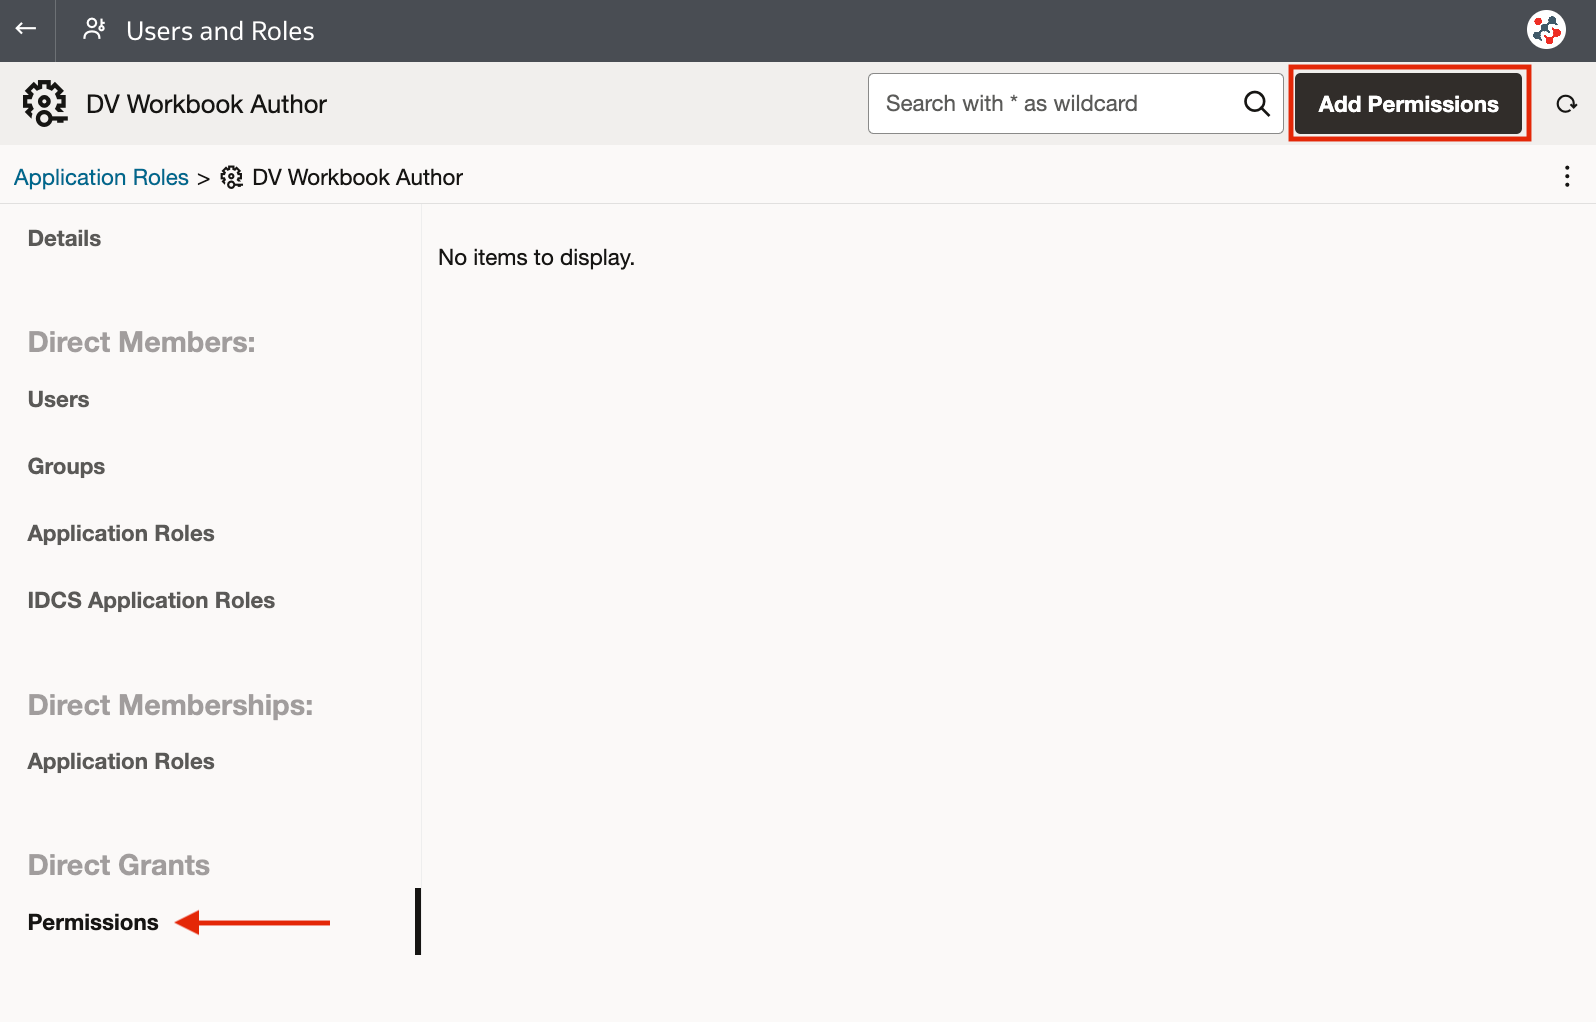
Click on the name of your user-defined application role, click on Permissions on the left hand side of the page, then click on the Add Permissions button (Figure 2).
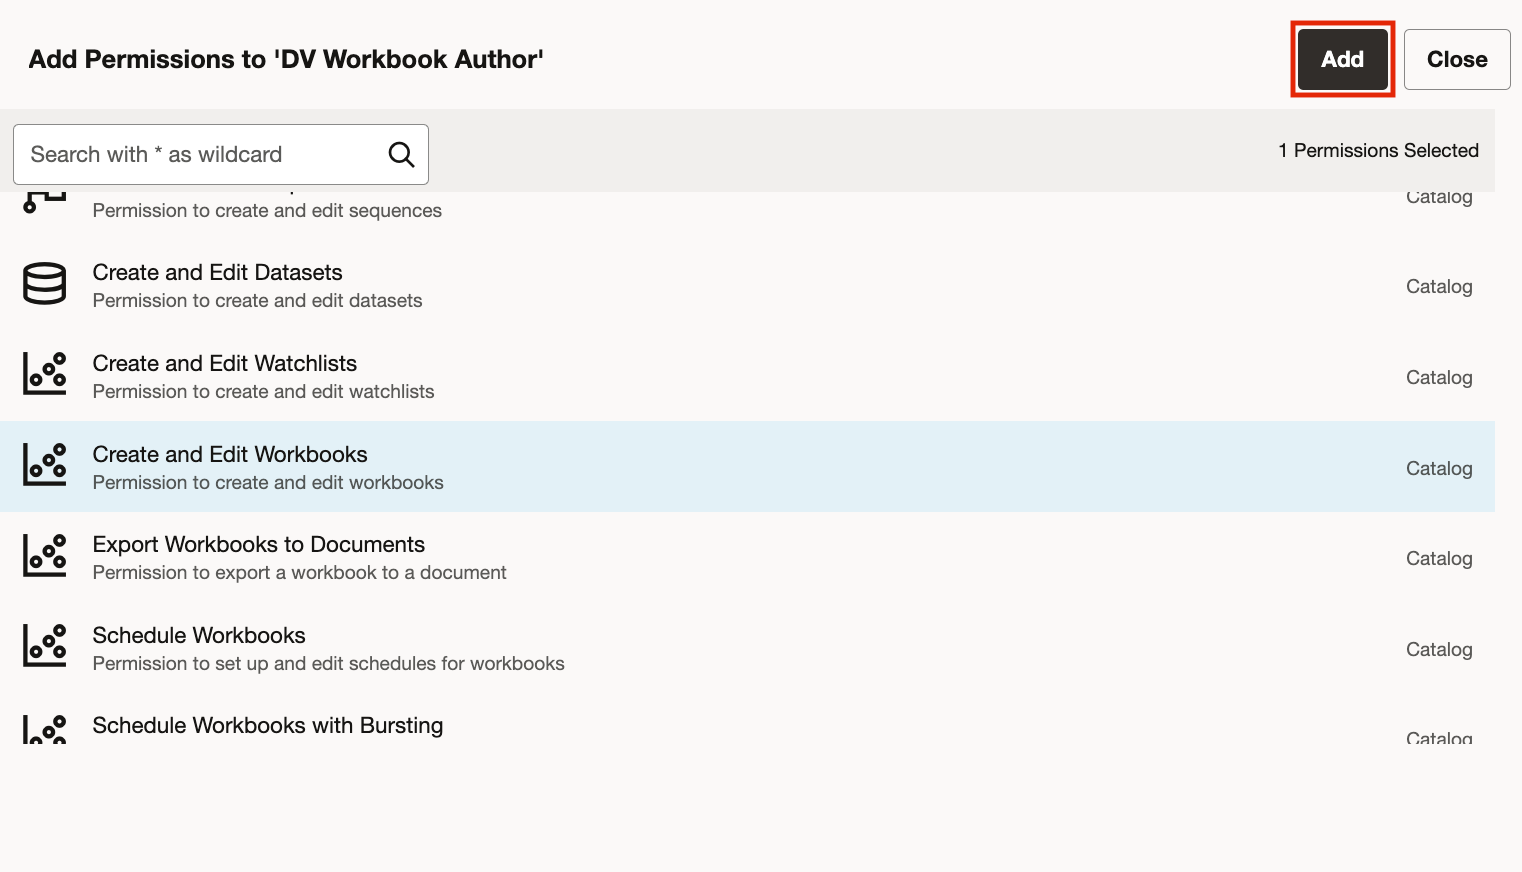
In the Add Permissions dialog, select Create and Edit Workbooks from the list, and click on the Add button (Figure 3).
Job done! Of course, remember to add the required users to the newly created user-defined application role, and eventually remove them from the DVContentAuthor one (the predefined application role).
You can also see the application roles related to a specific permission by clicking on Users and Roles in the Console page, and selecting the Permissions tab (Figure 4).
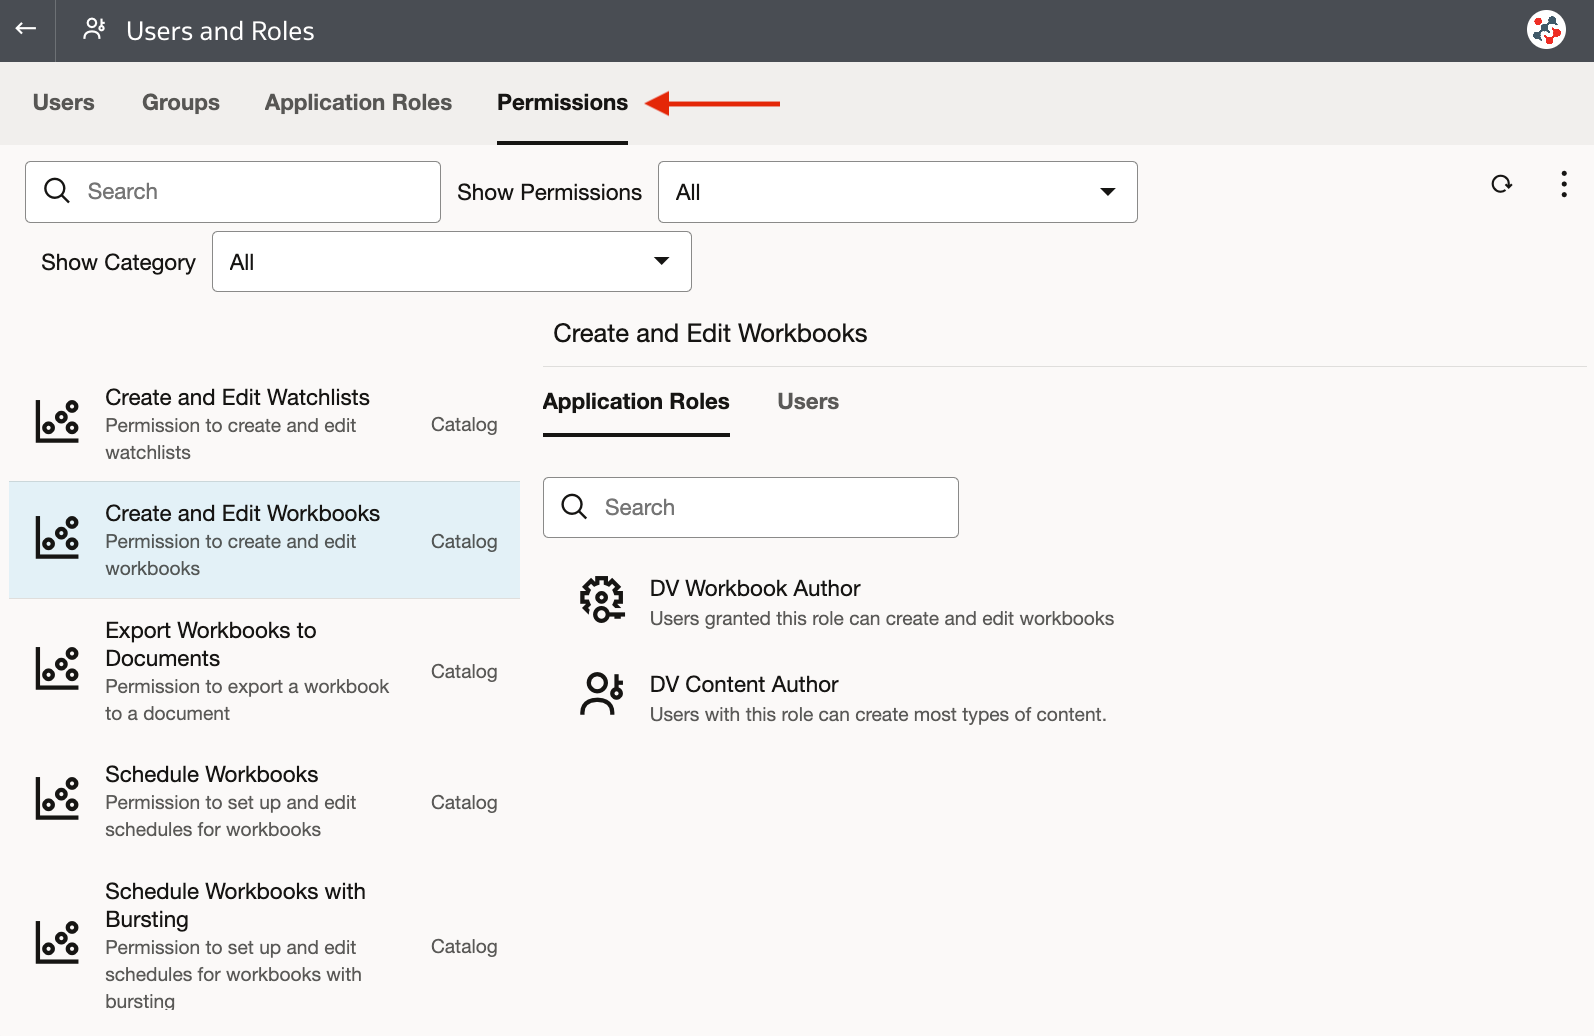
If you are interested in a list of the new fine-grained permissions available in Data Visualization, please refer to the About Permissions page in the Configuring Oracle Analytics Cloud guide.
Enhanced Restore Deliveries Options
Previously, when restoring agents from a snapshot or migrating them from a different environment, they would be disabled by default requiring manual reactivation. The November 2023 Update overcomes another barrier by offering increased flexibility through enhanced Restore Deliveries options (Figure 5).
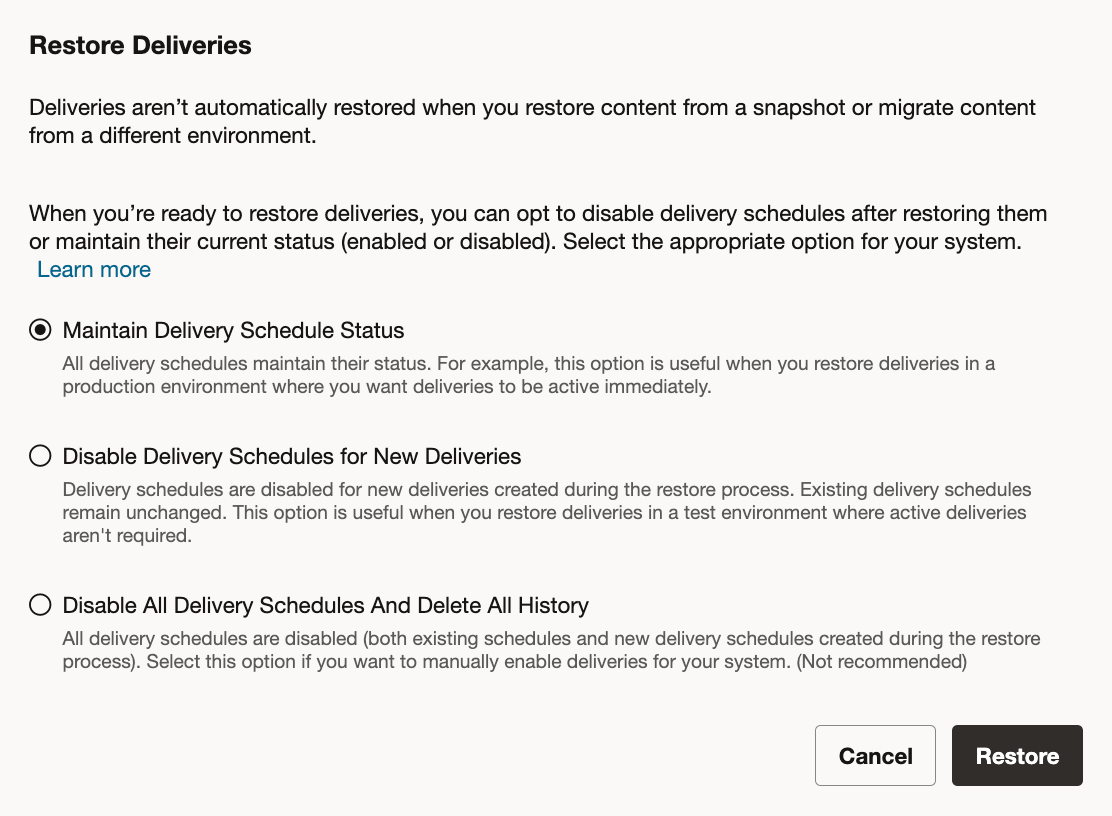
The Maintain Delivery Schedule Status option is suitable when you are restoring a production environment since all agents maintain their status. It means that agents with enabled schedules retain their status in the target environment once migrated (and restored). Existing agent schedules in the target environment remain unchanged.
The Disable Delivery Schedules for New Deliveries option does not maintain the status of new agent schedules as they are automatically disabled. Existing agent schedules remain unchanged.
The last option, Disable All Delivery Schedules and Delete All History, allows you to disable everything and delete all historical delivery details.
Enhanced Settings in the Present Canvas
With the November 2023 Update, the Present canvas introduces several new settings, offering greater control over the presentation flow for consumer users.
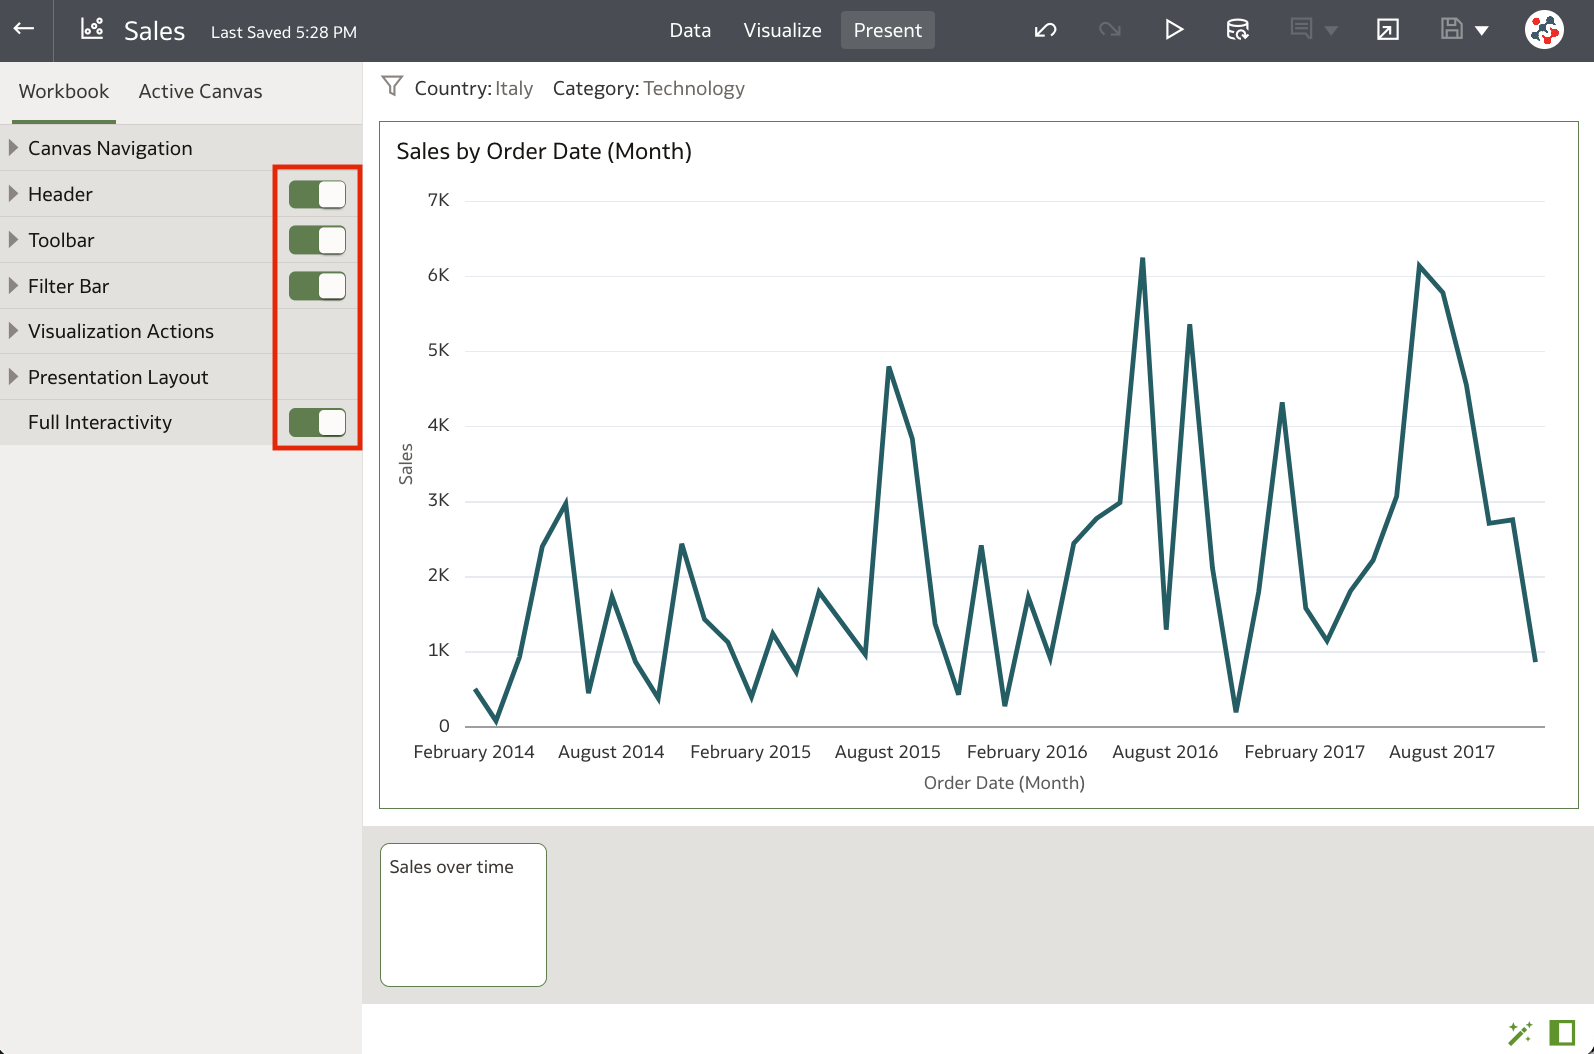
In the Workbook panel, On/Off settings have been replaced with toggle switches positioned next to the corresponding section names (Figure 6). Although it may seem like a minor adjustment, I find it particularly valuable since you can quickly identify the enabled or disabled status of components in the presentation flow without the need for scrolling or delving into each section.
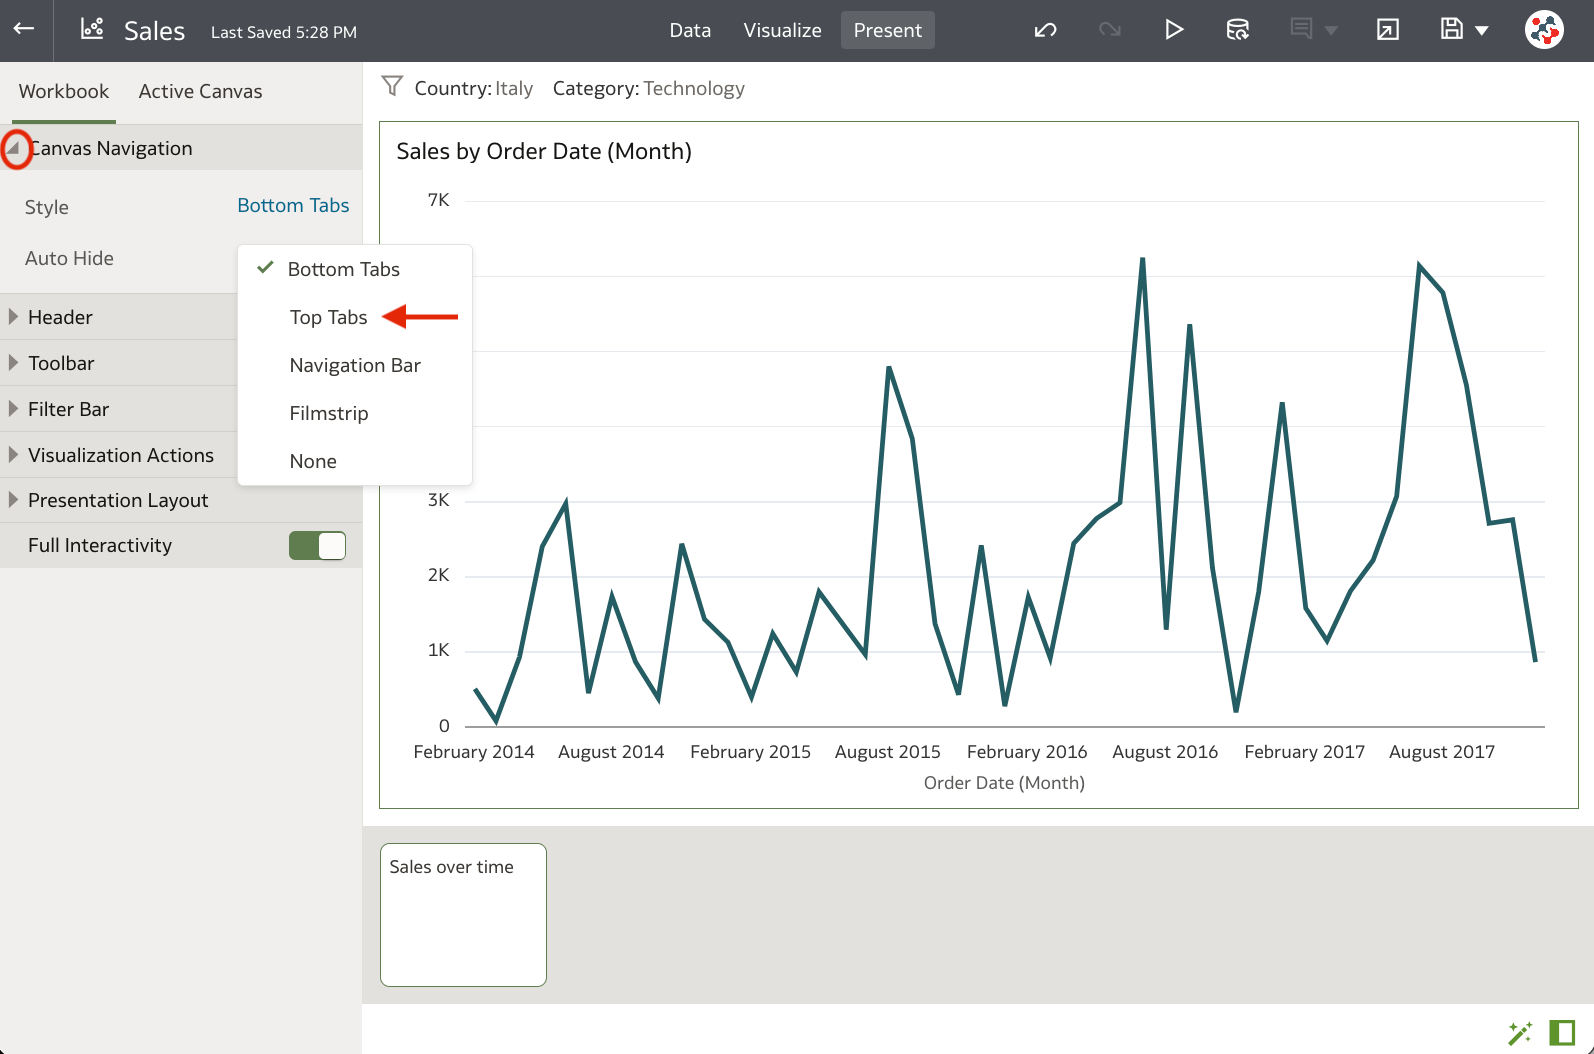
In the Canvas Navigation section, the Style setting now includes a new Top Tabs option, enabling you to showcase each canvas as a tab at the top of the presentation flow (Figure 7). While seemingly minor, this adjustment is likely to be appreciated by individuals accustomed to Classic dashboard pages.
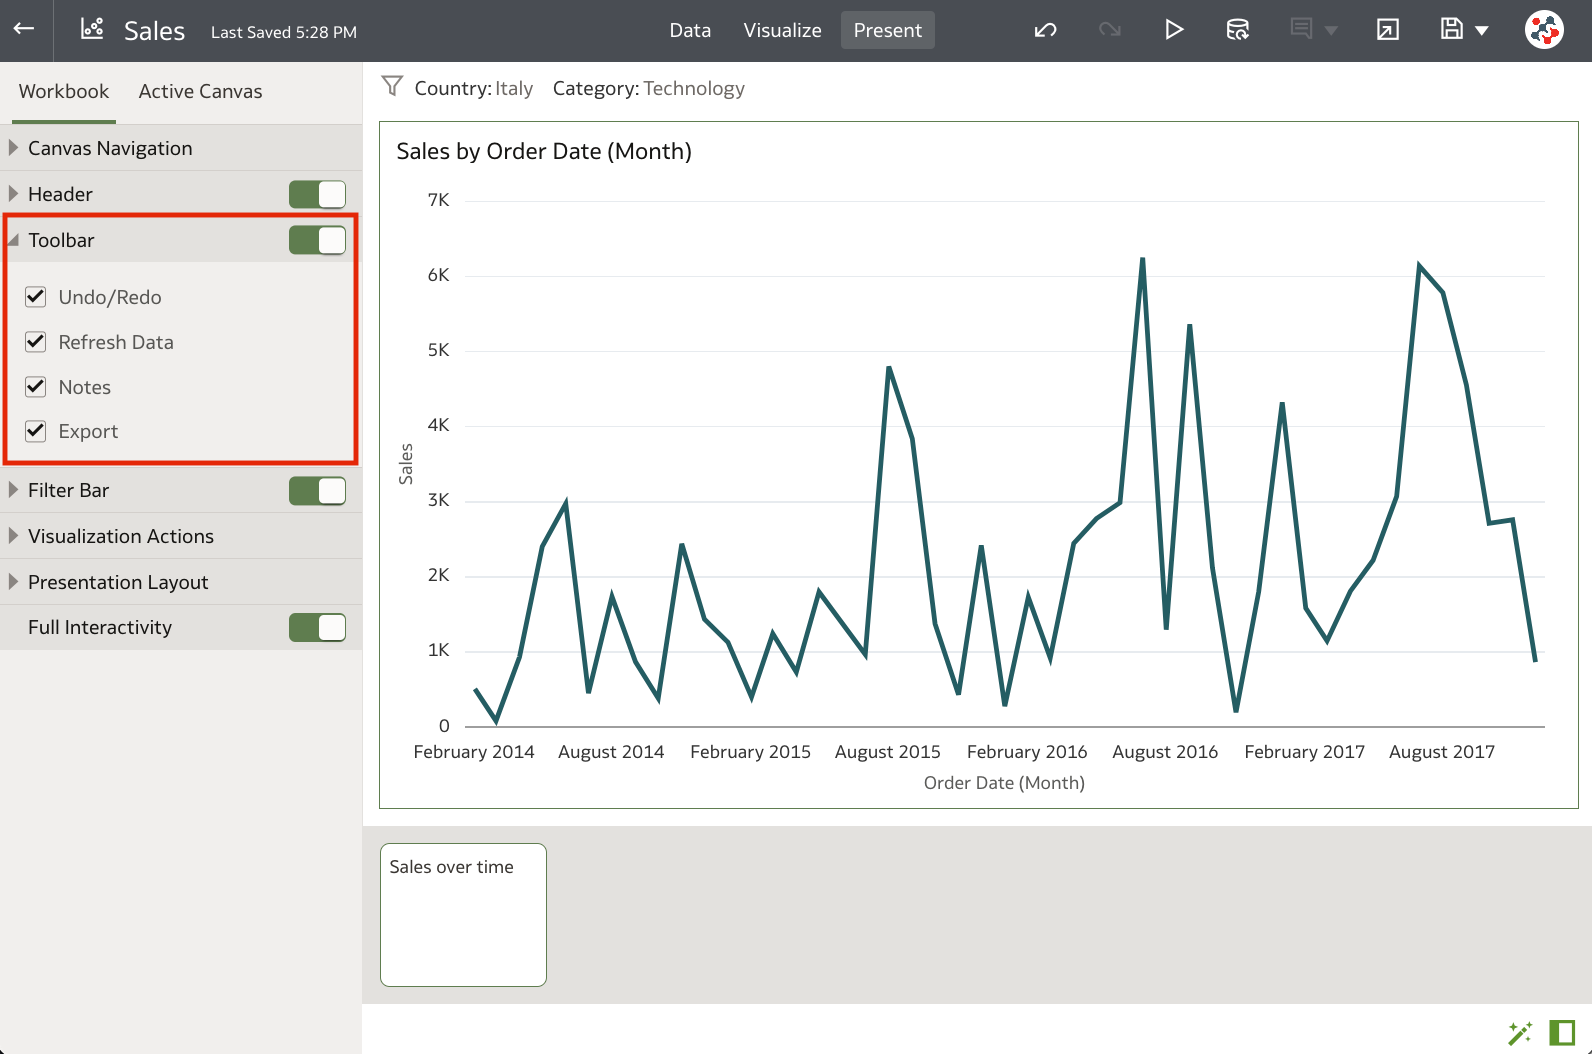
The Workbook panel now includes a new Toolbar section, providing the ability to show or hide the workbook's toolbar in the presentation flow, and eventually specify which toolbar options to display (Figure 8). For instance, you can use this feature to remove the export icon from the presentation flow.
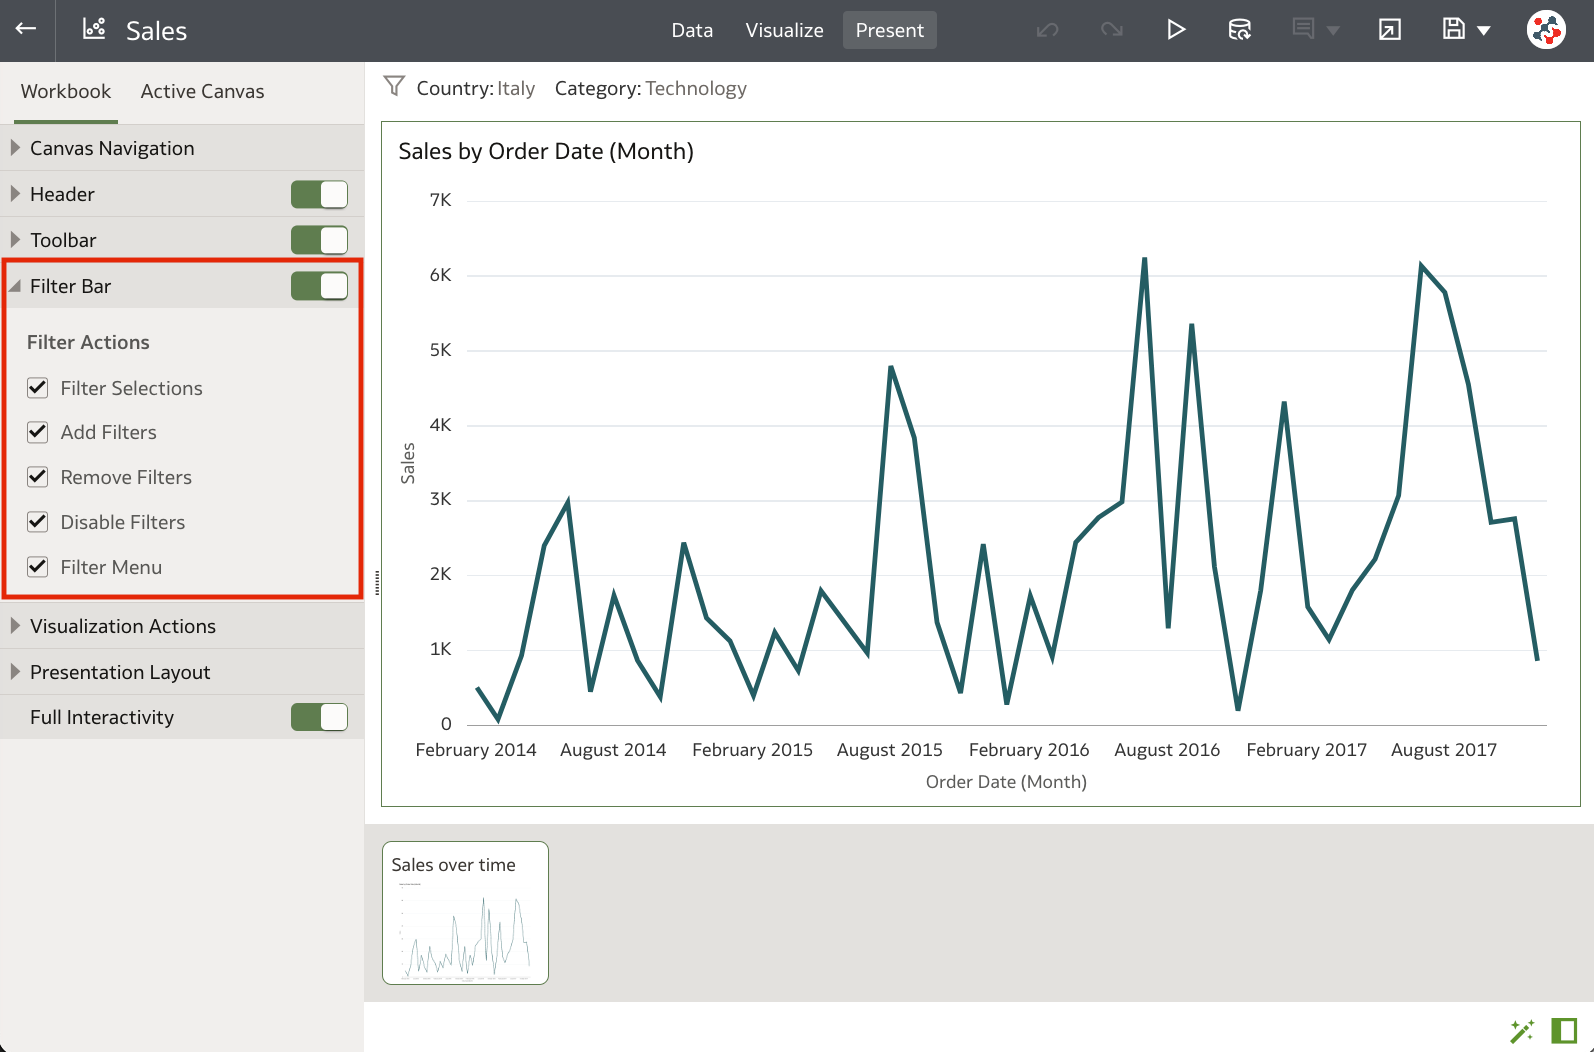
The Filter Bar section now includes various new options that enable you to define the filter interactions available to users in the presentation flow (Figure 9). For instance, you can use these options to restrict users from adding new filters to the presentation flow. It's important to note that these settings are automatically disabled and greyed out when the Full Interactivy option is set to Off.
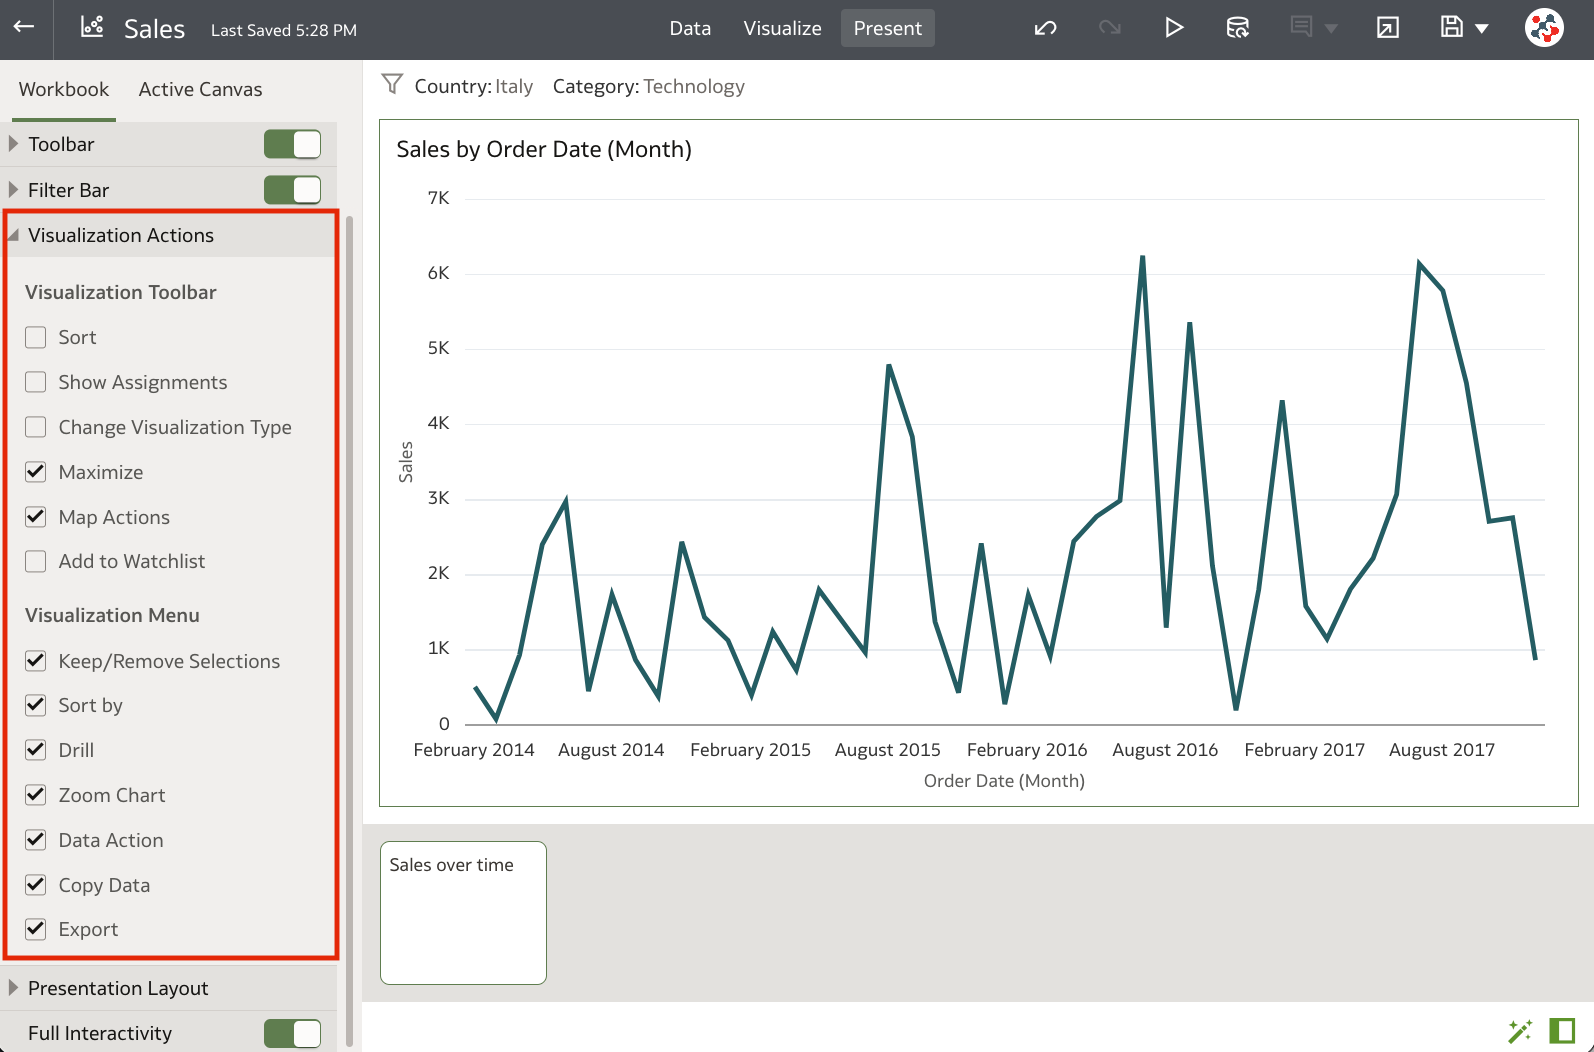
The Visualization Actions section, originally confined to the Active Canvas panel, is now also accessible in the Workbook panel (Figure 10). This feature allows you to globally enable interactions at the workbook level, and selectively disable them on a specific canvas. It's worth emphasising that these settings are automatically disabled and greyed out when the Full Interactivy option is set to Off.
Enhanced Formatting Options in the Visualize Canvas
With the November 2023 Update, the Visualize canvas introduces a range of new formatting options, enabling you to enhance the visual appeal of charts and tables within your workbooks.
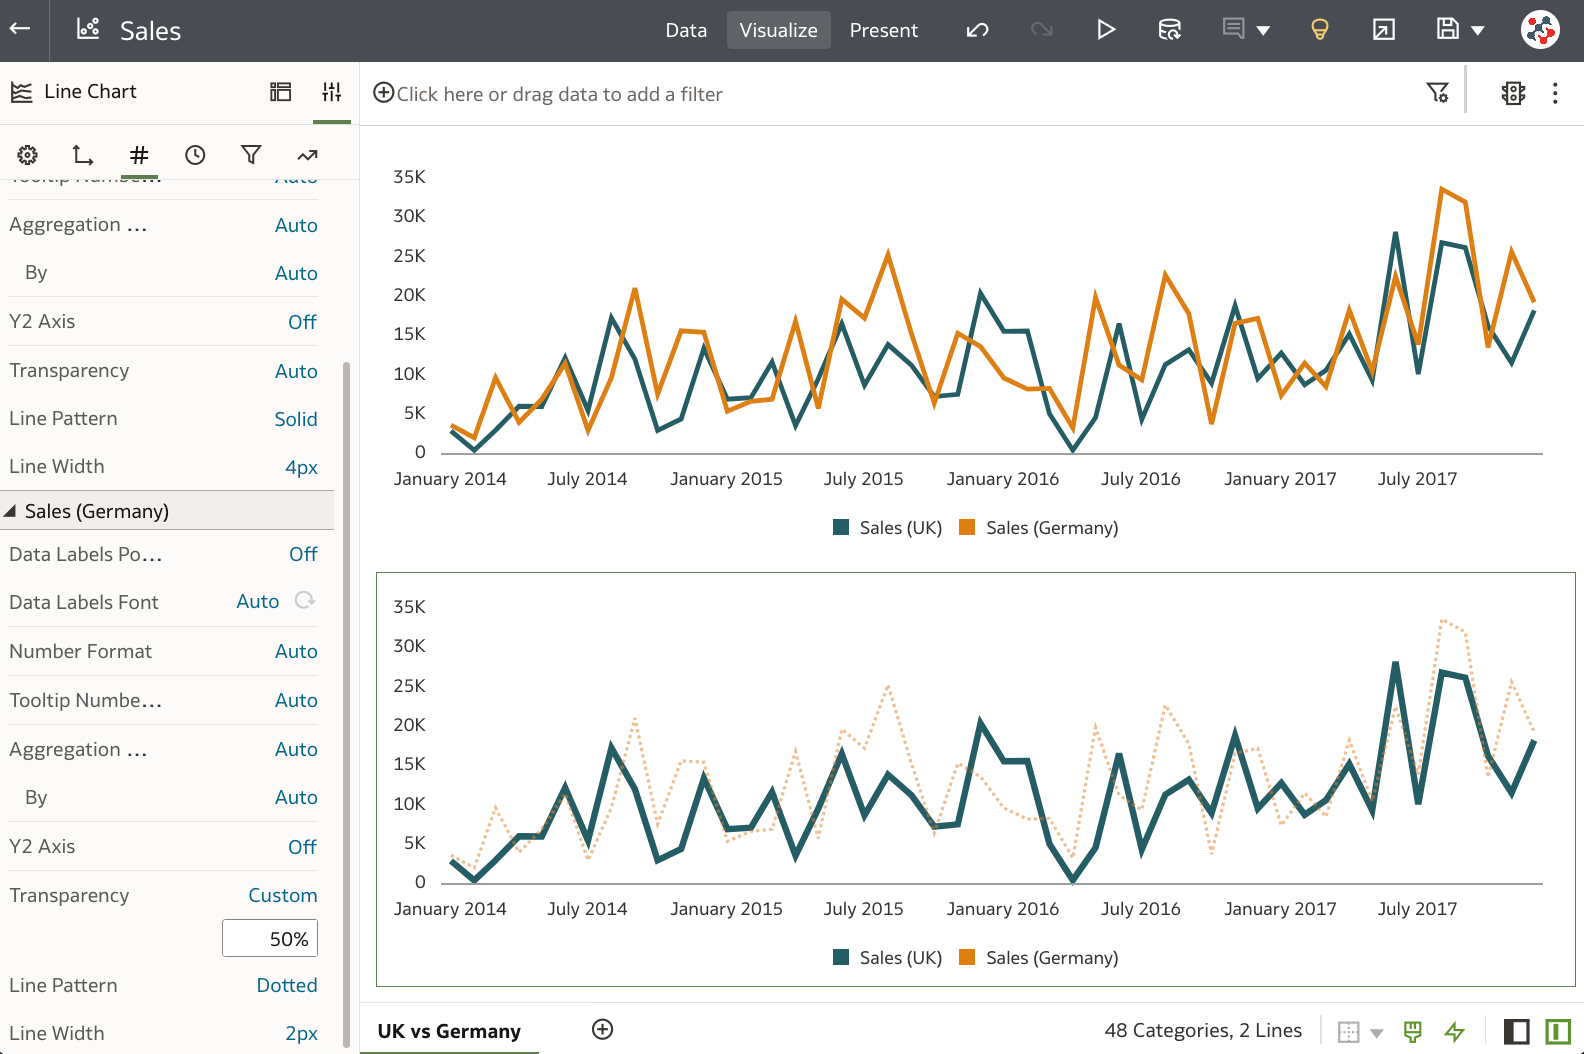
You can now specify the line pattern, width, and transparency properties for Line, Area, Combo, Overlay, and Radar visualizations. These settings can be applied uniformly to all measures in a visualization from the General tab in the Properties panel, and eventually fine-tuned for individual measures in the Values tab. I discovered that this feature is particularly valuable for improving the clarity of visualizations containing multiple lines, and emphasising a specific measure when conducting comparisons among them (Figure 11).
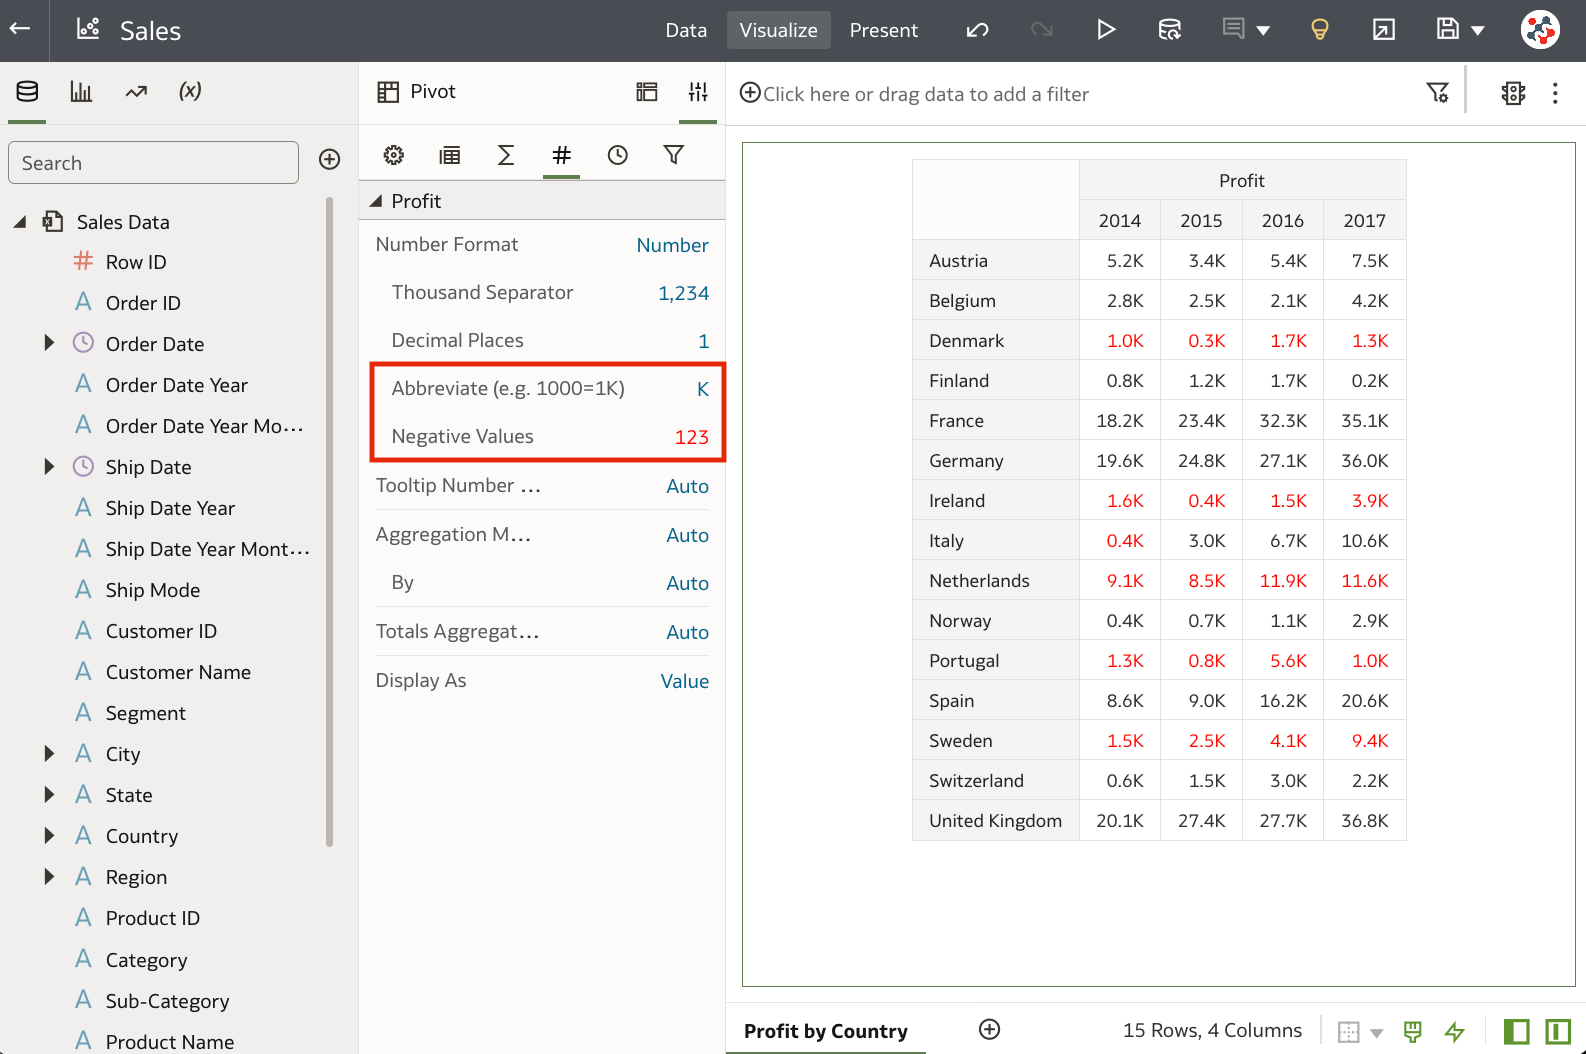
The Abbreviate property for numbers and currencies now includes additional options, enabling you to specify the scale format used for abbreviating large measure values in visualizations. Moreover, you can easily change the display format of negative numbers to red with just a few clicks, eliminating the need to create and manage conditional formatting rules (Figure 12).
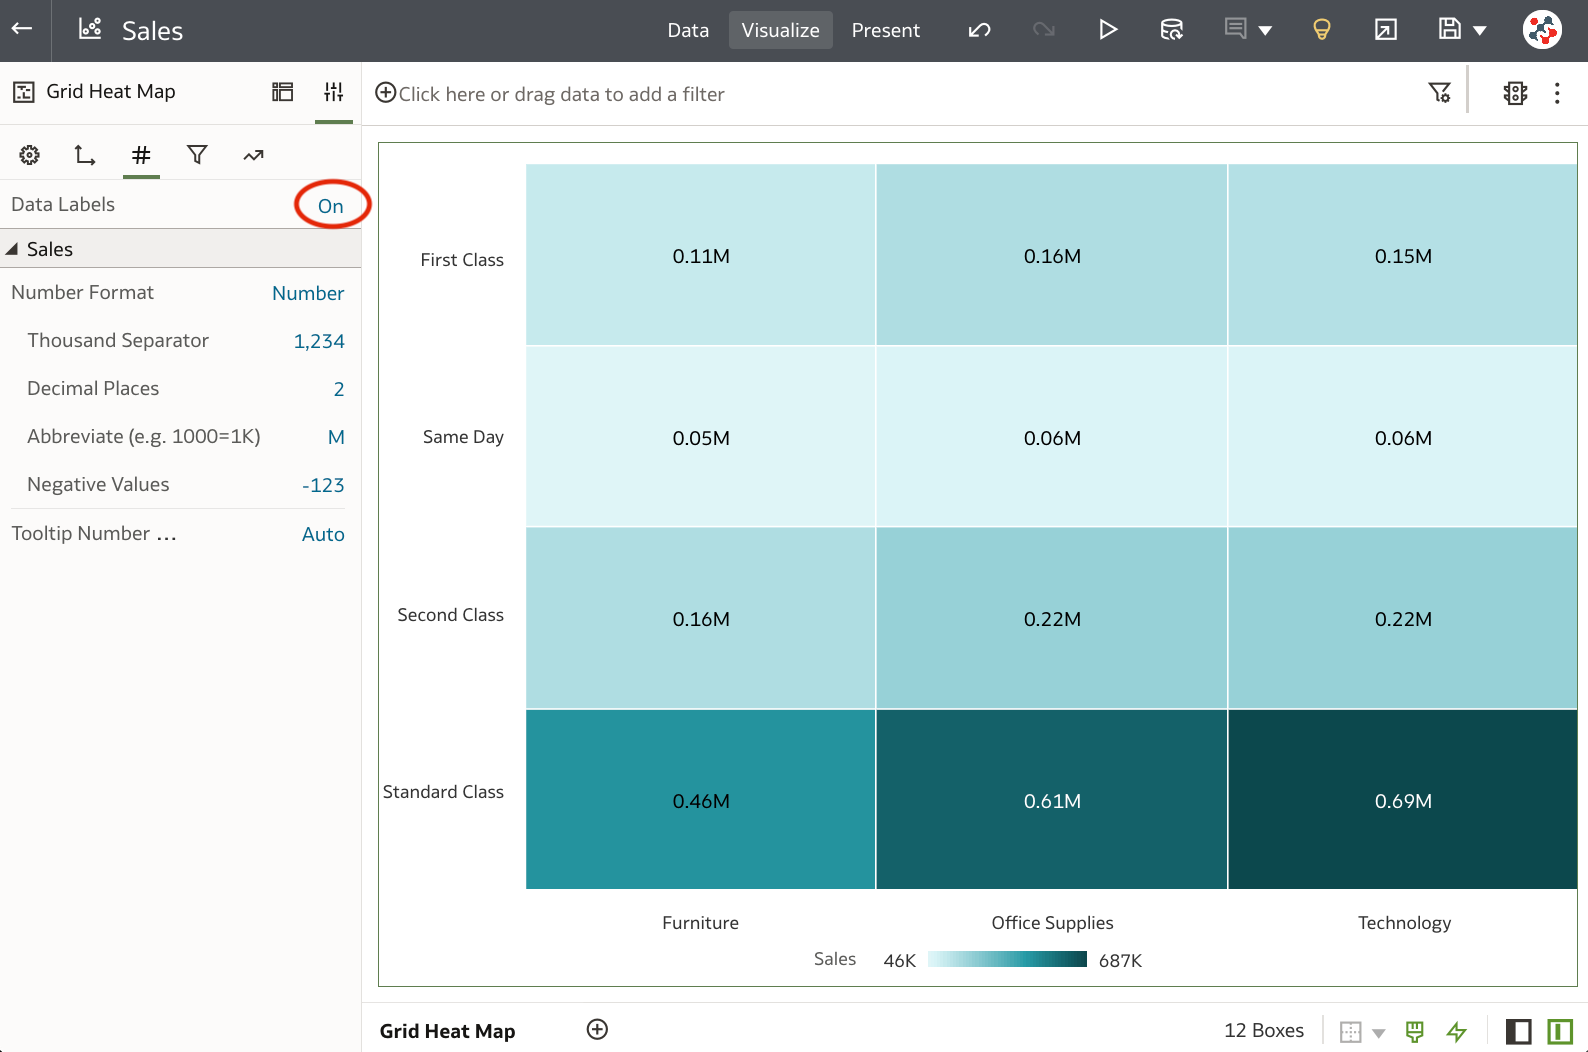
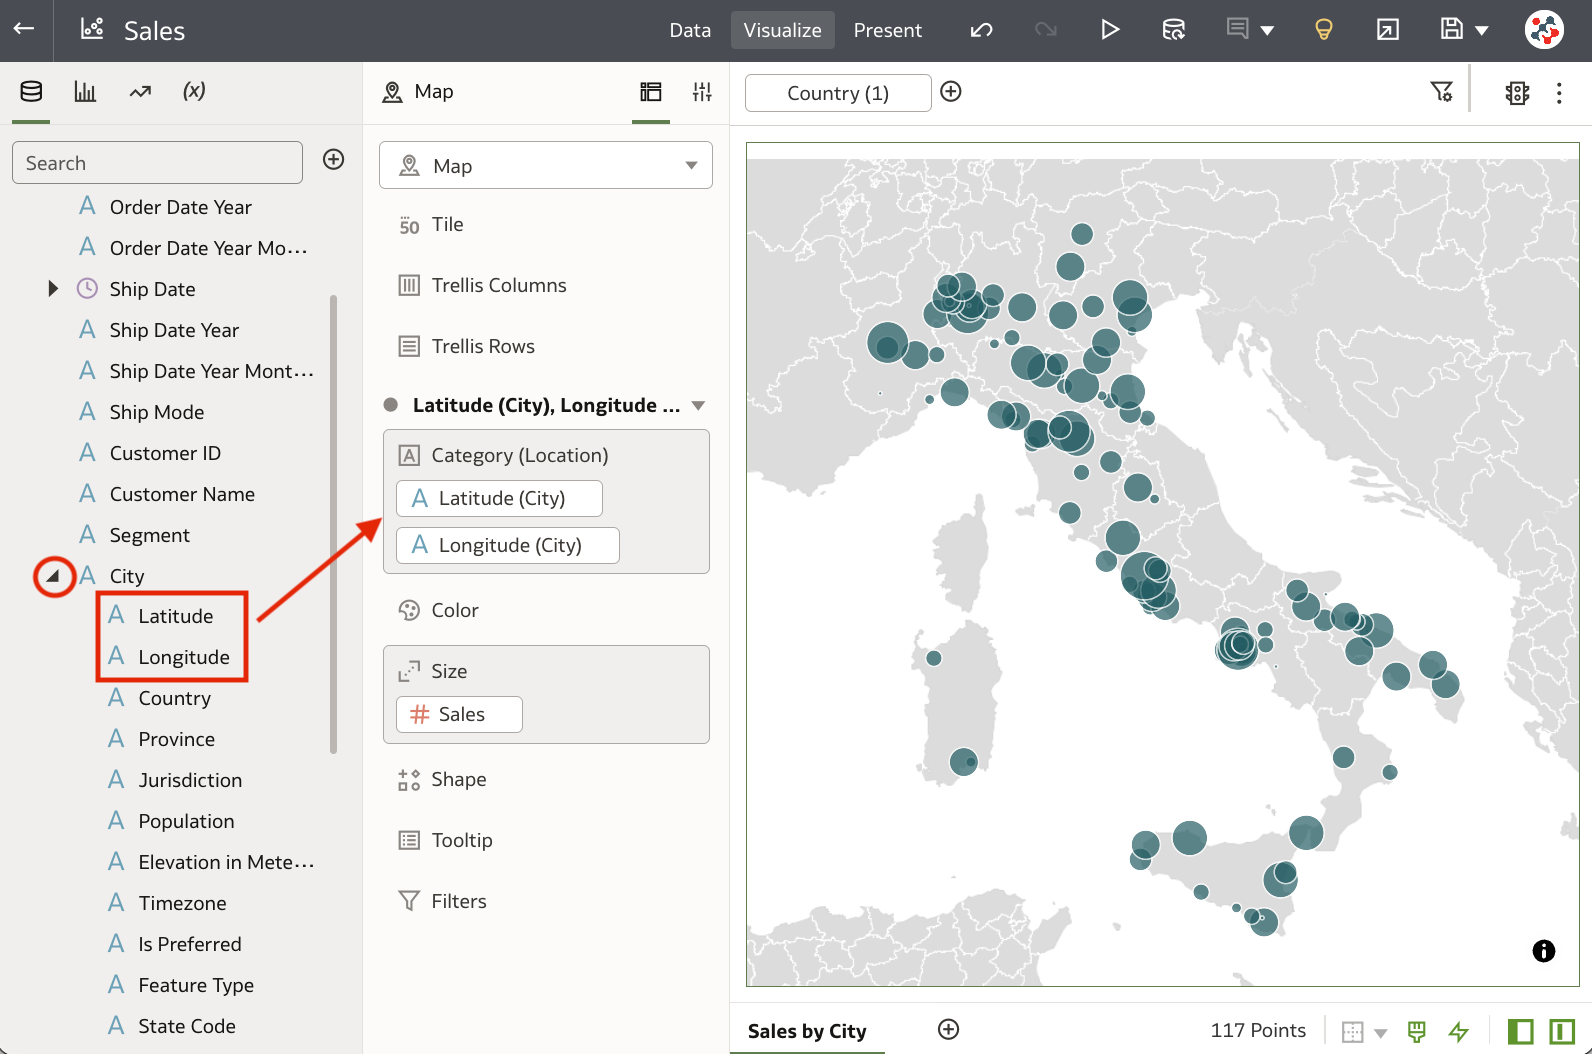
You can also enhance Map visualizations by adding outlines to emphasise the boundaries of points and shapes, and display labels with advanced properties on Treemap and Grid Heat Map visualizations (Figure 13).
Enriching Data From the Visualize Canvas
The November 2023 Update allows you to take advantage of System Knowledge and Custom Knowledge updates in Oracle Analytics directly in the workbook editor to enrich data in visualizations. Knowledge enrichments appear in the Data Panel just like regular data elements in the dataset, and can be added directly to your visualizations (Figure 14).
While Knowledge Enrichments are usually enabled by default, users with dataset ownership or editing privileges have the flexibility to enable or disable them.
Other Features
The November 2023 Update also allows users to:
- Bind parameters to a range filter's start and end (or minimum and maximum) values
- Use aliases and key values options to create parameters for subject area double columns
- Include aliases in parameters to send display values for each key value for target workbooks included in a data action
- Use the custom values, null selectors, and All values options to specify a list box dashboard filter's selection options
- Specify if the user is required to select a value for a parameter used as a dashboard filter in workbooks
- Record the names of users in service logs instead user Oracle Cloud IDs (OCIDs)
- Aggregate text columns in data flows using various predefined delimiters
- Schedule data flows more easily
- Use Delta Share and Google Analytics V4 as data sources for datasets
- Use the Semantic Modeler to generate SQL scripts that create and populate the relationship table required for a parent-child hierarchy in a semantic model
- Deploy AI Language PII identification models to mask or hide sensitive data in a dataset
- Invoke predefined OCI Document Understanding models in data flows to perform document classification and key value extraction
Desupported Features
The Data Sync is no longer supported. Oracle recommends to transition to an alternative data integration tool such as Oracle Data Transforms, Oracle Data Integrator, OCI Data Integration, and Fusion Data Intelligence Platform (or BICC for Fusion data integration).
Conclusion
The November 2023 Update includes several new features, enhancements and fixes for Oracle Analytics Cloud that significantly improve the suite. In particular, the ability to handle fine-grained permissions on objects, has overcome a significant barrier to the adoption of Data Visualization, and I'm looking forward to its inclusion in a future release of Oracle Analytics Server.
If you are looking into Oracle Analytics Cloud and want to find out more, please do get in touch or DM us on X @rittmanmead. Rittman Mead can help you with a product demo, training and assistance with the migration process.