BI Publisher has always had the ability to create reports using multiple data sets, either through appending queries together or by combining them using something called a "data template". Data Templates were tricky to set up though, so I was interested when looking through the new features in BI Publisher 11g to note that creating these types of queries is now a lot more straightforward.
To take an example, imagine a situation where I have my main data set in an Oracle database, but I want to supplement this at run-time by some data held in an Excel spreadsheet. Later on, I might also want to bring in data from a web service, or maybe an ADF view object or MDX query. Where do I start?
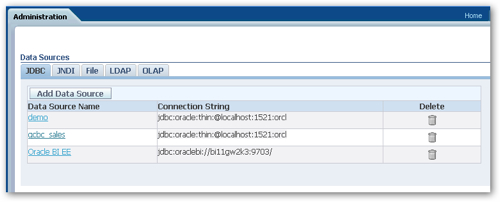
The first step is to make sure you have connections defined within the Administration part of BI Publisher 11gR1 for the data sources you want to use. At the moment, I've got the default demo connection and connection to OBIEE, and I've also got a connection through to my relational database schema.
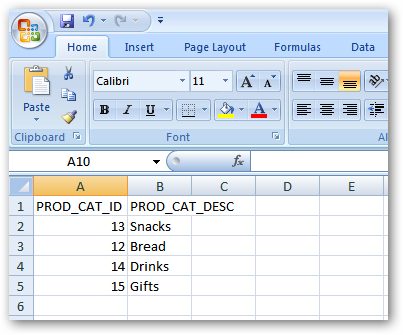
I also have some data in an Excel spreadsheet that I'd like to bring in. As I've just got one set of data in the sheet I'm working with, I don't need to define a named range (as you'd do with OBIEE-proper), I can just place it in the top left-hand corner with column names defined at the top, like this:
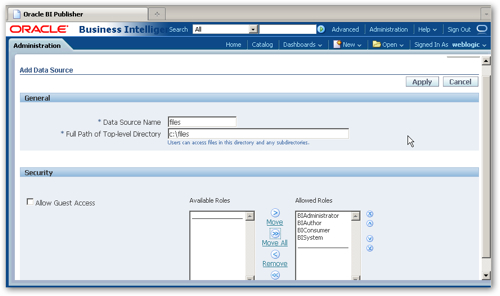
I then go back to the Data Source definition page, and create a new file source that points to the directory containing the Excel dataset.
So now I'm ready to start creating the data model. As with this previous blog post, I start by creating an SQL query using the Query Builder dialog, so that my data model now contains a straightforward query against Oracle that returns sales broken down by product and product type. Taking a look at the new Diagram tab in the Data Model screen, I can see the Oracle dataset within the current data model.
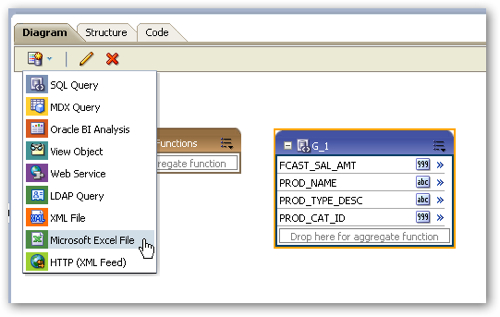
Now I'm going to bring in the Excel dataset. To do this, I use the drop-down menu in the area just under the Diagram tab, and select Microsoft Excel File as the query type, like this:
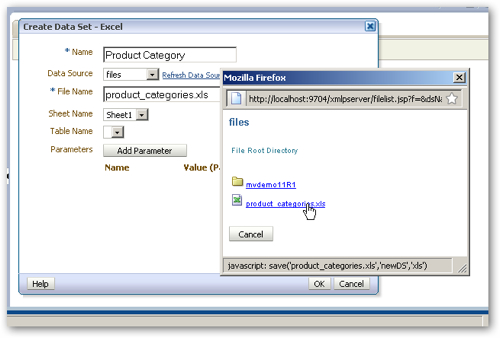
A dialog then allows me to name the new data source, select the file connection I defined a minute ago, and then using that pick up the file that contains my data. As I've not bothered with a named range, that's all there is to it.
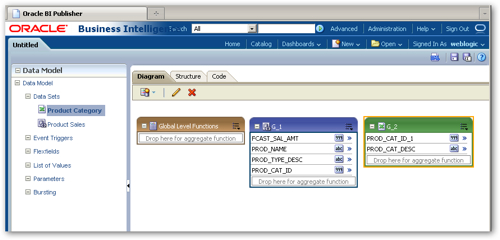
Going back to the Diagram tab in the Data Model screen, I can now see this second data source added to my model.
Now if I were to leave the model as it is, I'd be able to select from either one, or the other, data source when creating a report, which would be useful if I wanted to draw from two different queries in the one overall report. But in my case, I want both sets of data to be joined together, on the PROD_CAT_ID column that's common to both of them.
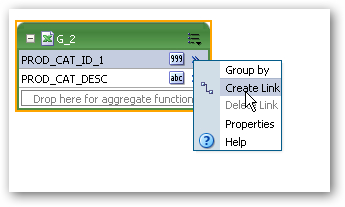
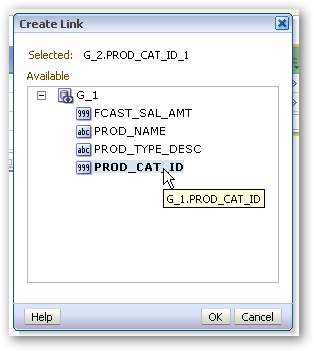
To do this, I click on the menu entry next to the PROD_CAT_ID_1 column in the Excel dataset, and select Create Link, like this:
Then, I select the column in the Oracle dataset that I want to join to, like this:
Notice that this isn't as sophisticated as the federated query features in OBIEE proper. You can't specify inner or outer joins, you can't specify at which level of aggregation the join occurs, and so on, but it's a good, basic way of joining together queries that are already compatible and are at the same level of detail.
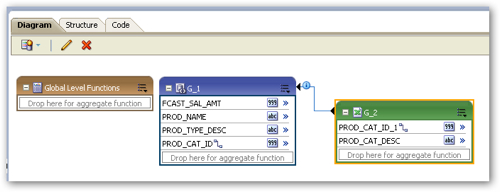
Once the join is complete, the data model now looks like this. It's important that you join from the master table (the Excel file, in this case) to the detail one, so that the nesting in the XML is set up correctly.
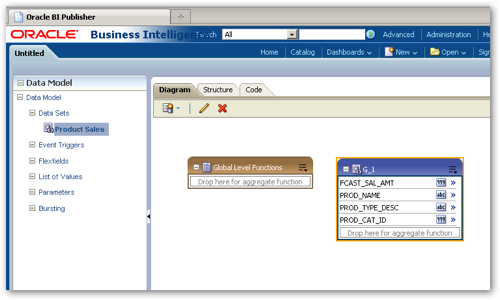
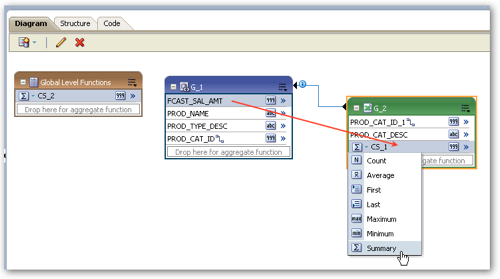
Now that I've got a master-detail link, I can define additional columns in the master table to contain aggregated measures sourced from the detail table. To do this, I drag and drop the FCAST_SAL_AMT column from the Oracle, G_1 dataset and drop it onto the Drop here for aggregate function area of the Excel, G_2 data set, and then use the drop-down menu to set the aggregation to Summary, like this:
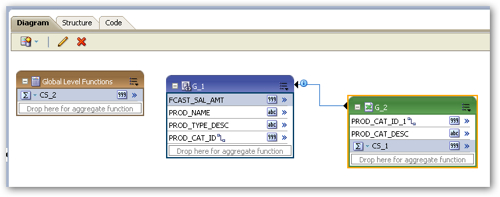
I repeat this then for the Global Level Functions data set, so that my final data model looks like this:
I then return to the Structure tab and set display names for these two new columns, and then I'm ready to generate some XML test data.
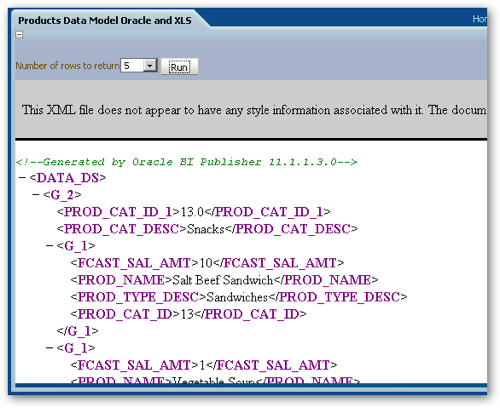
You need to generate a sample XML data set, so that the Online Template Builder can show actual data when you start to layout the template. Do create this data, I press the Get XML Output button in the top right-hand corner, select 5 rows of output, and then check the output XML. The detail-level data should be nested within the master-level data, which is what I can see in this case.
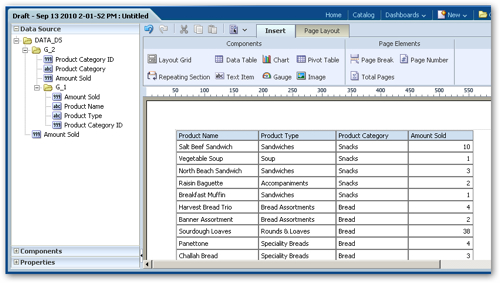
So once this is all saved to the web catalog as a data model definition, I can create a new report and start to lay out my template. As you can see from the screenshot below, the repeating (detail) data is nested within the master data, and I can drag and drop fields from the template builder onto, in this case, a data grid template component.
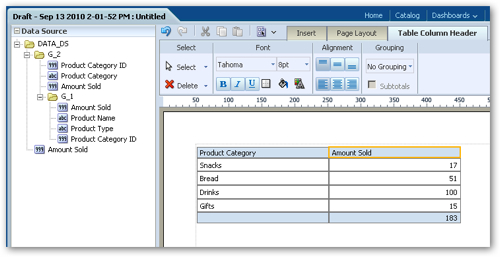
I can also use the aggregate measure within the master set of fields (in the screenshot below, G_2.Amount Sold) to provide totalling at the product category level. I can also do the same thing at the whole dataset level by using the Amount Sold field right at the bottom (in reality, you might want to amend their display names to reflect the level of aggregation they work at).
So there you have it. You've got a fairly easy to set up, simple way of creating federated queries across data sets, which can span traditional types of sources such as Oracle and SQL Server databases right through to web service calls and MDX queries against Essbase. It's not as sophisticated as the federated query feature in OBIEE but if you're using BI Publisher standalone, it's a nice and easy way to combine data in a report when your data is straighforward. See also this previous blog post on the Interactive Viewer feature in BI Publisher 11gR1 for more new features in this release.