Oracle Endeca Week : How Do You Develop Endeca Latitude Applications?
In this final posting in Endeca week, we're going to look at the process of creating applications using Endeca Latitude, or as it's now known, Oracle Endeca Information Discovery. Although the individual steps are different, the process overall isn't all that different to creating a data mart or an Essbase cube. Details and tutorials are a bit thin on the ground, but hopefully with this last post in the blog series, you'll at least get to see the overall process and the tools that you'll use. Before we start though, here's a recap of this week's posts:
- Day 1 : So Just What is Endeca?
- Day 2 : What is the Endeca MDEX Engine?
- Day 3 : Where Does Endeca Fit with Oracle BI and DW?
- Day 4 : How Do You Develop Endeca Latitude Applications?
Traditional BI development techniques tend to spend a lot of time at the start, and at the end, of the process. You spend a fair bit of time developing a dimensional model, aggregation rules and strategies, with the actual mechanics of the ETL bit hopefully then being simple. Once you're done, you spend the rest of the time developing reports, analyses, dashboards and so on. With Endeca Latitude, the data modeling part, and the dashboard building part, are relatively simple, and it's the ETL bit that takes the time.
A typical flow of tasks for a Latitude project is as follows:
- First you use Endeca Latitude Integration Suite to load data into the MDEX engine (this is the bit that takes the time)
- Then, you use the configuration web service to configure the MDEX record schema and MDEX engine features
- Next, you create the Latitude Studio application, and then
- Finally, you use the administration web service to set up monitoring and backups
In this blog post, we're going to look at the first and third steps - using the Endeca Latitude Data Integrator tool, part of Information Integration Suite, to get data into an MDEX engine, and then using Studio to create a search and analysis web application. This is only a high-level look, but we're also working on a more step-by-step demo that hopefully will run on OTN or a similar site - watch this space.
So the first task that you'll need to perform is obtain your data, and then use Endeca Latitude Data Integrator to ETL it into an MDEX engine. If you've used tools such as ODI or OWB, you'll be familiar with the concept of a graphical ETL tool, and Latitude uses an OEM'd version of the open-source CloverETL tool for this task. Using Data Integrator, you either import or create references to your source data, define metadata for it such as the column structure, then create mappings, or "edges" between the source data and either transformation operators, or operators that load data into the MDEX engine. In the screenshot below, you can see a typical "graph" loading data from some source files into an MDEX engine, using the bulk-load writer transformation.
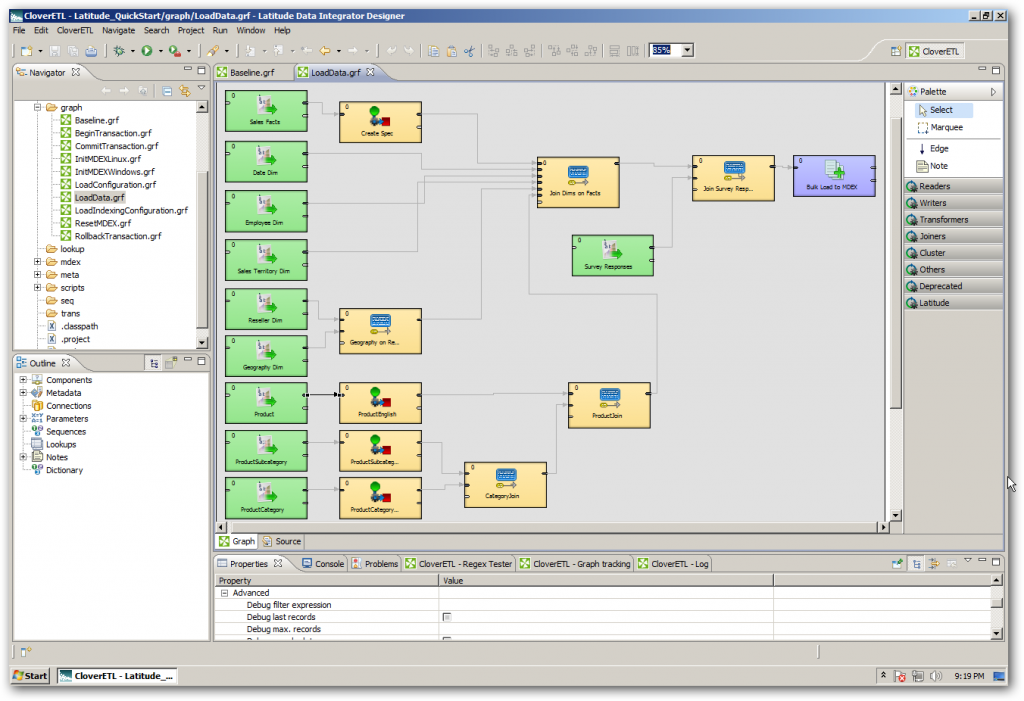
Loading up the MDEX engine is like loading an Essbase cube, in that all the data you need to use in the analysis will need to be in the MDEX, and depending on how you configure it, either all or part of it will be held in the in-memory cache, with the data being persisted to an column-store, compressed on-disk database. Once you've got some data together, you can then start up the Endeca Studio Server and log into Endeca Studio.
Endeca Studio is a web-based environment that presents you initially with a blank canvas, to which you can add pages and Studio components. These components communicate with MDEX via web services, and you add them from the Control Panel > Add Component in Studio, like this:
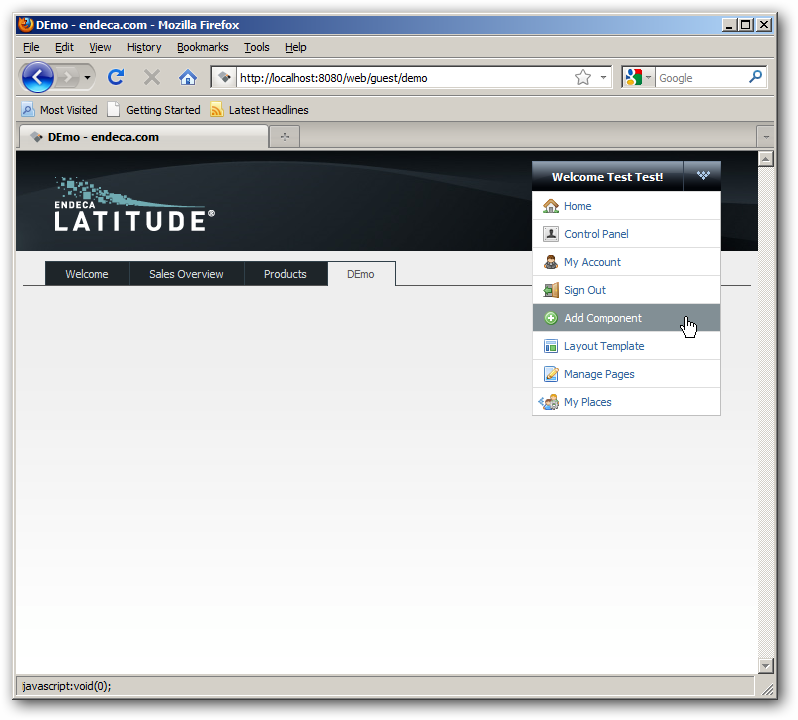
Selecting the Components option brings up a dialog listing the various Studio components you can add. Typically, you'd divide the canvas into two columns, the left-hand one thinner than the right-hand, and add search, breadcrumb and guided (facteted) navigation components to this side.
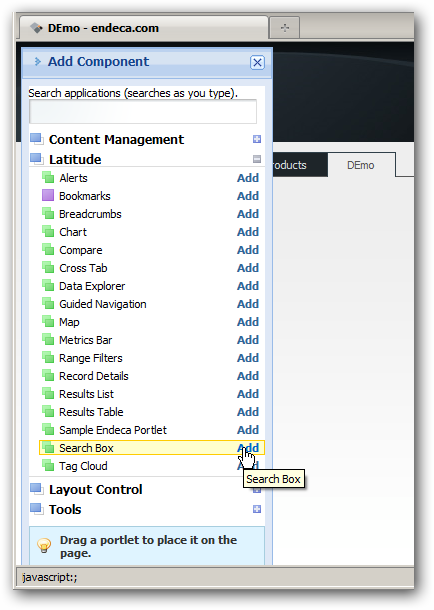
Then, you'd start adding visual components such as word clouds, record lists, metrics bars and so on to the main part of the screen. In the example below, we're using LQL, the Latitude Query Language, to define the query for a chart component:
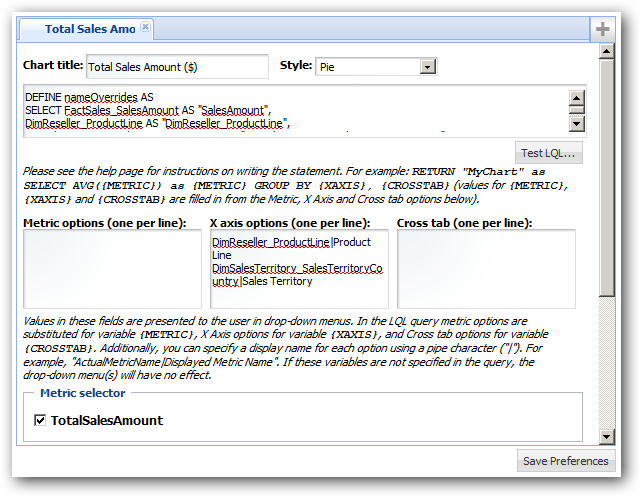
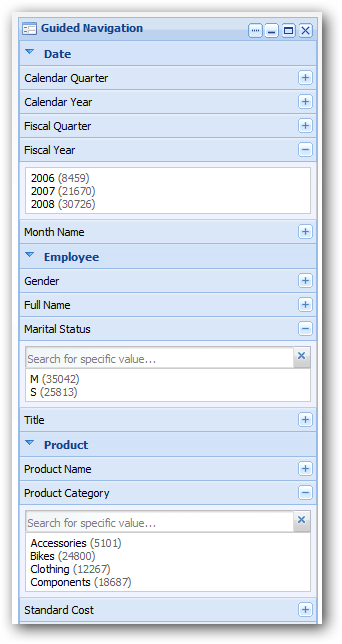
Once you've done the hard work of getting your unstructured, semi-structured and unstructured data into MDEX, parsed and combined it, creating the Studio application is the easy bit. Typically, you'd add some navigation elements to the left-hand side, such as a search bar, breadcrumbs (selected criteria) area, and the guided navigation control that's common to most Studio applications:
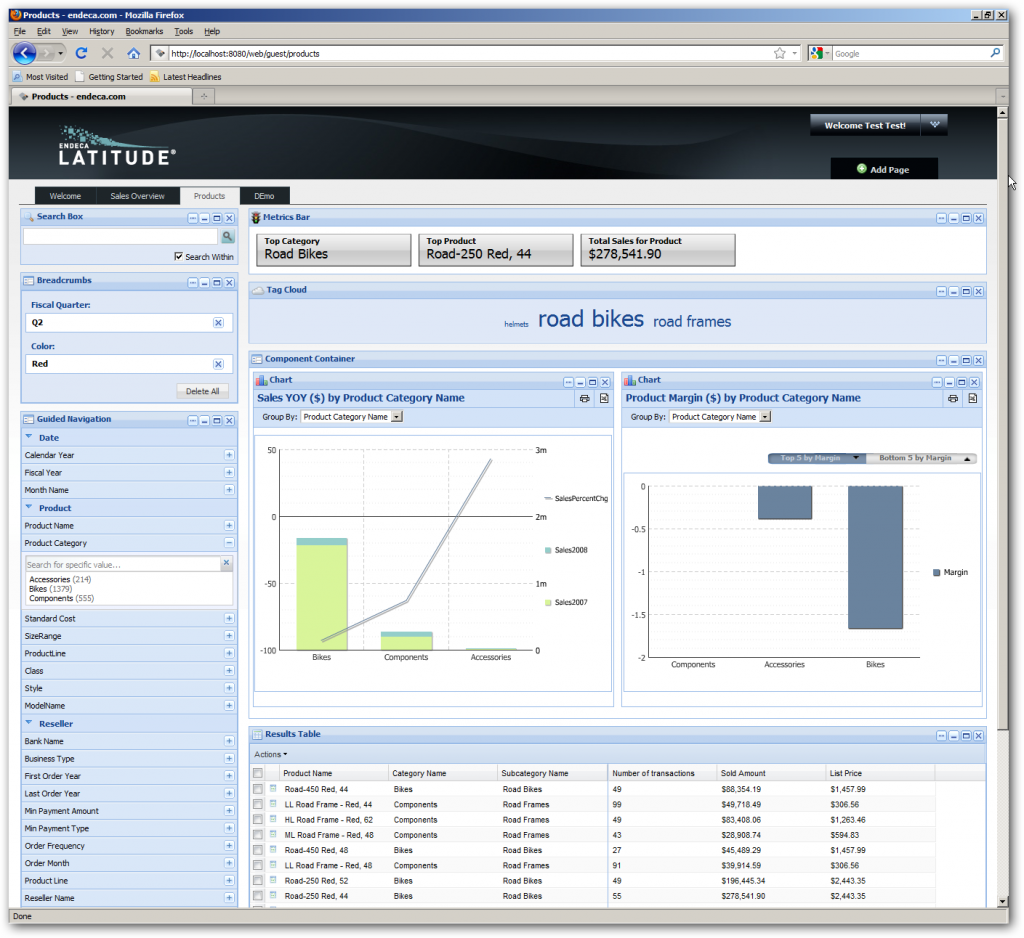
Finally, once you're done, the application would look something like this, with navigation down the side, visualizations on the rest of the page, and multiple pages of information. As you click on the guided navigation items, the controls on the right are automatically filtered, in a similar way to Qlikview, or the new high-speed visualizations provided with Exalytics.
So that's an overview of the Endeca Studio and MDEX development process. If you're interested in downloading the Endeca Latitude software, it's now called Oracle Endeca Information Discovery and you can find it for Windows x64 and Linux x64 over at http://edelivery.oracle.com - start with Oracle Endeca Information Discovery Quick Start (2.2.2) for Microsoft Windows x64 (64-bit) and the product documentation, and you can set up the same Quickstart demo that I've been running here.
That's all for Endeca, at least for now - next week, we'll be taking an in-depth look at Oracle Exalytics BI Machine.