HPCM 11.1.2.2 - Detailed Profitability

2 Weeks back, EPM 11.1.2.2 released with a lot of new features. The number of new features are so much so that it will take at least 8 to 10 posts to go over all them in detail. I thought i will start off with writing about a new feature that is relevant to a project we are executing currently i.e. HPCM Detailed profitability. If you had looked at my previous post on HPCM here(which i will refer to as Standard Profitability), i would have walked through how HPCM works and how Essbase plays a vital part in the functioning of HPCM. Though it is & was a great product, there were certain drawbacks in using Standard Profitability. I will list them below

  1. Use of Essbase added un-necessary complication in data loads & reporting

  2. Essbase though was very good, the calculation scripts generated by HPCM warranted minimal exception based driver assignments (single-cell driver assignments) as that can slow down the calculations

  3. Though the concept of stages was very good, to me for simple models exposing a lot of stages to end users was not only confusing but also results in a bloated Essbase cube.

  4. In a 8 stage model with intra stage allocation enabled (and each stage having 3 dimensions), the Essbase database will have a total of 16*3=48 dimensions. A block storage cube with so many such dimensions generally does not scale well at all.

  5. Using BI EE to report out of a HPCM cube requires carefully applied filters. It requires a very good understanding of not only Essbase & BI EE but also how HPCM stores data within Essbase.

  6. There was no easy way to do a direct integration from relational tables - So all data before getting loaded into HPCM had to be processed externally to fit into Essbase formats.

  7. Standard Profitability had a restriction of 3 dimensions per source stage. In many cases we might need more than 3 source dimensions per stage.

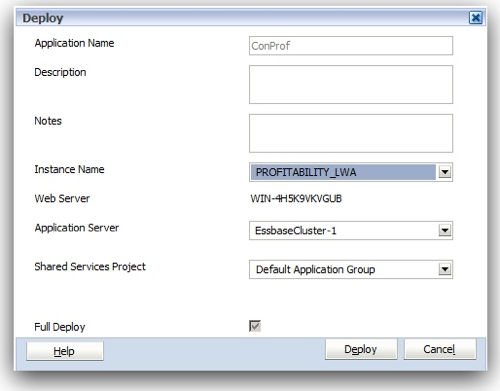
With the introduction of Detailed Profitability, Oracle has tried to address all the issues above by moving away & using relational databases for storing input & calculated data, instead of Essbase. According to the docs, this results in extremely high scalability as it supports unto 5 source stage dimensions & upto 25 target stage dimensions. Also, Detailed Profitability supports only 2 stages instead of the standard 8 stages. More importantly, Detailed Profitability is not a replacement for Standard Profitability. Rather it is another way of doing Profitability & Cost Management as Standard Profitability has its own advantages as well. In this post, we shall look at how Detailed Profitability works and how it is different from Standard Profitability.

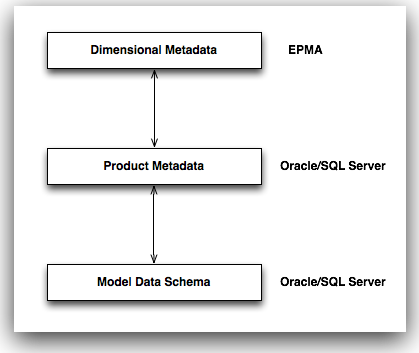
Concepts of allocation, driver etc remain the same in both types of applications. But the key difference is in the architecture. At a high the architecture for Detailed Profitability is given below

NewImage

As you see, by default when we create an application, the product install/configuration schema will be used as the Product Metadata schema. This schema will contain all the necessary tables for holding the Metadata like Models, Stages, Dimensions etc. The Model Data Schema replaces the Essbase ASO-BSO cubes in the older Standard Profitability application. So, to create a Detailed Profitability application we start off with building an application from EPMA as shown below

NewImage

As you notice, we have a small new check box called Detail Application. This is what enables the Detailed Profitability Module. Then as before we start building the dimensions for the new application.

NewImage

There is one thing we can notice. There is only one Local System dimension called MeasuresDetailed. There is no AllocationType dimension.

NewImage

Other dimensions and the order of members etc all remain the same.

NewImage

NewImage

Lets now open the application and understand the workings of Detailed Profitability. By just opening the application we can notice 3 main things

NewImage

1. There is no separate Trace Allocations screen - Interesting as this was one of the most important points that Oracle/Partners like us showcase while demoing the product. But again from a practice standpoint i think it is one of the least used features by power users.
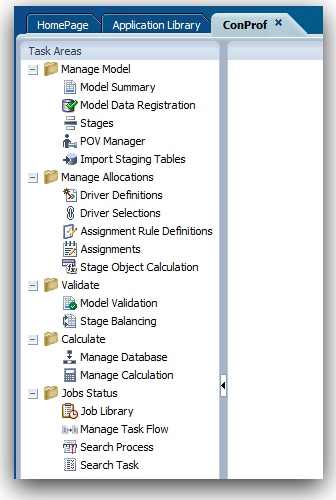
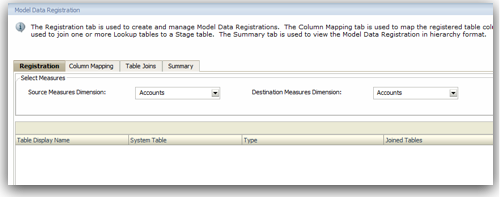
  1. There are a couple of new features like Model Data Registration, Stage Object Calculation etc which will take a look later in the article

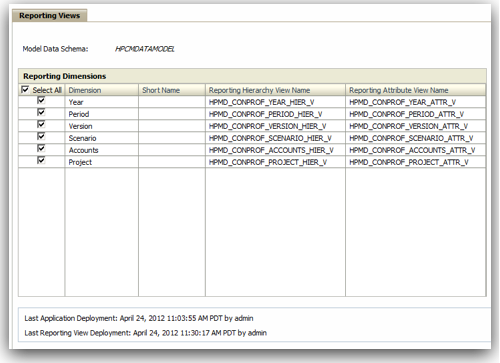
  2. Manage Database option is still there though Essbase is not there - Manage Database is used to deploy the reporting views (that supersede Essbase in Detailed Profitability)

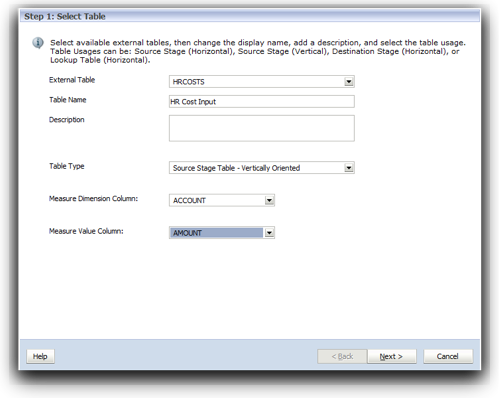
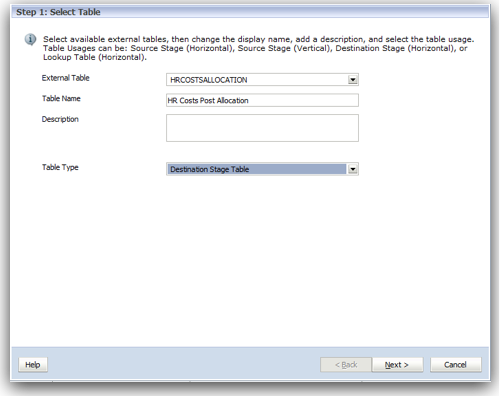
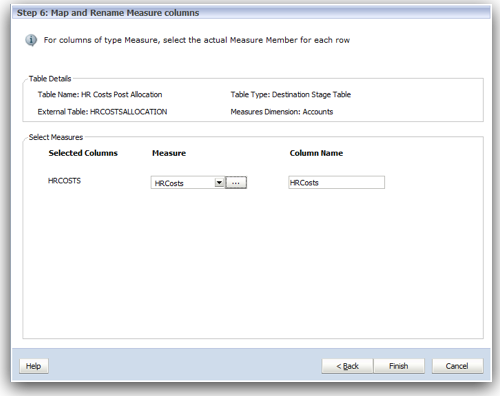
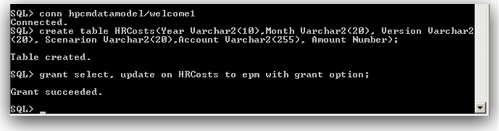
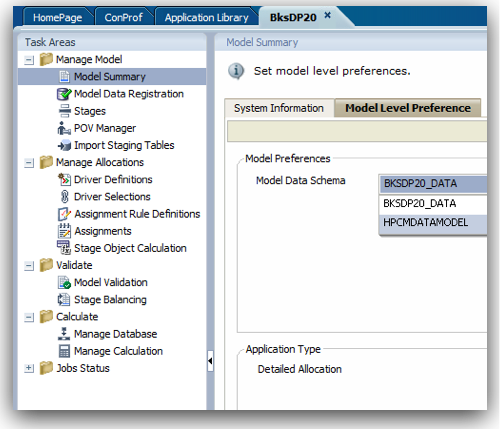
The first step in defining the Model is to associate the Model Data Schema to the model. I was sort of expecting a profile to be created to point to a specific database schema, That is not the case. Instead, we will have to create a separate database schema and then create all our necessary source/target tables within that schema. Grant select/update access on all these tables to the main product schema. Once the grant is done, the schemas will start appearing in the Model Summary as shown below

NewImage

NewImage

Once we have chosen the Model Data Schema, we will have to register all the tables that we are going to use as a source & target as part of the Model Data Registration. This is where Detailed Profitability scores higher than the Standard Profitability. In most practical customer scenarios, all cost/revenue related data will be coming in directly from ERP sources (like GL). In such cases, it is easier to model them directly on the source tables rather than using a separate Essbase data source. Another most important aspect of the registration process is in ensuring that we have a source and destination measure dimension. A measure dimension is what qualifies the incoming and outgoing costs. Other dimensions are considered as attributes of the measures. We can have the same dimension used for source as well as destination.

NewImage

NewImage

As you see there are 3 types of tables
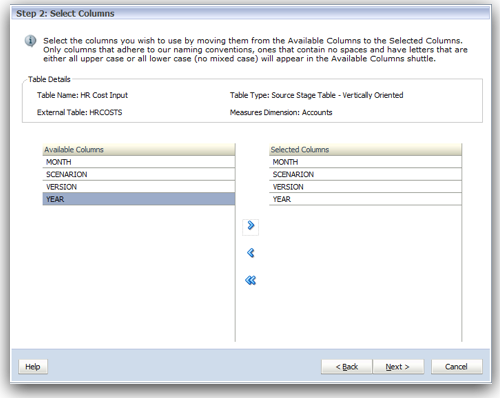
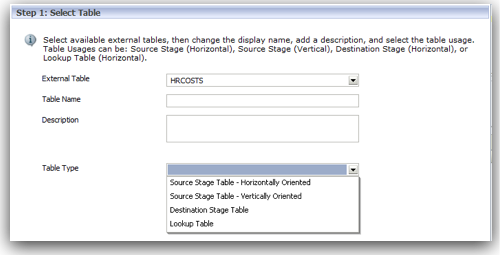
  1. Source Tables - Vertical Or Horizontal

  2. Destination Tables - Horizontal

  3. Lookup Table - Horizontal

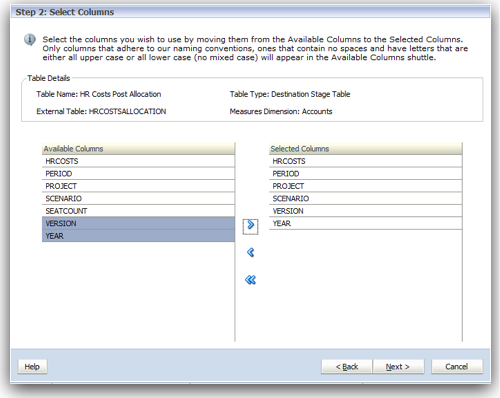
A vertical table means the measures are stored in a separate dimension instead of separate table columns (similar to Essbase measure dimension). Horizontal table means all measures are represented as columns. This designation is needed as Essbase is now superseded by Relational Tables.

NewImage

NewImage

NewImage

NewImage

In the same map the target the HRCostsAllocation table to Target Horizontally oriented table type.

NewImage

Few things to remember while mapping a Destination Stage Table - It has to have a Working column with a numeric data type. It also should have a primary key constraint.

NewImage

NewImage

NewImage

NewImage

We now have the source and the destination defined. Lets now define the stages. As mentioned Detailed Profitability has only 2 stages (Source & Destination) as against a possible 8 stages in the Standard Profitability.

NewImage

NewImage

Lets now define the driver HeadCount as shown below

NewImage

If you notice, there are a few things that have changed in the Driver definition screen. In the older HPCM, we will just be choosing the Driver Measure and then will be assigning the priority along with the location (source, destination, global etc). But here, since it is relational, we have a destination measure that has to be the driver. In addition, the driver is associated with an actual measure that will be used as a target for all allocations. If a measure is assigned at a driver level how do we then assign target intersections? That is all done through Assignment rules in Detailed Profitability.

NewImage

After the assignments, lets deploy the views required for reporting

NewImage

Lets now run the calculation

NewImage

If we now look at the Destination table, we will see the post allocated results as shown below

NewImage

This to me is so much easier to work with when compared with Standard Profitability. The allocations are a lot more clearer and of course we still have the same flexibility as the Standard Profitability. The most important aspect from my standpoint is the ability to do out of the box reporting using BI EE. This does not require separate custom Essbase models unlike the Standard Profitability.