Creating an Oracle Endeca Information Discovery 2.3 Application Part 3 : Creating the User Interface
In the first part of this three part Oracle Endeca Information Discovery 2.3 development series, we first looked at why you would build an OEID application, and then went on to look at how you load data into the Endeca Server, the hybrid search/analytic database that powers all of the Endeca application. Here's the links to all of the articles in this series, in case you've come straight here via a Google search.
- Creating an Oracle Endeca Information Discovery 2.3 Application Part 1 : Scoping and Design
- Creating an Oracle Endeca Information Discovery 2.3 Application Part 2 : Preparing and Loading Data
- Creating an Oracle Endeca Information Discovery 2.3 Application Part 3 : Creating the User Interface
At the end of the previous post in this series, we'd loaded records into the Endeca Server datastore sourced from a relational fact table, along with dimension attribute data from some dimension table file exports. At this point though whilst the system is usable, the record attribute names are as they came in from the file export, and there's no logical grouping of attributes into dimensions or functional areas. There's also some extra work we need to do to configure indexing and searching on the datastore records, tasks that we can either do through Integrator graphs that call the Endeca Server web service APIs, or we can do this using Oracle Endeca Information Discovery Studio, an application server and dashboard development environment that's used to administer the Endeca Server as well as create the end-user search interface.
So let's take a quick look at Oracle Endeca Information Discovery Studio, or just "Studio" as we'll call it from now. Studio is currently built on the open-source Liferay Portal framework, but over time I'd expect this to move to Oracle technology, as the charts and visuals already have done in the 2.3 release. The data visualisation portlets are built to the JSR286 standard, and the whole thing runs as a Java application in a Java application server, by default Tomcat but also installable in Oracle WebLogic Server 11g and IBM WebSphere 7.
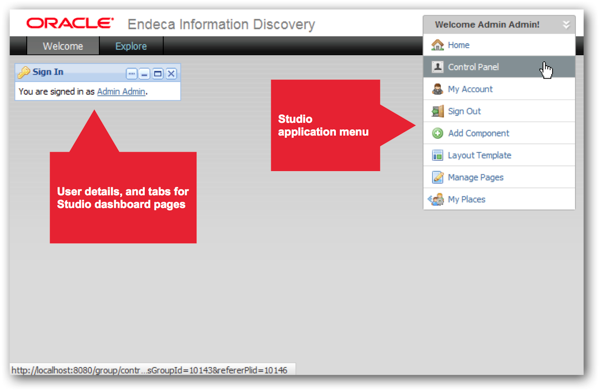
To start using Studio you first start the Studio server, and then log into the web-based administration and development environment, where you're presented with a sign-in portlet, any pages that you've added to your main page, and a menu on the right-hand side that provides access to other pages, templates and administration functions, if you're a system admin.
In the next two screencasts in the Getting Started with Endeca Information Discovery series, on which we're basing this series of blog posts, Studio is then used to perform further configuration of the Endeca Server datastore, starting with enabling more extensive search on various attributes. Here's the links to the next two screencasts:
- 3.1 - Enhance the User Experience through Configuration: Learn about the various ways you can enhance the user experience of your application through Configuration.
- 3.2 - Enable Record Search: Learn how to enable record search in your Studio application.
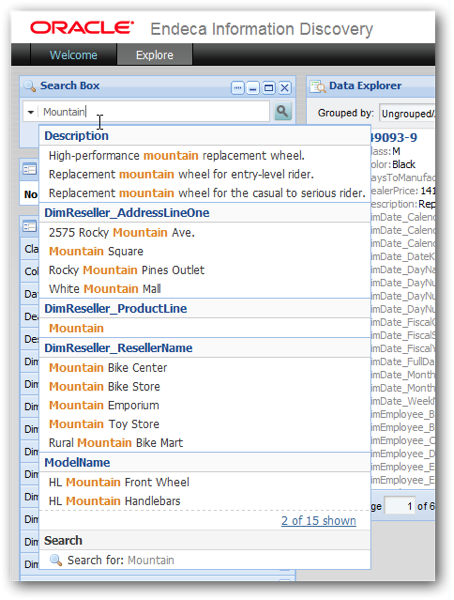
So how does this work, and what's the purpose of these tasks? Going back to the very simple Studio page that I created in the previous posting to view the contents of the datastore records (we'll get onto creating pages in more detail later on), I can see that if I start typing into the Search Box at the top left-hand side of the page, Studio performs a "value search" looking for occurrences of this text in records, highlighting those and the attributes they are contained in as matches occur.
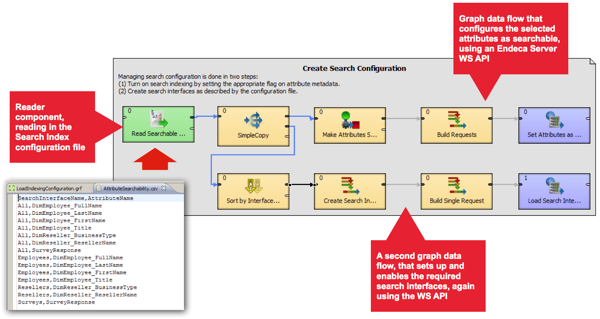
Underneath the Search Box is another box labelled Breadcrumbs, that provides another type of search called a "record search". Record search isn't enabled by default, and to enable it you need to define one or more "search interfaces" for the datastore, lists of attributes grouped by interface name that define the scope of a attribute value search. The value search box that you used earlier is a good way of identifying which attributes need to be in these search interfaces, and to create them you'll need to use Integrator again. Using Integrator, you will need to create a new graph that takes a flat file (or database table lookup) of attribute names group by interface name, and then calls another Endeca Server web service API to first set the selected attributes as searchable, which then creates and enables the required search interfaces.
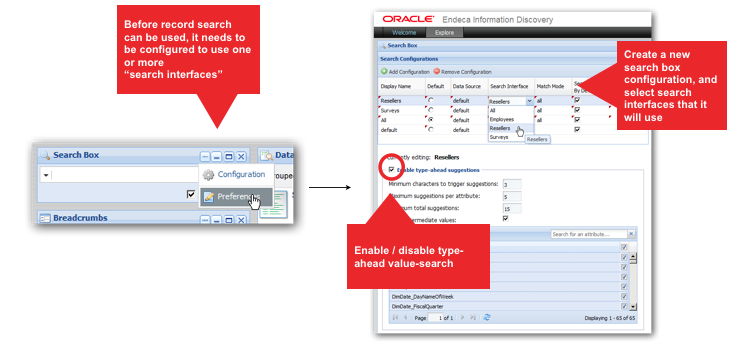
Then, you go back to Studio and bring up the preferences screen for the Search Box component. This then displays a list of search configurations, which initially will show that none are being used. To enable record search, you then have to create a new search configuration and add to it those search interfaces, defined in the Integrator graph a moment ago, that you wish to use with this search box, like this:
Now when you start typing into the search box, you can select a particular search interface (or just leave it to the default "All" in this example), make sure you press the Search (looking glass) button at the right of the box, and then your records will be filtered by that particular attribute value, as shown in the screenshot below.
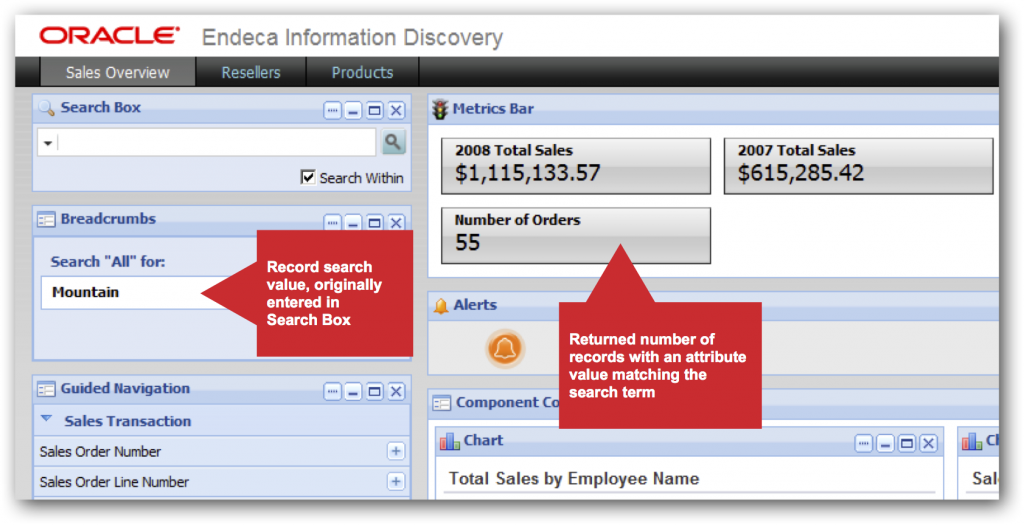
The next two screencasts in the series are concerned with arranging the attributes into groups (mostly corresponding to what we'd term dimension tables), and then giving them more meaningful names.
- 3.3 - Create Attribute Groups: Learn how to create Attribute Groups, both within Studio and via Integrator.
- 3.4 - Update Attribute Metadata: Learn how to update Attribute Metadata, such as display names, attribute value sort order, and selection type.
Both of these tasks are actually carried out using the Studio application at first, which has a Control Panel that brings up a list of datastore and Endeca Server tasks, as well as tasks specific to the Studio application. In the screenshot below using the Attribute Settings page, attributes currently unassigned to attribute groups (and therefore in the "Other" group) are being added to new attribute groups on the right-hand side, grouping them by Product, Employee and so on.
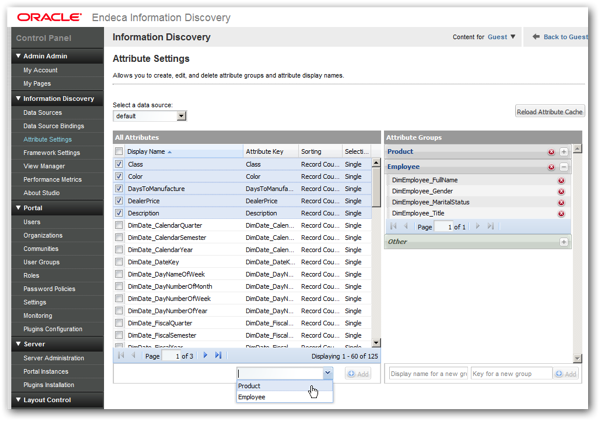
Both this task, and the one that follows that gives the attributes more meaningful names, can instead be carried out using an Integrator graph, which takes the groupings and attribute names from flat files (or from database tables, or wherever) and uses the Endeca Server web service APIs to configure the datastore's attribute list (the screenshot for which is at the end of yesterday's post on data loading and Integrator). Once you've carried out these configuration tasks, your search interface and list of attributes in the Guided Navigation box looks a bit more user-friendly.
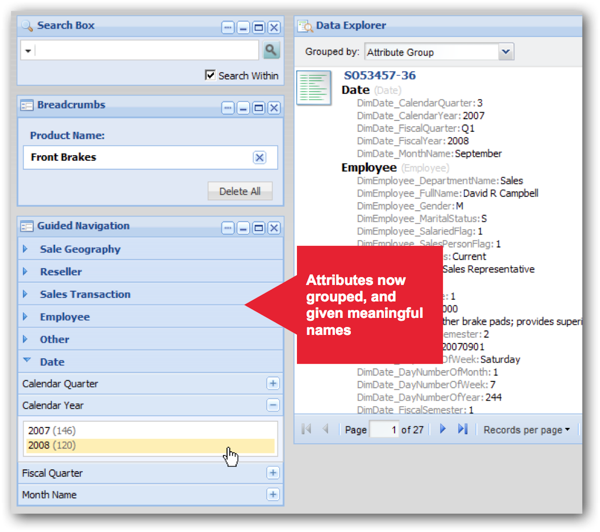
At this point we've now got the basics of a working system, and we can start to add graphs, tables and other visualisations to our dashboard page. The screencast series starts this process by adding a Cross Tab component to the page, selected from the list of components registered with the Studio application (and under the covers, Liferay).
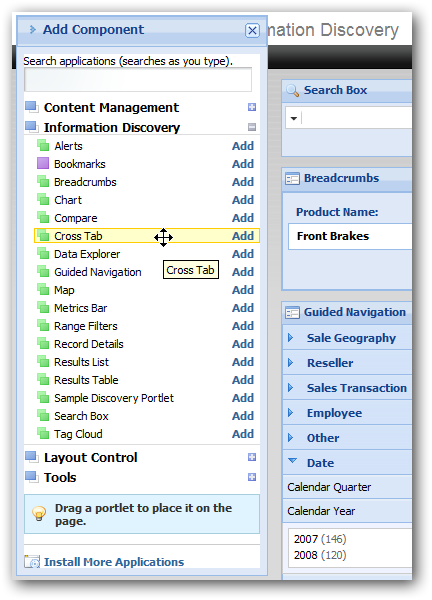
Adding a Cross Tab component to the existing page adds it, but it then needs to be configured, with the most important configuration setting being the query that returns the component's dataset, a process described in detail in the next screencast in the series:
To set up the query for the Cross Tab component, you use a query language called EQL ("Endeca Query Language") which is like SQL but set up for Endeca's particular needs. In the example below, we're using an EQL query to Return a dataset called "SalesTotal" that SELECTs the sum of SalesAmount and then GROUPs it by FiscalYear, FiscalQuarter and SalesTerritoryCountry. This EQL query will then get sent to the Endeca Server via a web service call, and the result set returned back to the component for display.
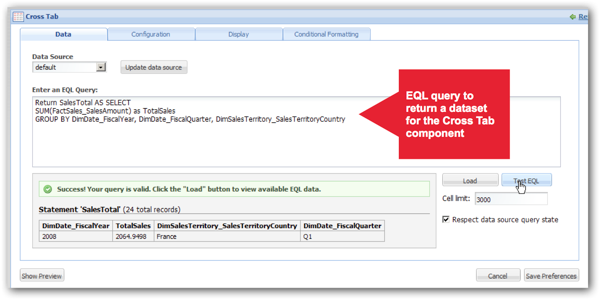
EQL is similar to SQL in that you have SELECT, GROUP BY and other similar clauses, but EQL is predicated on having a single table whose rows might have different sets of attributes (columns) to each other. There are two types of EQL statement; a statement with a RETURN clause, that returns a named dataset directly back to the calling component like this:
Return SalesTotal AS SELECT
SUM(FactSales_SalesAmount) as TotalSales
GROUP BY DimDate_FiscalYear, DimDate_FiscalQuarter, DimSalesTerritory_SalesTerritoryCountry
Note how columns referenced in the GROUP BY clause have an implied SELECT, so you don't need to list them in the main SELECT clause. The other type of EQL statement is one that creates a temporary results set for use later on, and uses a DEFINE clause instead of RETURN, like this:
DEFINE RegionTotals AS SELECT
SUM(Amount) AS Total
GROUP BY Region
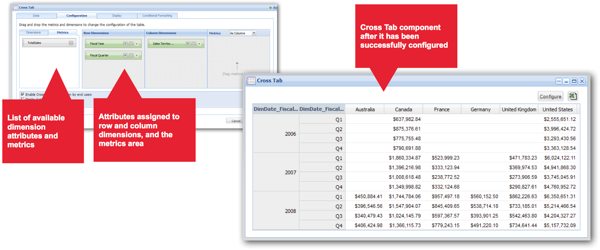
Once you've defined the EQL query you can then test it, and then use the returned columns to create the rows, columns and metrics for the pivot table. Once you've assigned the Cross Tab settings, you can then save the configuration and return back to the dashboard view, where you'll see the Cross Tab returning data from the Endeca Server datastore.
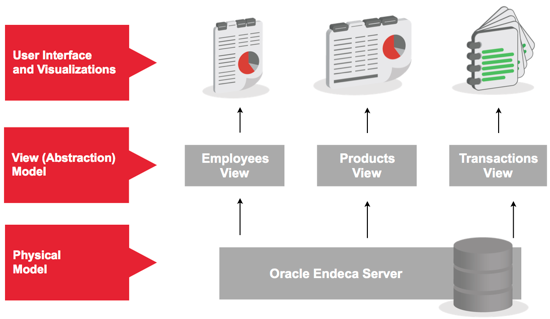
The other way to provide data for visualisation components is through a view. Views, like views in an Oracle database, provide an abstraction and simplification layer for users, taking subsets of data and, in some cases, data aggregations and transformations, and making them available to select from when providing a dataset for a chart or other component. The diagram below shows the relationship between the Endeca Server data store, this "view" layer, and the dashboard components that can make use of them.
Views, and the chart and table components that make use of them, are described in the next three screencasts in the series, and the last ones that we'll look at in these articles:
- 4.2 - Understand Views: Learn how to configure Views via the View Manager.
- 4.3 - Configure a Chart: Learn how to configure the Chart component.
- 4.4 - Configure a Results Table: Learn how to configure the Results Table component.
Views are defined within the Studio application's Control Panel function, and once defined can be exported and then used in an Integrator graph to load view definitions programmatically.
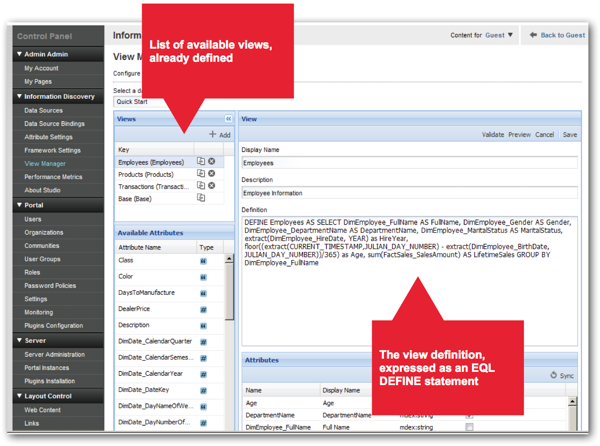
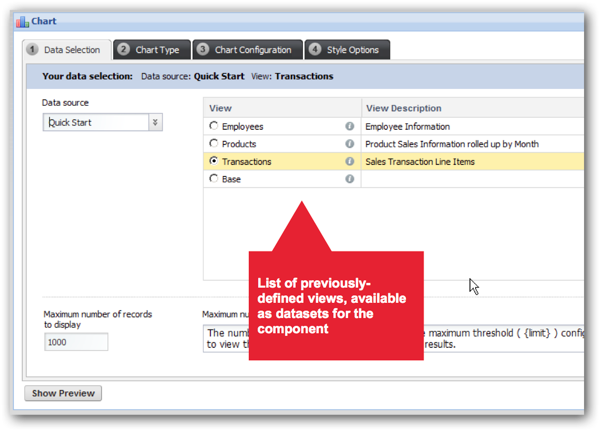
Once you've created your views, they are then available for use with various components, such as the chart component in the screenshot below, which is about to use the Transactions view to provide a sales transactions line items dataset.
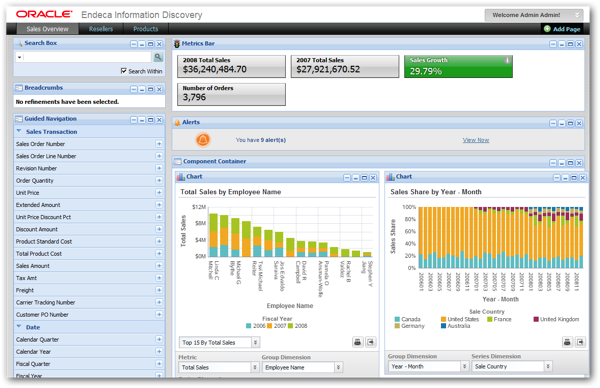
Finally, once you've created all the required views and set up your various visualisations, you'll end up at the QuickStart demo dashboard that we started with at the start of this article series.
So there we come to the end of this three-part series. Obviously, there's a lot more you can do with the Endeca Information Discovery toolset, including content acquisition from sources such as web pages, Twitter feeds and the like, and there's a lot more options around text parsing, enrichment and sentiment analysis that we've not touched on yet. But for now, this was a brief introduction to what's involved in creating an OEID application, and for more details make sure you take a look at the screencast series that I've linked to through the article.