Collecting Usage Tracking Data with Metric Extensions in EM12c

In my previous post I demonstrated how OBIEE’s Usage Tracking data could be monitored by EM12c through a Service Test. It was pointed out to me that an alternative for collecting the same data would be the use of EM12c’s Metric Extensions.
A Metric Extension is a metric definition associated with a type of target, that can optionally be deployed to any agent that collects data from that type of target. The point is that unlike the Service Test we defined, a Metric Extension is define-once-use-many, and is more "lightweight" as it doesn't require the definition of a Service. The value of the metric can be obtained from sources including shell script, JMX, and SQL queries.
The first step in using a Metric Extension is to create it. Once it has been created, it can be deployed and utilised.
Creating a Metric Extension
Let us see now how to create a Metric Extension. First, access the screen under Enterprise -> Monitoring -> Metric Extensions.
Leave the other options as default, and click on Next.

In a Metric Extension, the values of the columns (one or more) of data returned are mapped to individual metrics. In this simple example I am going to return a count of the number of failed analyses in the last 15 minutes (which matches the collection interval).

On the next page you define the metric columns, matching those specified in the adaptor. Here, we just have a single column defined:


Click Next and you will be prompted to define the Database Credentials, which for now leave set to the default.

Now, importantly, you can test the metric adaptor to make sure that it is going to work. Click on Add to create a Test Target. Select the Database Instance target on which your RCU resides. Click Run Test

What you’ll almost certainly see now is an error:>/p>
Failed to get test Metric Extension metric result.: ORA–00942: table or view does not exist

GRANT SELECT ON DEV_BIPLATFORM.S_NQ_ACCT TO DBSNMP;
CREATE SYNONYM DBSNMP.S_NQ_ACCT FOR DEV_BIPLATFORM.S_NQ_ACCT;

Click Next and review the new Metric Extension

When you click on Finish you return to the main Metric Extension page, where your new Metric Extension will be listed.
A note about performance
When building Metric Extensions bear in mind the impact that your data extraction is going to have on the target. If you are running a beast of a SQL query that is horrendously inefficient on a collection schedule of every minute, you can expect to cause problems. The metrics that are shipped with EM12c by default have been designed by Oracle to be as lightweight in collection as possible, so in adding your own Metric Extensions you are responsible for testing and ensuring yours are too.
Deploying a Metric Extension for testing
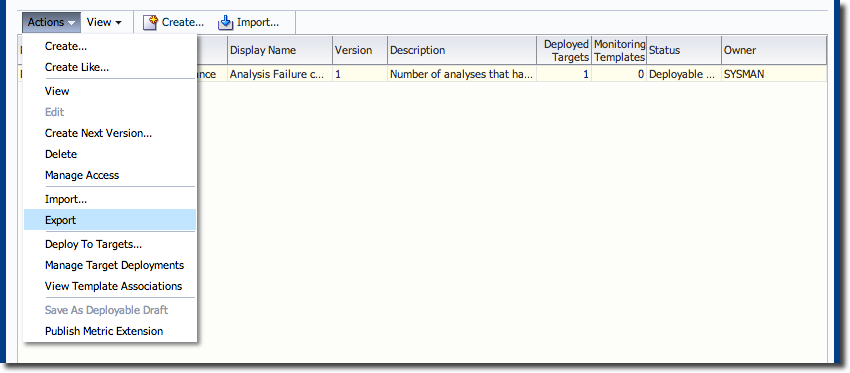
Once you have built a Metric Extension as shown above, it will be listed in the Metric Extension page of EM12c. Select the Metric Extension and from the Actions menu select Save As Deployable Draft.

Return to the main Metric Extension page and click refresh, and you should see that the Deployed Targets number is now showing 1. You can click on this to confirm to which target(s) the Metric Extension is deployed.
Viewing Metric Extension data
Metric Extensions are defined against target types, and we have created the example against the Database Instance target type in order to get the SQL Adaptor available to us. Having deployed it to the target, we can now go and look at the new data being collected. From the target itself, click on All Metrics and scroll down to the Metric Extension itself, which will be in amongst the predefined metrics for the target:


Thresholds can also be predefined as part of a Metric Extension so that they are already defined when it is deployed to a target.
Amending a Metric Extension
Once a Metric Extension has been deployed, it cannot be edited in its current state. You first create a new version using the Create Next Version… option, which creates a new version of the Metric Extension based on the previous one, and with a Status of Editable. Make the changes required, and then go through the same Save As Deployable Draft and Deploy to Target route as before, except you will want to Undeploy the original version.Publishing a Metric Extension
The final stage of producing a Metric Extension is publishing it, which moves it on beyond the test/draft “Deployable” phase and marks it as ready for use in anger. Select Publish Metric Extension from the Actions menu to do this.A published Metric Extension can be included in a Monitoring Template, and also supports the nice functionality of managed upgrades of Metric Extension versions deployed. In this example I have three versions of the Metric Extension, version 2 is Published and deployed to a target, version 3 is new and has just been published: