Successful BI Apps Implementation Part 1: Introduction and the Project Life Cycle
Since I am new to the Rittman Mead blog, let me first introduce myself. I am Mike and I have been working at Rittman Mead for the last year, mainly focusing on Oracle BI Applications. I have a background in Siebel CRM and many of my BI projects have involved integration with Siebel. Being an OBIA consultant, my work combines CRM, ERP, ETL, data warehousing and analytics.
Over the next two postings I will be looking at what makes an OBIA project successful. Firstly, I will try to justify why BI Apps can add so much value to a business and how best to extract this value from the product. Most of this will be non-technical and will examine the BI Apps project lifecycle as a whole. In Part 2, I will look at BI Apps with Informatica and DAC, focusing on good technical implementation and aspects of customisation that are often overlooked. Looking ahead to 2014, I will look at BI Apps 11g and how our steps to a successful project are affected by the architectural changes to the product.
I will add the links in as the postings are published, but here are the topics and links for the other parts of the series:
Successful BI Apps Implementation Part 1: Introduction and the Project Life Cycle
Successful BI Apps Implementation Part 2: BI Apps 7.9.6
Introduction to BI Apps
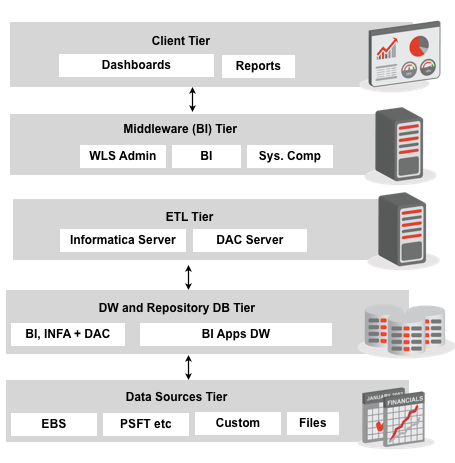
Oracle Business Intelligence Applications (OBIA or BI Apps) is a packaged BI solution for use with Oracle source systems such as EBS, JD Edwards, Siebel and PeopleSoft. It uses OBIEE as a reporting platform and until recently, Informatica as the ETL tool. Now, Oracle also provides BI Apps versions that use Oracle Data Integrator as the ELT tool. In either case, data from Oracle source systems is loaded into the Oracle Business Applications Warehouse (OBAW) using prebuilt Informatica / ODI metadata. Users then access prebuilt dashboards and subject areas in OBIEE that use the OBAW as a source. OBIA is modular and an individual Application is used to describe all of the Informatica / ODI and OBIEE metadata used for a particular functional area such as Financial Analytics or Sales Analytics. OBIA can be customised to reflect customisations in Oracle source systems or to introduce entirely new reporting functionality including new transactional sources.
Defining Success for a BI Apps Project
So let’s define our criteria for a successful OBIA project. My belief is that by the time that BI Apps is in production, the following five statements should hold true:
- Data is accurate and importantly, users trust that the data is accurate!
- The system performs ‘well’. I could devote an entire blog post to this topic so let’s say that when a user asks a question, they should get a response in no more than 10 seconds. We must also consider ETL performance.
- The data model and dashboards presented to the user are intuitive and any data lineage information is self-contained.
- Users understand their own data visibility rules and these rules are well aligned with the rules in the OLTP source systems (EBS, Siebel etc.).
- The system is being actively used to drive business decisions, or as an integral part of a business process. Ideally, there should be some measurable ROI.
Don’t do it blind
Let’s start at the beginning of the Project Life Cycle. Often, big waterfall-style IT projects go through requirements and design phases before users begin to understand exactly how the final product will look and function. Personally, I don’t like this approach in general and I certainly think that there is a better approach for BI Apps projects (see a description of Extreme BI by Stewart Bryson for Agile methodology with OBIEE). With BI Apps, we have the ability to install the out-of-the-box (OOTB) product fairly quickly and allow users to see what the OOTB dashboards and subject areas will look like with their own data. There is some configuration required prior to performing an initial data load but the process of detailed requirements gathering and design becomes much easier if users can perform their own fit/gap analysis with realistic data. This approach allows us to ask users ‘how well aligned is this Subject Area to your needs?’ instead of ‘what would you like to report on?’. Typically, we get much more enthusiasm and useful feedback with this approach.
Great, I can see everyone’s data!
At this discovery and prototyping stage of the project, I believe that implementing enterprise security can be beneficial. Typically, we need to decide: who sees what, who does what and importantly, how we administer this. It may seem counter-intuitive to worry about boring old data security at this point in the project but in some industries, the OOTB security options for integration with applications such as EBS and Siebel may not be sufficient. I have found this to be particularly true in the banking industry and in implementations where OBIEE is customer-facing. Also, when dealing with EBS R12 integration, be aware that Oracle provides an optional EBS patch that provides more granular control of account visibility across different areas of the suite (GL, AR, AP etc.) and that implementing the same functionality in BI Apps requires customisation. Identifying at this stage if and how the BI Apps security model requires customising can save major headaches later on in the project lifecycle.
Design processes, not just dashboards
By this point in the project, we should have a good understanding of the changes required to the BI Apps data model, Dashboards and security configuration. So, there is no more need to speak to users then? Actually, it’s probably time to start thinking about Agents, Actions, and Guided Navigation. I see two main reasons for this.
Firstly, I think it makes a huge difference to initial user experience and user acceptance in the days and weeks immediately following a go-live. As an example, a sales manager may use an OOTB dashboard to perform some pipeline analysis on a daily basis. However, a better solution might be to create an exception report (such as ‘South East Opportunities pending approval for more than 2 days’) and an associated agent. Even better would be to create an Action allowing the manager to approve the opportunity with one click. This way, the sales manager can spend less time getting data and more time acting on it. In order to add this level of business value, we need to commit time to understanding exactly what users want to achieve – not just what data they want.
Secondly, examining existing or future processes in this level of detail should highlight any missing functionality from the customised data model. Using the above example, the custom metric ‘# of Days Pending Approval’ is intrinsic to the process and we would notice if it was missing from the data model.
Monitor, Evaluate, Educate
Now, let’s assume that we have a functioning system in production (see the next blog post for how to get to this stage). Dashboards perform well, functionality is well aligned with business processes and the IT guys are happy because the nightly load only takes 1 hour. Unfortunately, things can change! We should expect and plan for: data growth, a growth in BI content (such as reports and agents) and more users concurrently accessing the system. Importantly, we can and should monitor both query and ETL performance.
I believe that the best way to do this is via an Administrator Dashboard with some associated exception reports and agents. This should highlight: long running queries, long running ETL jobs, high numbers of concurrent queries (sometimes caused by everyone scheduling their agents for 9am on a Monday) and data growth trends. Creating such a dashboard requires a combination of Usage Tracking (which is well documented) and reporting from our DAC and Informatica (or ODI) repositories. If you want a separate post on this, let me know in the comments.
Some problems with query performance can be solved with a bit of user education (without training, some users like to export everything and then filter in Excel) and others might highlight areas where the data model is functionally lacking. An example of this is where users implement complex selection steps to derive categories that could be derived during the ETL. Therefore, be proactive about engaging with the business if you see large query times.
That’s it for the introduction and project lifecycle. Stay tuned for the next post where we will get technical and talk about: RPD modelling, best practices for Informatica and DAC; data accuracy; making code upgrade-proof and data lineage.