Some Oracle Big Data Discovery Tips and Techniques
I’ve been using Oracle Big Data Discovery for a couple of months now, and one of the sessions I’m delivering at this week’s Rittman Mead BI Forum 2015 in Atlanta is on Big Data Discovery Examples from the Field, co-presented with Tim Vlamis from Vlamis Software. Tim is going to concentrate on a data analysis and visualization example using a financial/trading dataset, and I’m going to look at at some of the trickier, or less obvious aspects to the BDD development process that we’ve come across putting together PoCs and demos for customers. I’ll start first with the data ingestion and transformation part of BDD.
There’s two basic ways to get data into BDD’s DGraph engine; you can either use the Data Processing CLI command-line utility to sample, ingest and enrich Hive table data into the DGraph engine, or you can use the web-based data uploader to ingest data from a spreadsheet, text file or similar. For example, to load a Hive table called “bdd_test_tweets” into the DGraph engine using the command-line, you’d enter the commands:
[oracle@bigdatalite Middleware]$ cd BDD1.0/dataprocessing/edp_cli
[oracle@bigdatalite edp_cli]$ ./data_processing_CLI -t bdd_test_tweets
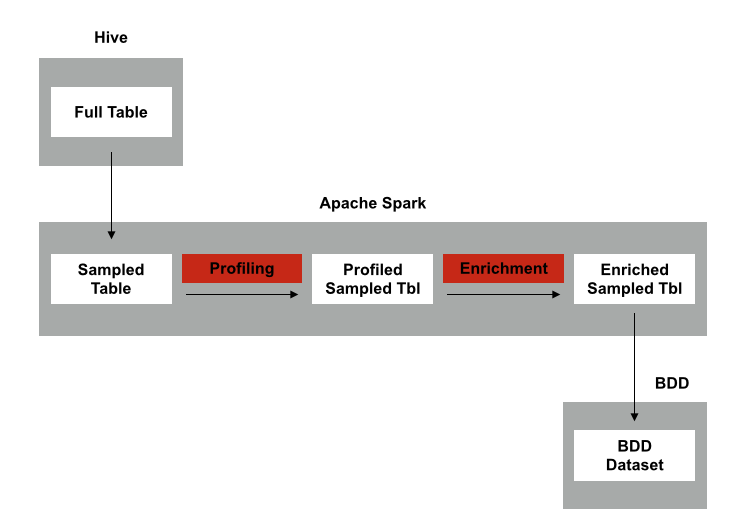
Big Data Discovery would then read the Hive table metastore to get the table and column names, datatypes and file location, then spin-up a Spark job to sample, enrich and then load the data into the DGraph engine. If the Hive table has fewer than 1m rows the whole dataset gets loaded in, or the dataset is sampled if the number of Hive rows is greater than 1m. The diagram below shows the basic load, profile and enrich ingestion process.
There’s a couple of things to bear in-mind when you’re loading data into BDD in this way:
- You can only load Hive tables, not Hive views, as the Spark loading process only works with full table definitions in the Hive metastore
- If your Hive table uses a SerDe other than the ones that ship with Base CDH5, you’ll need to upload the SerDe into BDD’s EDP JAR file area in HDFS and update some JAR reference files before the import will work, as detailed in Chapter 3 of the Big Data Discovery Data Processing Guide doc
- If you’ve installed BDD on a laptop or a smaller-than-usual Hadoop setup, you’ll need to make sure the SPARK_EXECUTOR_MEMORY value you set in bdd.conf file when you installed the product can be handled by the Hadoop cluster - by default SPARK_EXECUTOR_MEMORY is set to 48G for the install, but on my single laptop install I set it to 2G (after having first installed BDD, the data ingestion process didn’t work, and then I had to reinstall it with SPARK_EXECUTOR_MEMORY = 2G as the new setting)
- If you installed an early copy of BDD you might also need to change the OLT_HOME value in the /localdisk/Oracle/Middleware/user_projects/domains/bdd_domain/bin/setDomainEnv.sh file so that OLT_HOME="/opt/bdd/olt” instead reads OLT_HOME="/opt/bdd/edp/olt” - recent updates to the install files and installer correct this problem, but if it’s set wrong then the noun extraction part of the ingestion process won’t work either from the CLI, or from the BDD Studio Transformation screen
- There’s also no current way to refresh or reload a BDD DGraph dataset, apart from deleting it from BDD and then re-importing it. Hopefully this, and the lack of Kerberos support, will be addressed in the next release
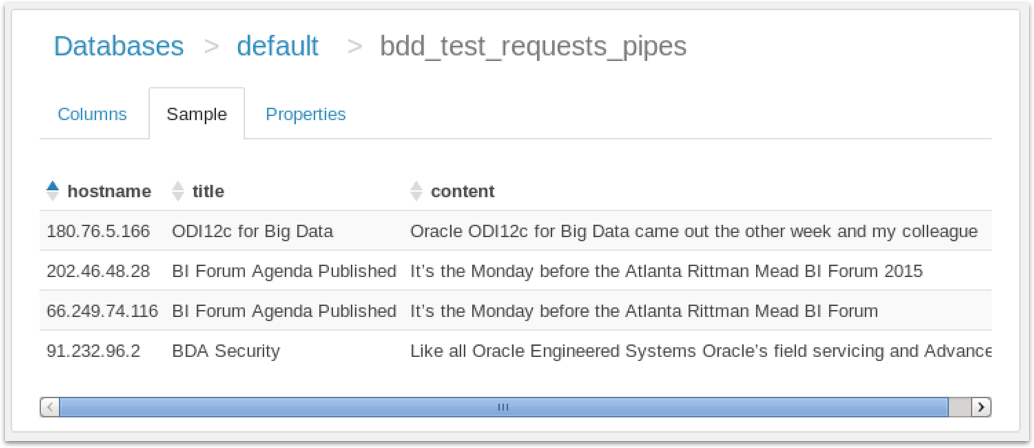
Another thing you might want to consider when providing datasets for use with BDD is whether you leave quotes around the column values, and whether you pre-strip out HTML tags from any text. Take for example the text file below, stored in CSV-delimited format:

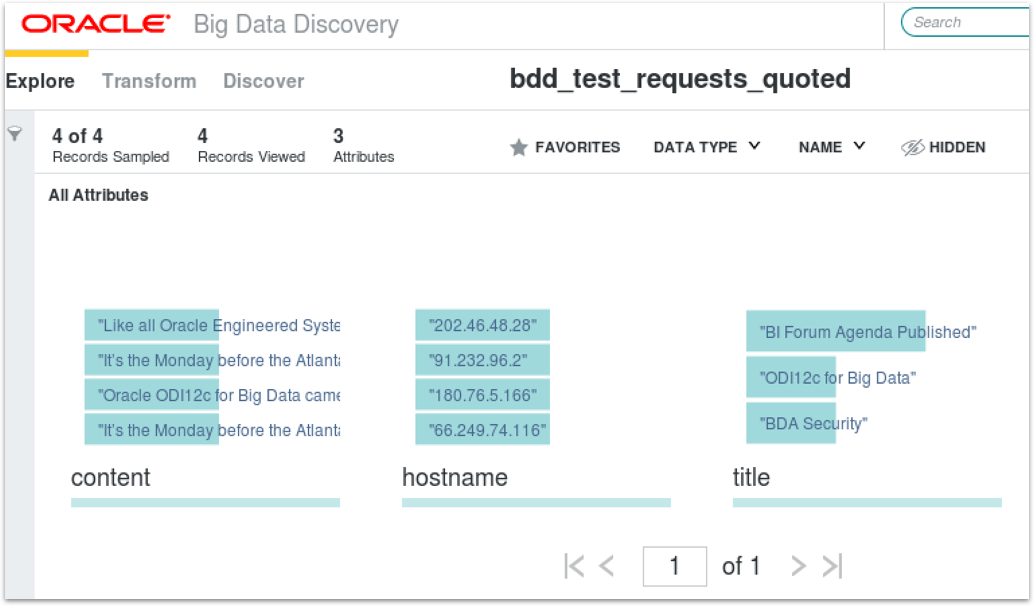
The file contains three comma-separated fields per line; one with the IP address of the requesting user, the others with the page title and page content snippet, all three fields having quotes around their values due to the presence of commas in the content text. Loading this data into Hive using the Hue web interface gives us a table with quotes around all of the fields, as Hue (in this release) doesn’t strip quotes from CSV fields.

When I ingest this table into BDD using the Data Processing CLI, I’ve got just these three columns still with the quotes around the fields. I can easily remove the quotes by going into the Transformation screen and use Groovy transforms to strip the first and last characters from the fields, but this is more work for the user and I don’t benefit from the automatic enrichment that BDD can do when performing the initial ingest.
If, however, I replace the comma separator with a pipe symbol, and remove the quotes, like this:
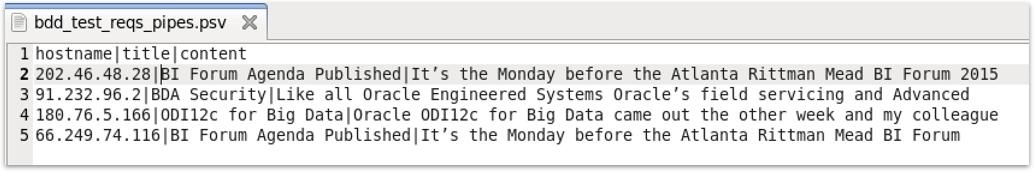
and therefore use Hue’s ability to use pipe and other separators instead of commas (and quotes), my Hive table looks like this:
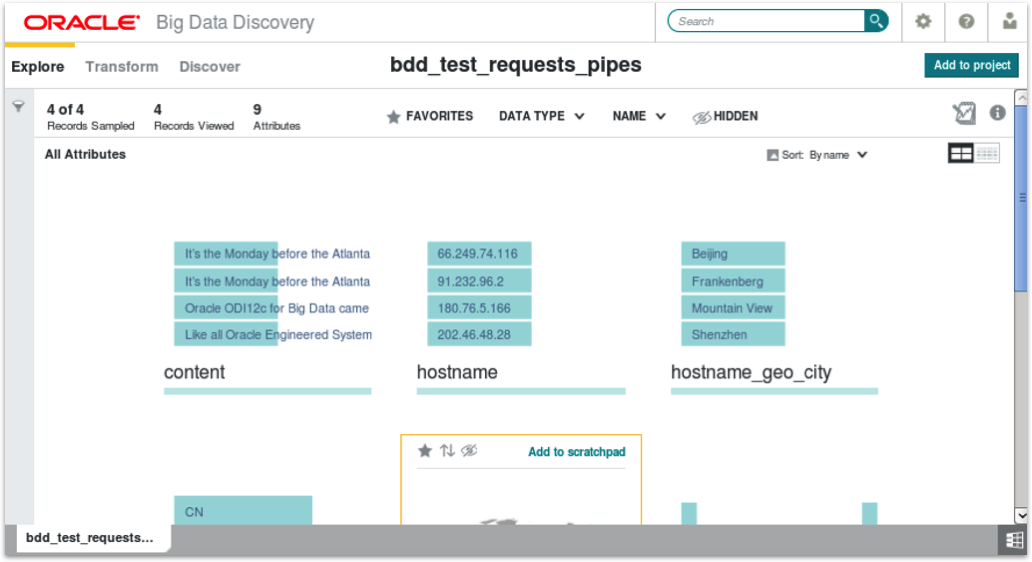
Now, when we ingest this table into BDD, we get six more derived attributes as the enrichment part of the ingestion process recognises the fields as containing IP addresses, text and so on. Presumably in the future BDD will have an option to ignore quotes around field values, but for now I tend to strip-out the quotes and uses pipes instead for my BDD ingestion files.
Similarly, with hive tables that contain fields with HTML content you can just load those fields into BDD as-is, and BDD will generally extract nouns and keywords and created derived fields for those. And whilst you can run Groovy transformations to strip-out the HTML tags (mostly), you’re then stuck with these derived columns that include HTML tag names - img, h2 and so on - in the keywords list. What I tend to do then is re-export the dataset with the content field stripped of the HTML tags, then re-ingest that table so I get a new keyword field with the HTML tags removed. What would be simpler though would be to strip-out the HTML tags before you load up the Hive table, so you didn’t have to do this round-trip to get rid of the HTML tag names from the noun keyword lists that are automatically generated during the ingest enrichment process.
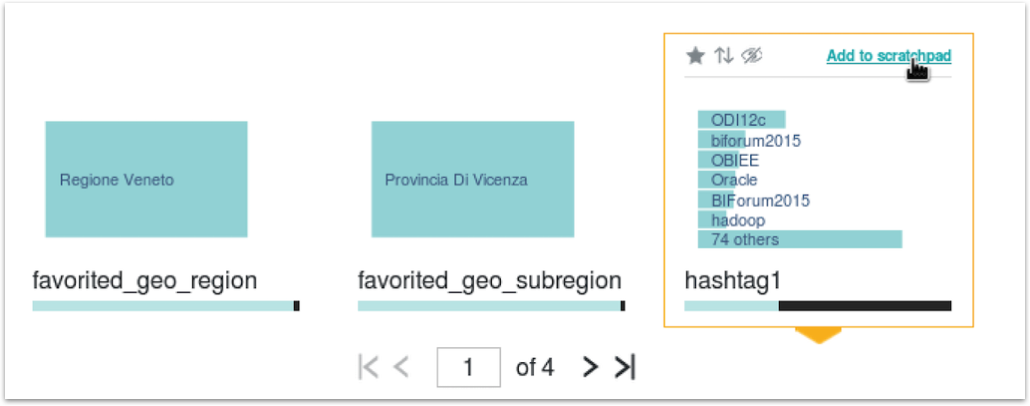
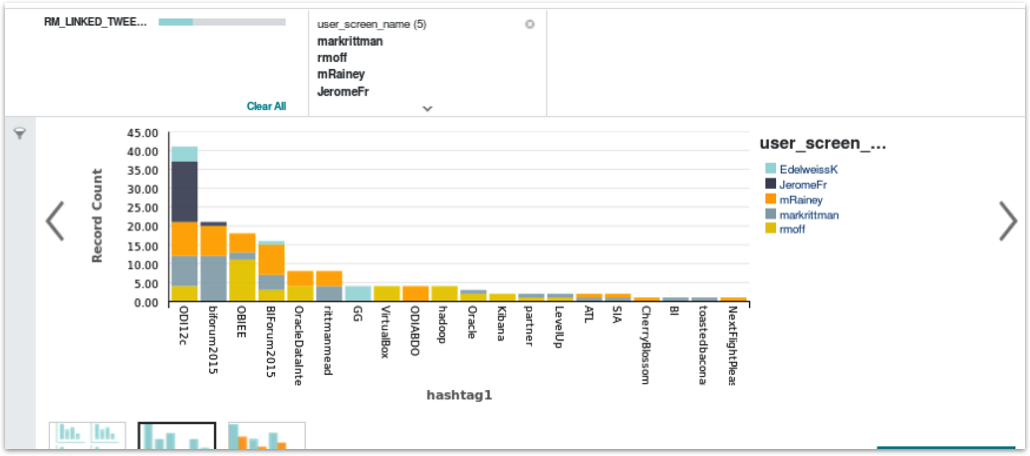
Once you’ve got datasets loaded into BDD, something I didn’t quite get the value of when I first used BDD studio was the “scratchpad” feature. To take an example, in the masterclass session I bring in a table of tweets referencing Rittman Mead, and one of the attributes in the resulting BDD dataset is for the first hashtag mentioned in the tweet. I can select this attribute and click on the “Add to Scratchpad” link to add it into the BDD Studio scratchpad, like this:
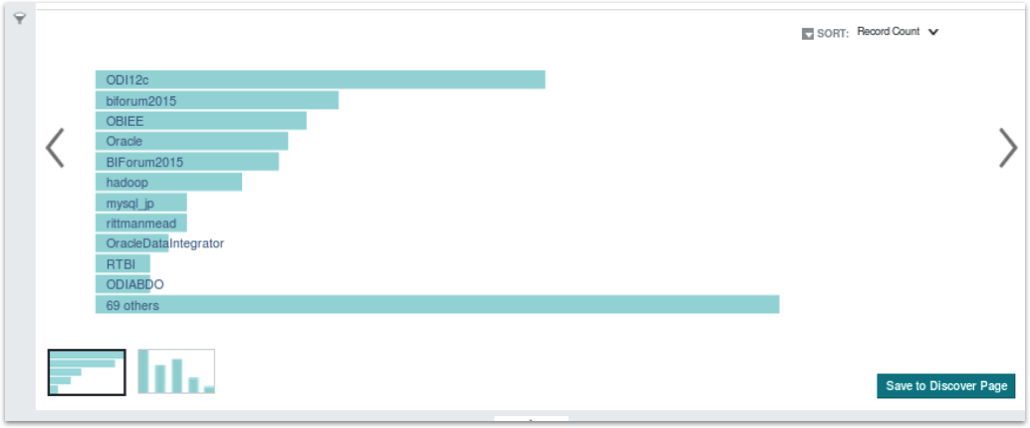
The scratchpad then displays above the list of attributes for that dataset, and by default it shows a horizontal bar chart listing the number of times each hashtag in the dataset is referenced.
I could then, should I wish to, use the Refine By button to the left of the chart to filter-down (or “refine” in BDD and Endeca-speak) the chart to include just those tweets by a subset of Twitter users - in this case myself, Robin, Michael, Jerome and Edel.

I can also add other attributes to the scratchpad as well - for example, the Twitter handle for the person tweeting - so that we can turn the bar chart into a stacked bar chart with the Twitter handles used to show the breakdown of use of that hashtag by each of our staff.
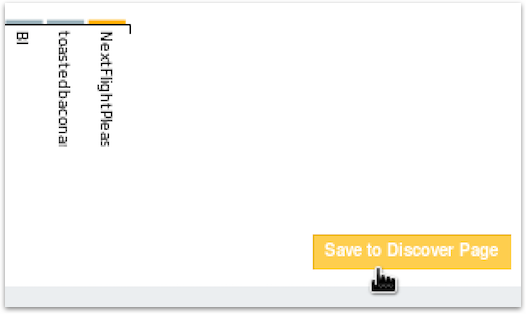
You can also use these Scratchpad visualisations as the start of your main BDD Studio “Discover” dashboards, by pressing the Add to Discover page at the bottom right-hand corner of each visualization. In this way rather than creating your Discover dashboards from scratch each time, you can seed them with some starter graphs and data visualizations right from the dataset attribute views.
The last bit I’m going to talk about in the BI Forum session session are “dataset views”; by default, each dataset you create within a BDD project has just its own attributes within it, and if you use one of them to create a visualization in the Discovery section, you’ll not be able to use any of the attributes from your other datasets (although the faceted search feature above every BDD Studio page searches all datasets in your project and in the BDD Catalog, just like the Endeca Information Discovery “value searches” that I talked about in this older article. To use attributes from more than one dataset in a BDD Studio visualisation component you need to join them, similar to how you’d join tables in the OBIEE RPD.
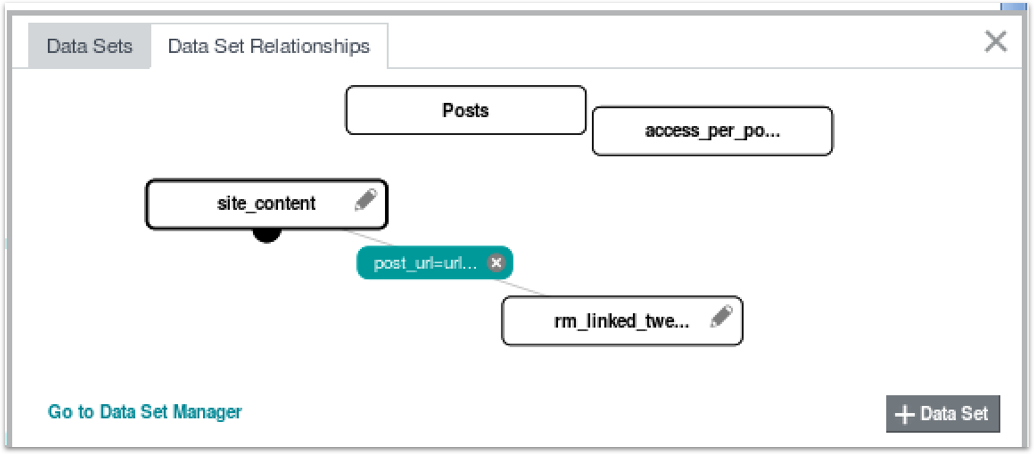
To take the Tweets, Page Views and Page Content datasets I use in the BI Forum masterclass, consider a situation where I’d like to list out all o the tweets that reference our website, along with details of the page title, page category and other attributes that I can get from a second dataset that I pull from the website itself. To link these two datasets together I join them in BDD Studio using their common URL attribute (in reality I had to massage the datasets so that both URLs featured a trailing forward-slash (“/“) to make them join properly, but that’s another story)
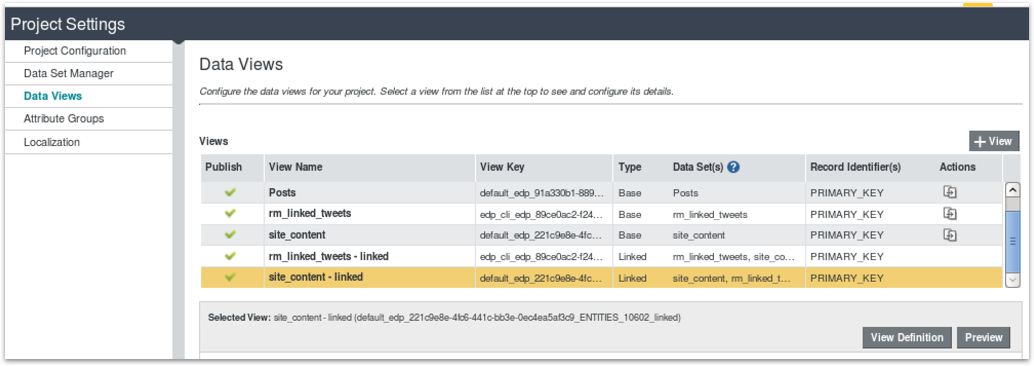
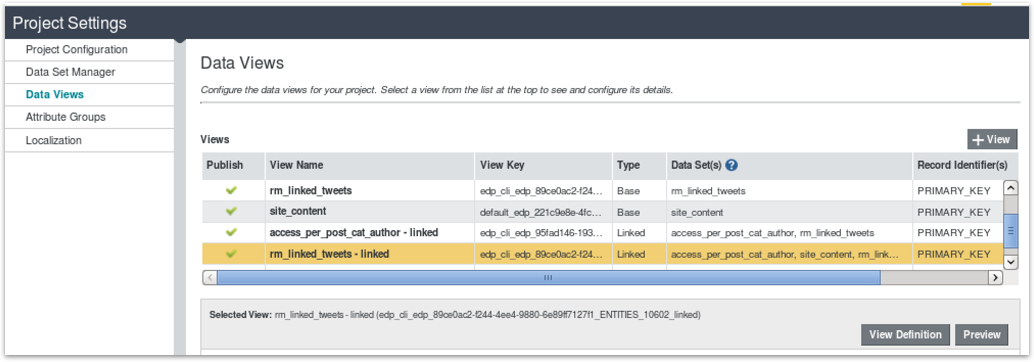
If I then go to the Data Views tab within the Project Settings BDD Studio screen, I can see that two data views have been setup for this join; one (“rm_linked_tweets - linked”) leads on the RM Linked Tweets dataset (the tweets) and returns the 1547 tweets in that first dataset joined to pages in the Site Content dataset, the “site_content - linked” dataset starts from the 2229 records in the Site Content dataset and joins those records to the RM Linked Tweets dataset; you can then choose which one you want to use (or “drive off”) when you add components to the Discover dashboard part.
Where it gets interesting is when you add third, fourth datasets to the join. Depending on the way you join-in the third table affects the number of rows returned by the join; if join the web server logs dataset (“access_per_post_cat_authors”) to the Site Contents dataset the resulting three-way join view returns the 2229 rows driven by the entries in the Site Contents dataset, whereas if I join the tweets dataset to the web server logs dataset directly, so the tweets dataset joins first to the site contents dataset, and then separately to the web server logs dataset, like this:
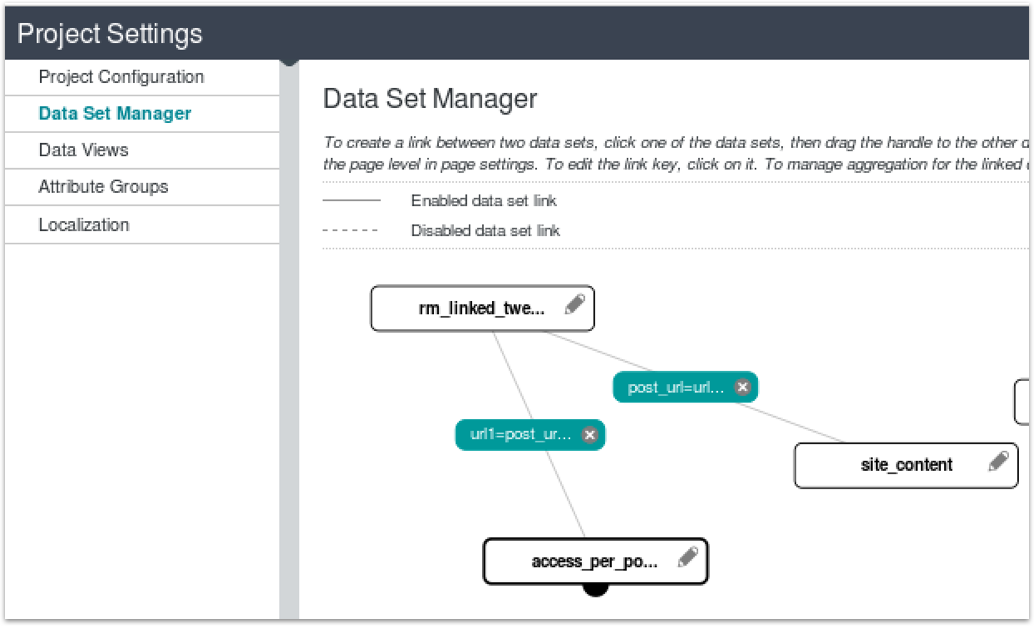
then the resulting data view joining all three datasets return a row count equal to the rows in the tweets dataset driving it all.
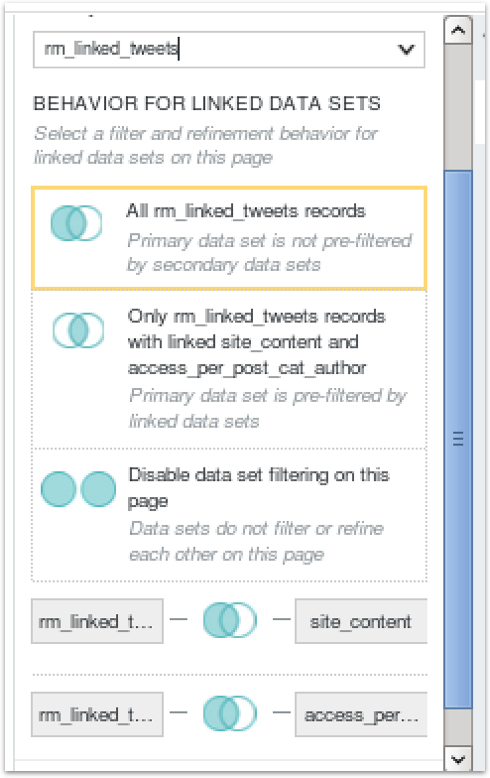
The best way to work this all out in your head is to do what I did, and create a series of datasets with distinct row counts and join characteristics and then just test creating joins and viewing the resulting row count using the Preview button below the list of data views. To make things even more interesting you can choose, in the Discover page properties section, whether to left-outer join, equi-join or full-outer join a “primary” dataset used for the page with any it’s joined with, in our instance determining whether the full set of tweets are filtered by the list of pages they refer to (removing tweets that reference non-existant RM web pages in this example), or whether all tweets are returned regardless.
It’s actually pretty powerful stuff and you should avoid the temptation to pre-create all your joined datasets in Hive beforehand rather than use BDD Studio joins, as once you get your head around the concept it’s a flexible and straightforward way to join your datasets up in whatever way makes sense for your analysis - leading off of website hits for one type of analysis, and then pages referenced in tweets in the other, allowing yo to easily swap what would be the fact, and dimension tables in a regular relational database report.
That’s if for now though; it’s the day before the Atlanta Rittman Mead BI Forum and I need to to get myself to the venue and get set up for tomorrow’s masterclass with Jordan Meyer. To those of you that are coming along to Atlanta I look forward to seeing you, otherwise normal service will be resumed next week.