Driving OBIEE User Engagement with Enhanced Usage Tracking for OBIEE


Measuring and monitoring user interactions and behaviour with OBIEE is a key part of Rittman Mead’s User Engagement Service. By understanding and proving how users are engaging the system we can improve the experience for the user, driving up usage and ensuring maximum value for your OBIEE investment. To date, we have had the excellent option of Usage Tracking for finding out about system usage, but this only captures actual dashboard and analysis executions. What I am going to discuss in this article is taking Usage Tracking a step further, and capturing and analysing every click that that the user makes. Every login, every search, every report build action. This can be logged to a database such as Oracle, and gives us Enhanced Usage Tracking!
Why?
Because the more we understand about our user base, the more we can do for them in terms of improved content and accessibility, and the more we can do for us, the OBIEE dev/sysadmin, in terms of easier maintenance and better knowledge of the platform for which we are developing.
Here is a handful of questions that this data can answer - I’m sure once you see the potential of the data you will be able to think of plenty more…
How many users are accessing OBIEE through a mobile device?
Maybe you’re about to implement a mobile strategy, perhaps deploying MAD or rolling out BI Mobile HD. Wouldn’t it be great if you could quantify its uptake, and not only that but the impact that the provision of mobile makes on the general user engagement levels of your OBIEE user base?
Perhaps you think your users might benefit from a dedicated Mobile OBIEE strategy, but to back up your business case for the investment in mobile licences or time to optimise content for mobile consumption you want to show how many users are currently accessing full OBIEE through a web browser on their mobile device. And not only ‘a mobile device’, but which one, which browser, and which OS. Enhanced Usage Tracking data can provide all this, and more.
Which dashboards get exported to Excel the most frequently?
The risks that Excel-marts present are commonly discussed, and broader solutions such as data-mashup capabilities within OBIEE itself exist – but how do you identify which dashboards are frequently exported from OBIEE to Excel, and by whom? We’ve all probably got a gut-instinct, or indirect evidence, of when this happens - but now we can know for sure. Whilst Usage Tracking alone will tell us when a dashboard is run, only Enhanced Usage Tracking can show what the user then did with the results:
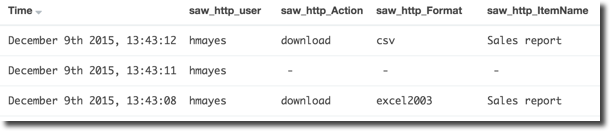
What do we do with this information? It Depends, of course. In some cases exporting data to Excel is a - potentially undesirable but pragmatic - way of getting certain analysis done, and to try to prevent it unnecessarily petulant and counterproductive. In many other cases though, people use it simply as a way of doing something that could be done in OBIEE but they lack the awareness or training in order to do it. The point is that by quantifying and identifying when it occurs you can start an informed discussion with your user base, from which both sides of the discussion benefit.
Precise Tracking of Dashboard Usage
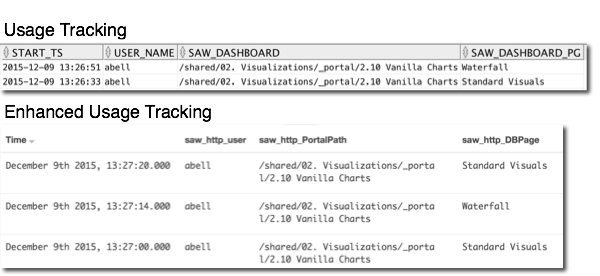
Usage Tracking is great, but it has limitations. One example of this is where a user visits a dashboard page more than once in the same session, meaning that it may be served from the Presentation Services cache, and if that happens, the additional visit won’t be recorded in Usage Tracking. By using click data we can actually track every single visit to a dashboard.
In this example here we can see a user visiting two dashboard pages, and then going back to the first one – which is captured by the Enhanced Usage Tracking, but not the standard one, which only captures the first two dashboard visits:
This kind of thing can matter, both from an audit point of view, but also a more advanced use, where we can examine user behaviour in repeated visits to a dashboard. For example, does it highlight that a dashboard design is not optimal and the user is having to switch between multiple tabs to build up a complete picture of the data that they are analysing?
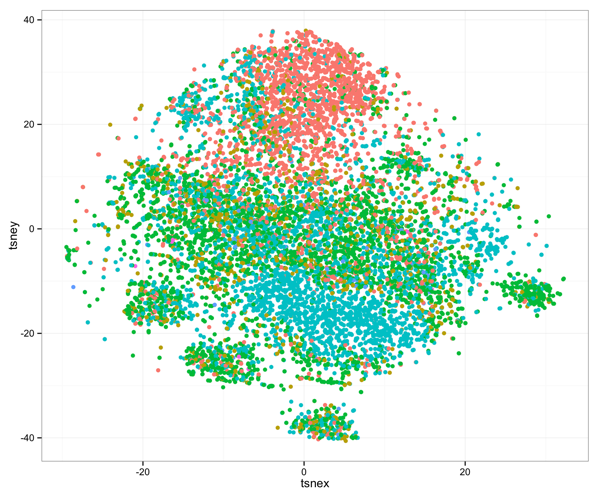
Predictive Modelling to Identify Users at Risk of ‘Churn’
Churn is when users disengage from a system, when they stop coming back. Being able to identify those at risk of doing this before they do it can be hugely valuable, because it gives you opportunity to prevent it. By analysing the patterns of system usage in OBIEE and looking at users who have stopped using OBIEE (i.e. churned) we can then build a predictive model to identify those with similar patterns of usage but are still active.
Measures such as the length of time it takes to run the first dashboard after login, or how many dashboards are run, or how long it takes to find data when building an analysis, can all be useful factors to include in the model.
Are any of my users still accessing OBIEE through IE6?
A trend that I’ve seen in the years working with OBIEE is that organisations are [finally] moving to a more tolerant view on web browsers other than IE. I suppose this is as the web application world evolves and IE becomes more standards compliant and/or web application functionality forces organisations to adopt browsers that provide the latest capabilities. OBIEE too, is a lot better nowadays at not throwing its toys out of the pram when run on a browser that happens to have been written within the past decade.
What’s my little tirade got to do with enhanced usage tracking? Because as those responsible for the development and support of OBIEE in an organisation we need to have a clear picture of the user base that we’re supporting. Sure, corporate ‘standard’ is IE9, but we all know that Jim in design runs one of those funny Mac things with Safari, Fred in accounts insists on Firefox, Bob in IT prides himself on running Konquerer, and it would be a cold day in hell before you prise the MD’s copy of IE5 off his machine. Whether these browsers are “supported” or not is only really a secondary point to whether they’re being used. A lot of the time organisations will take the risk on running unsupported configurations, consciously or in blissful ignorance, and being ‘right’ won’t cut it if your OBIEE patch suddenly breaks everything for them.
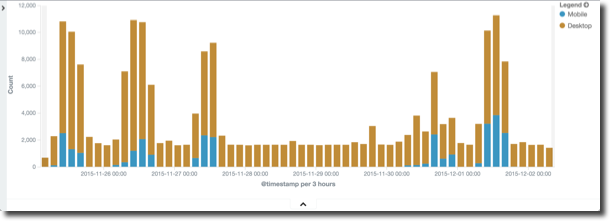
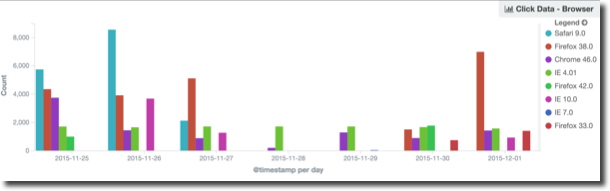
Enhanced Usage Tracking gives us the ability to analyse browser usage over time:
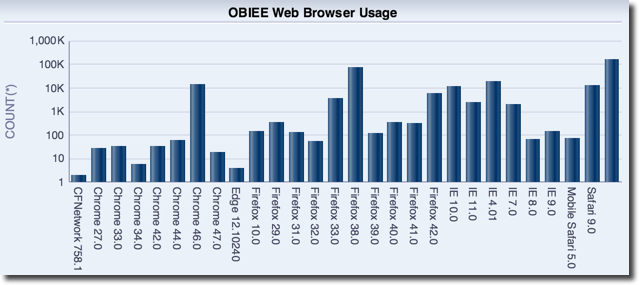
as well as the Enhanced Usage Tracking data rendered through OBIEE itself, showing browser usage in total (nb the Log scale):
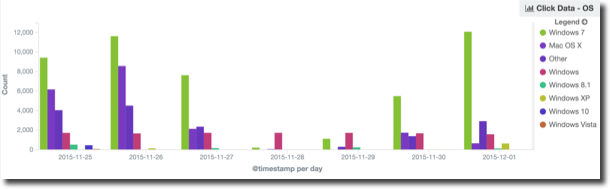
It’s also easy to report on the Operating System that users have:
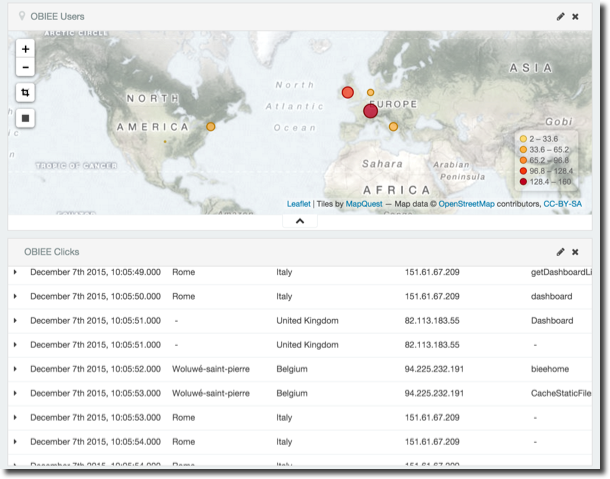
Where are my users connecting to OBIEE from?
Whilst a lot of OBIEE deployments are run within the confines of a corporate network, there are those that are public-facing, and for these ones it could be interesting to include location as another dimension by which we analyse the user base and their patterns of usage. Enhanced Usage Tracking includes the capture of a user’s IP, which for public networks we can easily lookup and use the resulting data in our analysis.
Even on a corporate network the user’s IP can be useful, because the corporate network will be divided into subnets and IP ranges, which will usually have geographical association to them - you just might need to code your own lookup in order to translate 192.168.11.5 to “Bob’s dining room”.
Who deleted this report? Who logged in? Who clicked the Do Not Click Button?
The uses for Enhanced Usage Tracking are almost endless. Any user interaction with OBIEE can now be measured and monitored.
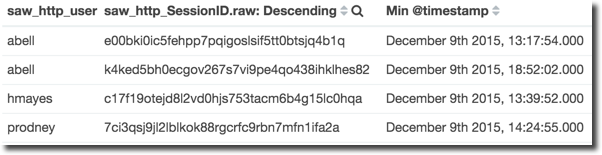
A frequent question that I see on the OTN forums is along the lines of “for audit purposes, we need to know who logged in”. Since Usage Tracking alone won’t capture this directly (although the new init block logging in > 11.1.1.9 probably helps indirectly with this) this information usually isn’t available….until now! In this table we see the user, their session ID, and the time at which they logged in:
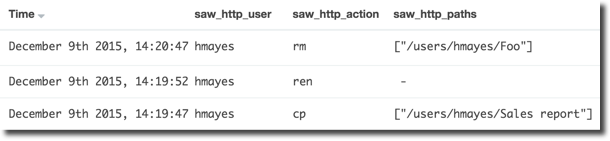
What about who updated a report last, or deleted it? We can find that out too! This simple example shows some of the operations in the Presentation Catalog recorded as clear as day in Enhanced Usage Tracking:
Want to know more? We’d love to tell you more!
Measuring and monitoring user interactions and behaviour with OBIEE is a key part of Rittman Mead’s User Engagement Service. By understanding and proving how users are engaging the system we can improve the experience for the user, driving up usage and ensuring maximum value for your OBIEE investment.
If you’d like to find out more, including about Enhanced Usage Tracking and getting a free User Engagement Report for your OBIEE system, get in touch now!