Oracle's New Data Visualization Desktop


A recent addition to the Oracle lineup of visualization tools is the Oracle Data Visualization Desktop. Described by Oracle as a “single user desktop application that provides Oracle Data Visualization functionality to business users,” DVD is an easy-to-install data visualization tool for Windows 7, 8 or 10 that packs some very powerful features.
I recently had a chance to sit down and explore DVD and wanted to share some of my first impressions.
At its core, DVD is a stand-alone version of Oracle’s DVCS. If you are at all familiar with Visual Analyzer, you will feel right at home.
Installation was a breeze on my Windows 10 VM and only took about 5 minutes and required no additional software or plugins for the standard VA functionality.
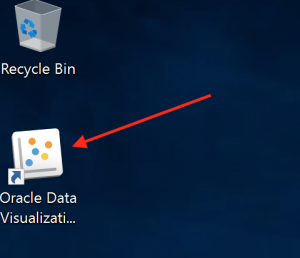
After installation, launching DVD is as easy as clicking on the desktop icon like any other stand-alone application.
After the ODV startup, I was presented with a home screen which contains a search field for finding projects, a list of user folders and a main window to select individual visualizations that have been created.

Clicking on the hamburger ![]() icon in the top left corner brings up a menu where I can choose to start Visual Analyzer with the last data source selected, select new Data Sources or create a new VA Project.
icon in the top left corner brings up a menu where I can choose to start Visual Analyzer with the last data source selected, select new Data Sources or create a new VA Project.

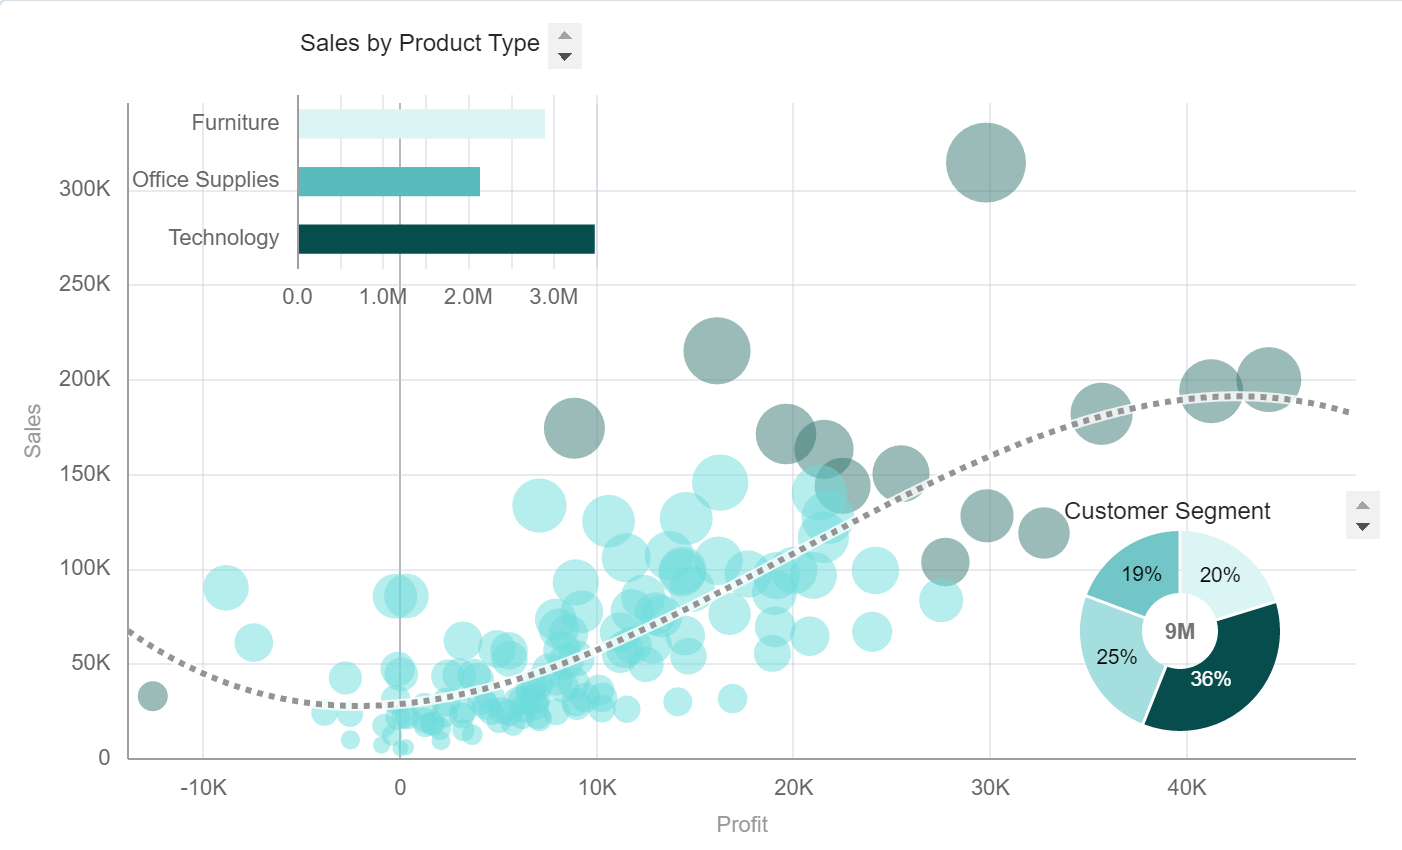
I chose to create a new VA project and selected the sample data from Oracle (the sample data is an optional install chosen during the DVD install process). Creating a dashboard was a fairly straightforward process. Following Visual Analyzer’s functionality of dragging and dropping columns, I was able to put together a simple sales and profit dashboard in a few minutes.

While creating my dashboard, I noticed that Oracle has included some new visualization types. You can now choose Scatter (Cat.), Stacked Scatter (Cat.), Donut or Sunburst visualizations.


One other feature that Oracle added to DVD is the ability to insert images onto the dashboards. You can choose to upload your own image or link to a URL to pull images from the web.


I uploaded an image and changed the canvas layout to freeform, which allowed me to move the image anywhere on the dashboard. By adjusting the transparency it is possible to have the image underlay the entire dashboard and still be able to see the visualizations. This example is pretty extreme, and in a real world scenario, caution should be used as to not obstruct the visualizations.

Next I decided to try to connect to my Oracle 12c sample database to pull in some new data to work with. Selecting "Create New Datasource" from the menu prompted me with three options: create from a file, from an existing app or from a database.
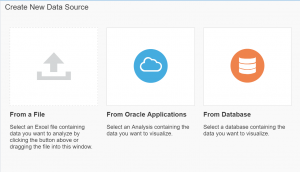
Clicking on the “From Database” option, I was presented with a connection screen.

On this screen I discovered one of the most impressive things about DVD. Clicking on "Database Type" reveals a dropdown menu which you can choose from a variety of database formats, including Spark, Hive and Mongo DB, among others.

That’s awesome.
Because I already had 12c DB installed, I selected the Oracle Database Type and entered all my connection information.
Once a connection to the database is made, it shows up in the available connections list. Clicking on my sample database brought up a list of available schemas to choose from. In this case, I chose the sample HR schema which then brings up a list of tables available to add as data sources for visualizations.


I chose to add EMPLOYEES, JOBS and LOCATIONS and then started a new VA project. The HR tables now show up in the list of available data sources.

I selected EMPLOYEES and JOBS and, within seconds, was able to create a simple table showing a list of employee names, their job titles, salaries and commission percentages.

As you can see, adding new data sources is quick and easy and allows users to explore their data and create meaningful visualizations from that data in a very short amount of time.
Another feature is the Advanced Analytics portion of Oracle Data Visualization Desktop. This feature, which uses R, gives users the ability to do things like highlight outliers or show trend lines with a click of a button.


This feature does require an optional install located within the DVD application folder. The install process proved once again to be very quick and easy and completed in about 5 minutes.


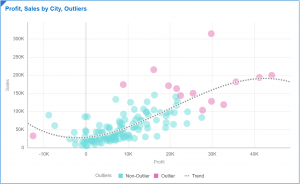
After the installation was complete, I created a new VA project. Choosing the sample data provided by Oracle for DVD, I created a quick scatter chart and then, by right clicking anywhere on the visualization, clicked “Add Outliers.”


As you can see, outliers and non-outliers are easily distinguishable by the color key that DVD assigned automatically.
Next, I wanted to see how if I could change some of the colors in my visualization. DVD allows you to do this under the visualization menu.


As with OBIEE, entering specific hex values is supported as well as selecting from pre-made color pallets is possible with DVD.
Using the same right-click functionality that I used for adding outliers, I was able to additionally add a polynomial trend line to show a gains and losses.
Next, I decided to see if I could export this data and import it into Excel. Choosing export from the visualization menu, I was able to easily export the data as a .CSV and upload it into Excel.

Overall, Oracle Data Visualization Desktop is a very impressive new addition to the to the DVCS lineup. The ability to collect data from multiple sources, its native adaptors for a variety of popular databases, and the ability to manipulate visualizations to convey the data in creative ways make it a strong contender against Tableau and Wave. It requires no remote server infrastructure and is a solid business solution for users Oracle Data Visualization functionality in a small and easily accessible package.
I feel as though I have just cracked the surface of everything this tool can do. Check back for future blogs and articles as we at Rittman Mead continue to explore the possibilities of DVD. The future of data visualization may be closer than we think.
If you would like more information about Visual Analyzer or the Oracle Cloud Service, see this blog post by Mark Rittman.
If you would like to watch the official Tech Demo of DVD, you can find it here.
Rittman Mead also offers in depth professional training courses for OBIEE 12c and Visual Analyzer.