Common OBIEE Implementation Mistakes That Impact Performance

I've recently performed several assessments to help our clients diagnose and fix their OBIEE performance problems. They often share similar design or implementation issues, and I thought it would be useful to present them here as a handy reference:
Mistake 1: No Software Monitoring
The key to happy users is to know there’s a problem before they do, and even better, fix it before they realise. Availability of comprehensive performance metrics is vital to achieve this goal, and Usage Tracking data represent the natural starting point. When enabled in OBIEE, Usage Tracking collects statistics for each query and is helpful to understand usage patterns across dashboards and users, and to analyse performance trends and diagnose specific issue. Whilst Usage Tracking is generally always enabled and data it generates reviewed regularly, other software metrics are not gathered at all or are not available to the BI team, giving only a partial view of the picture.
In addition to gathering and monitoring Usage Tracking data, we would strongly recommend:
-
Proper OS monitoring to capture full breadth of OS metrics on both application and database servers including CPU %, Load Average, Memory, Disk I/O, Disk Busy %, Network I/O. Store historic data for trend analysis with appropriate aggregations (so as to not blunt peaks), and near-realtime granular data for interactive performance diagnostics.
-
OBIEE Dynamic Monitoring Service (DMS) metrics collection. These metrics provide information regarding Oracle Fusion Middleware components' performance, state, and on-going behaviour.

All of these can be done and visualised with Rittman Mead OBIEE Performance Analytics Dashboards. Have a look at these videos to see exactly how the dashboards can help, and get in touch with us to request a demo!
Mistake 2: Randomly Changing Configuration Settings
It’s a common belief, or hope depending on available hardware, among online gamers that by changing configuration settings you can fix any software performance issue. Unfortunately OBIEE is not a game and this is not true! Whilst OBIEE does not provide any Boost Performance switch, the defaults are generally a good starting point, and unnecessary fiddling without good reason should be avoided:
-
You can introduce additional problems by mistake.
-
It makes it hard to track what's changed from a default config.
-
If it fixes the problem, could be coincidence - no actual understanding of the underlying problem without proof of it.
We at Rittman Mead are firm believers in a practical and logical approach to performance analytics and optimisation. Eschewing the drunk man anti-method of ‘tuning’ configuration settings at random, we advocate making a clear diagnosis and baseline of performance problems before changing anything. Once a clear understanding of the situation is established, steps are taken in a controlled manner to implement and validate one change at a time.
Mistake 3: Data Transformation at Query Time
You can usually find a lot of data transformation being done in the RPD itself. This is one of the most useful functionality of OBIEE, since data re-modelling in-flight at query time is usually a lot quicker to implement rather than changing the underlying data model and / or ETL processes.
Wrangling data this way in a small number of instances is common, but widespread use is indicative of a data model and / or ETL design that needs modifying to take into account the report requirements, it's difficult to maintain, and it results in less efficient SQL, as well as unnecessary complex SQL.
-
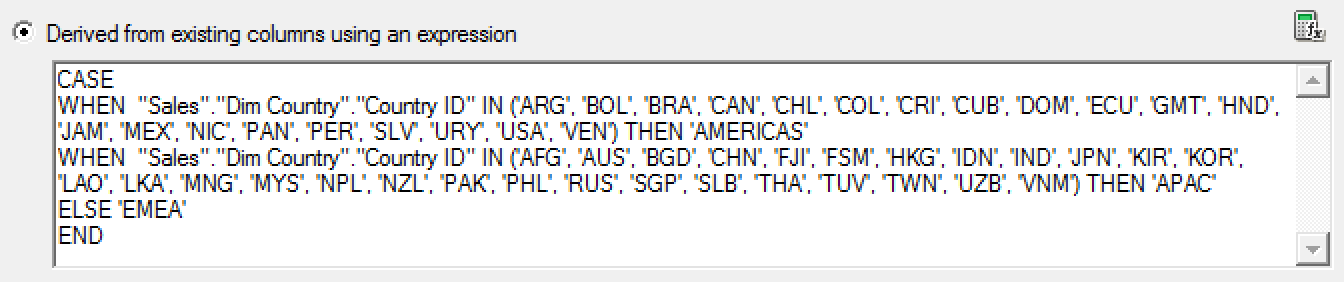
Conditional transformation - Business is always changing and it may require to group data in a way that was not expected when data model has been designed. For example, you can create a logical column using CASE WHEN statement to define a new country grouping which is not present in your data model.
-
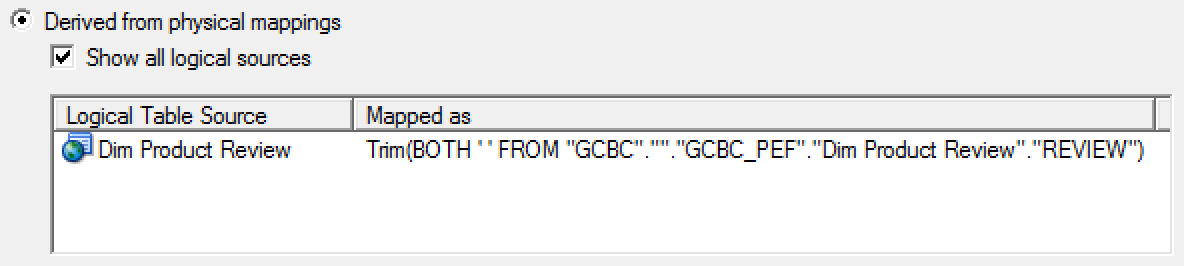
Data cleansing - Sometimes you may need to integrate social networks data into your corporate reports, but you have limited or no control over these contents. For example, you can use the TRIM function to deal with blanks that are expected in a column containing users' reviews for your products.
-
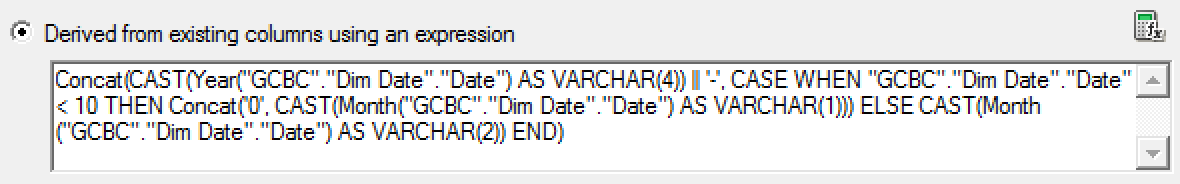
Data conversion - The classic use case for data conversion is when you have to manipulate dates to provide the required format. For example, you can use CAST and Calendar/Date functions to create the format YYYY-MM, required to define the Month level's key of your Date hierarchy, from a date column.
-
Opaque views - An opaque view is a physical layer table that consists of a SELECT statement. The typical use case for opaque views is when you have to turn a transactional data model into a star schema. However opaque views mask the true data structure from OBIEE, preventing it from best generating optimal data access queries, and they should be used only when there are no other available solutions.
We recommend to do this kind of transformations once, at ETL time, rather than every time a particular table or column is used in a query.
Mistake 4: Underuse of Double Column Feature
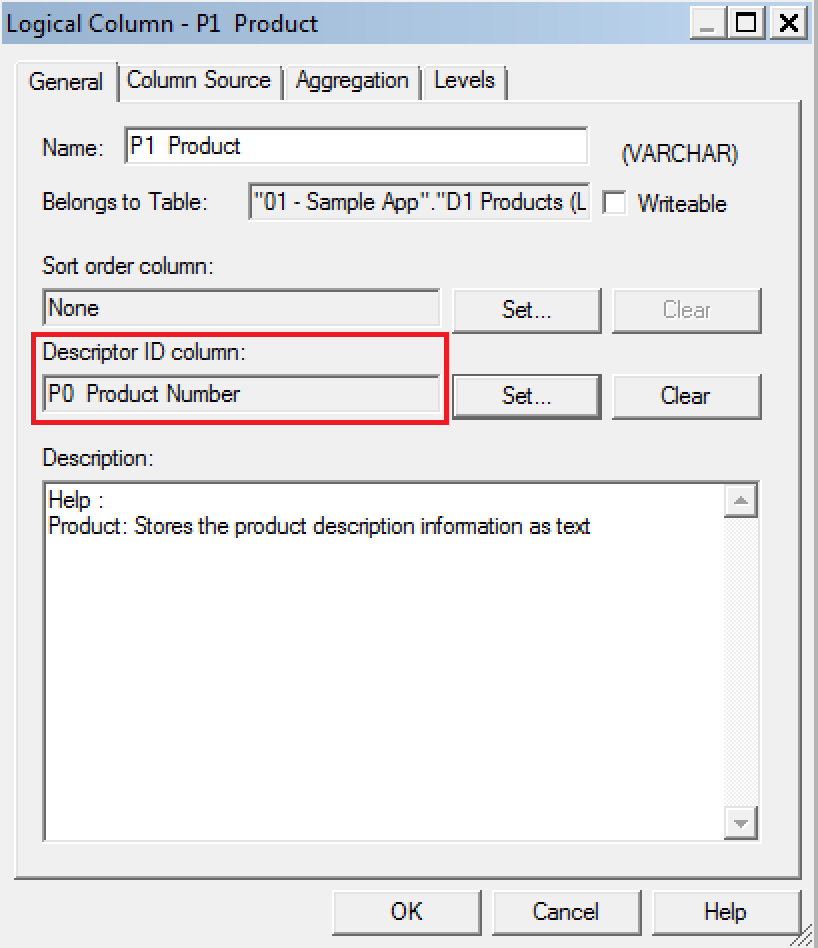
Double Column is probably one of the most undervalued and unused features of OBIEE. It provides a mechanism for associating two logical columns: one column provides the display and description values such as the description of an item; the second column provides a descriptor ID or code column.
Use should be made of the Double Column feature to enable OBIEE to generate more efficient database physical SQL. The principle behind this is that instead of queries running using string-based predicates which may not be indexed in the database or could be less efficient, the user sees the string version of an attribute whilst OBIEE uses the corresponding numerical ID column in the generated query when it queries the database, thus generally creating more optimal execution plans.
As an example, to do this we start with assigning the P0 Product Number column as the descriptor ID column in the Business Model and Mapping layer for P1 Product column:
Let's now create a simple report in Answers containing T05 Per Name Year and 1- Revenue columns, and apply a filter on P1 Product as well. If you are selecting is equal to / is in, is not equal to / is not in or is between operators, then filtering by code values checkbox will be available:
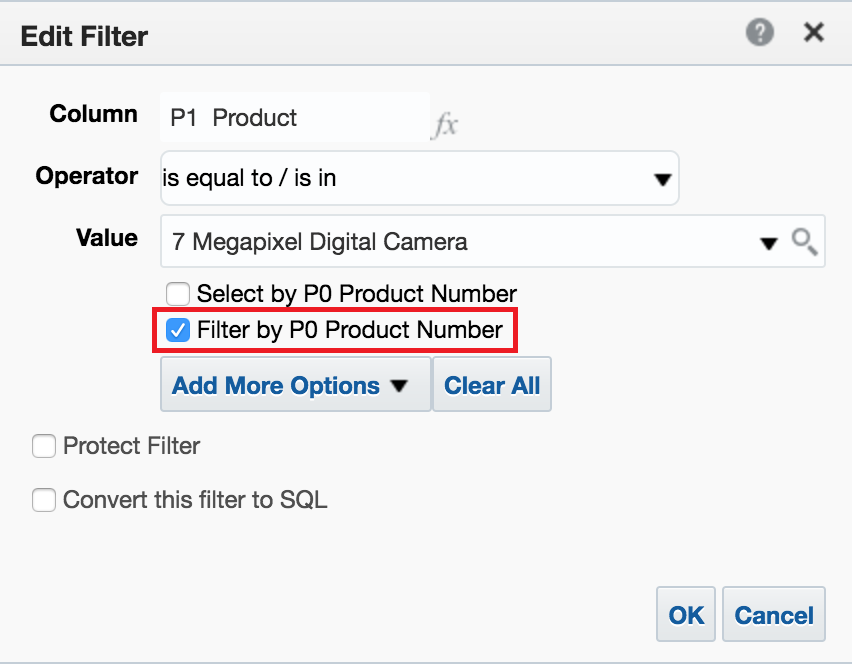
Let's check it, and then see, in terms of SQL, how the query filter is generated:
select sum(T216.Revenue) as c1,
     T795.PER_NAME_YEAR as c2
from
     BISAMPLE.SAMP_PRODUCTS_D T451 /* D10 Product (Dynamic Table) */ ,
     BISAMPLE.SAMP_TIME_QTR_D T795 /* D03 Time Quarter Grain */ ,
     BISAMPLE.SAMP_REVENUE_FA2 T216 /* F21 Rev. (Aggregate 2) */
where  ( T216.Prod_Key = T451.Prod_Key
         and T216.Prod_Key = 7
         and T216.Bill_Qtr_Key = T795.QTR_KEY
         and T451.Prod_Key = 7 )
group by T795.PER_NAME_YEAR
Double Column feature can also be used to define language independent filters as my former colleague Venkat already noted in another post.
Mistake 5: Suboptimal Report Design
Certain suboptimal report designs that I've seen recently include overcrowded analyses, abuse of table / pivot prompts, and OBIEE used as a data extraction tool.
Overcrowded analyses / Overuse of the Excluded area in Views
An overcrowded analysis is an analysis with an awful lot of columns included in Criteria tab and several different views with many excluded columns. These views can then be displayed all together or spread out different dashboard pages.
This pattern is quite common with clients that migrated from Hyperion Interactive Reporting and the main motivation for it - there is only one analysis to maintain - may sound good. However, since Oracle BI Server retrieves results for all columns specified in Criteria tab, we recommend to create several analyses with a single view rather than adopt this pattern. In this way the BI Server generates more efficient queries and avoids on the fly data aggregation.
As an example, you can use Oracle Sample Application v607 to create and run an analysis with a Line-Bar view as follows. Note the huge number of columns in the Excluded area.
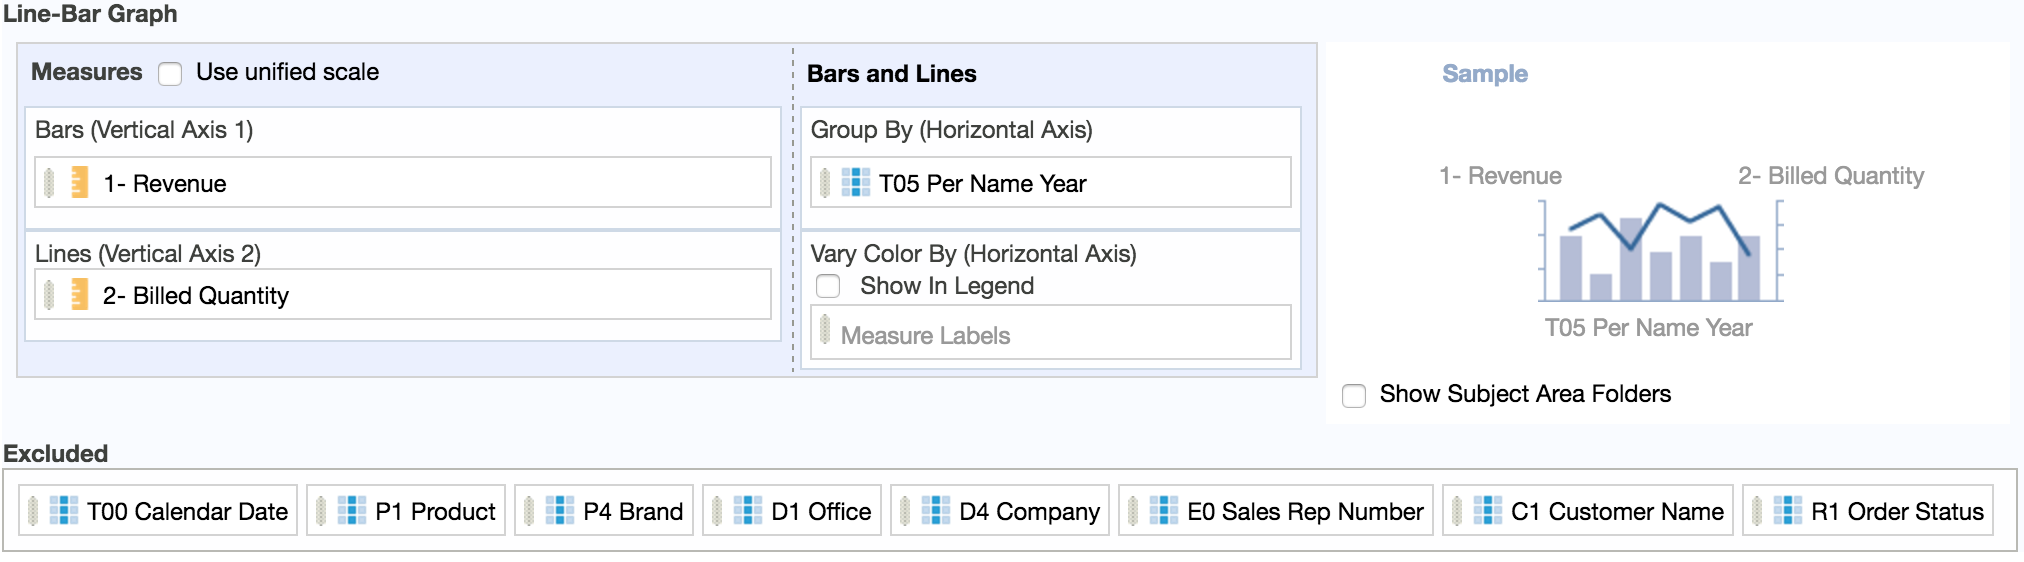
This will results in a simple chart with 3 bars and a line connecting 3 points:
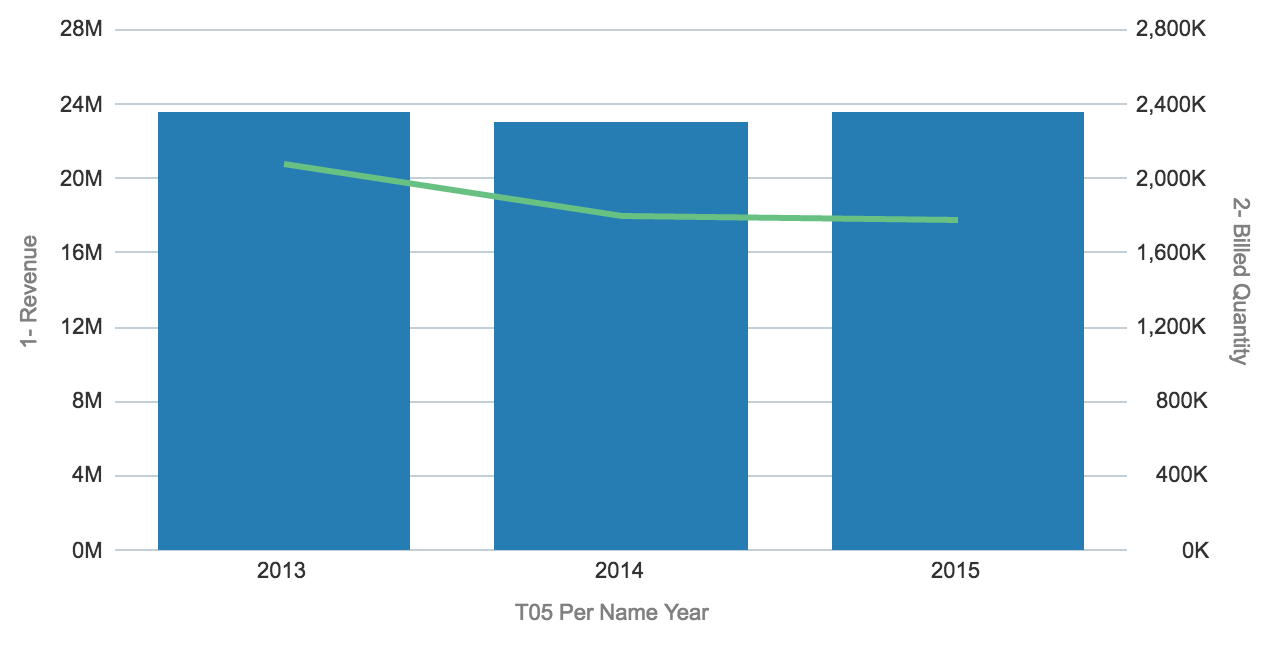
Let's open obis1-query.log log file and have a look at the physical SQL generated by the BI Server:
select sum(T418.Units) as c1,
     sum(T418.Revenue) as c2,
     T762.Name as c3,
     T666.Office_Dsc as c4,
     T666.Company as c5,
     T418.Order_Status as c6,
     T451.Prod_Dsc as c7,
     T451.Brand as c8,
     T437.Employee_Key as c9,
     T42.Calendar_Date as c10,
     T42.Per_Name_Year as c11,
     T666.Office_Key as c12,
     T762.Cust_Key as c13,
     T451.Prod_Key as c14,
     T666.Company_Key as c15
from
     BISAMPLE.SAMP_PRODUCTS_D T451 /* D10 Product (Dynamic Table) */ ,
     BISAMPLE.SAMP_TIME_DAY_D T42 /* D01 Time Day Grain */ ,
     BISAMPLE.SAMP_CUSTOMERS_D T762 /* D60 Customers */ ,
     BISAMPLE.SAMP_OFFICES_D T666 /* D30 Offices */ ,
     BISAMPLE.SAMP_EMPL_D_VH T437 /* D50 Sales Rep (Parent Child Hierarchy) */ ,
     BISAMPLE.SAMP_EMPL_PARENT_CHILD_MAP T490 /* D51 Closure Table Sales Rep Parent Child */ ,
     BISAMPLE.SAMP_REVENUE_F T418 /* F10 Billed Rev */
where  ( T42.Calendar_Date = T418.Bill_Day_Dt and T418.Cust_Key = T762.Cust_Key and T418.Prod_Key = T451.Prod_Key and T418.Empl_Key = T490.Member_Key and T418.Office_Key = T666.Office_Key and T437.Employee_Key = T490.Ancestor_Key )
group by T42.Calendar_Date, T42.Per_Name_Year, T418.Order_Status, T437.Employee_Key, T451.Prod_Key, T451.Prod_Dsc, T451.Brand, T666.Company_Key, T666.Office_Dsc, T666.Company, T666.Office_Key, T762.Name, T762.Cust_Key)
The physical SQL code doesn't look as simple as the resulting view! But the worst is yet to come: it will take about 7 seconds to complete and 256k rows (1.5 GB) will be retrieved from the database!
Let's remove all the excluded columns from the analysis and see what happens to the physical SQL:
select sum(T216.Units) as c1,
     sum(T216.Revenue) as c2,
     T795.PER_NAME_YEAR as c3
from
     BISAMPLE.SAMP_TIME_QTR_D T795 /* D03 Time Quarter Grain */ ,
     BISAMPLE.SAMP_REVENUE_FA2 T216 /* F21 Rev. (Aggregate 2) */
where  ( T216.Bill_Qtr_Key = T795.QTR_KEY )
group by T795.PER_NAME_YEAR
Definitely far better than it looked before. Moreover it will take about 0.2 seconds - 97% less - to complete and only 3 rows (3 KB) - 99% less - will be retrieved from the database.
Abuse of Table / Pivot prompts
Table / Pivot prompts provides an interactive result set that enables users to select the data that they want to view. However Table prompts doesn’t apply any WHERE condition to the query issued by the BI Server: it will retrieve the full result set first, and then select the data to display on the fly. For this reason we recommend to use Dashboard prompts rather than Table / Pivot prompts.
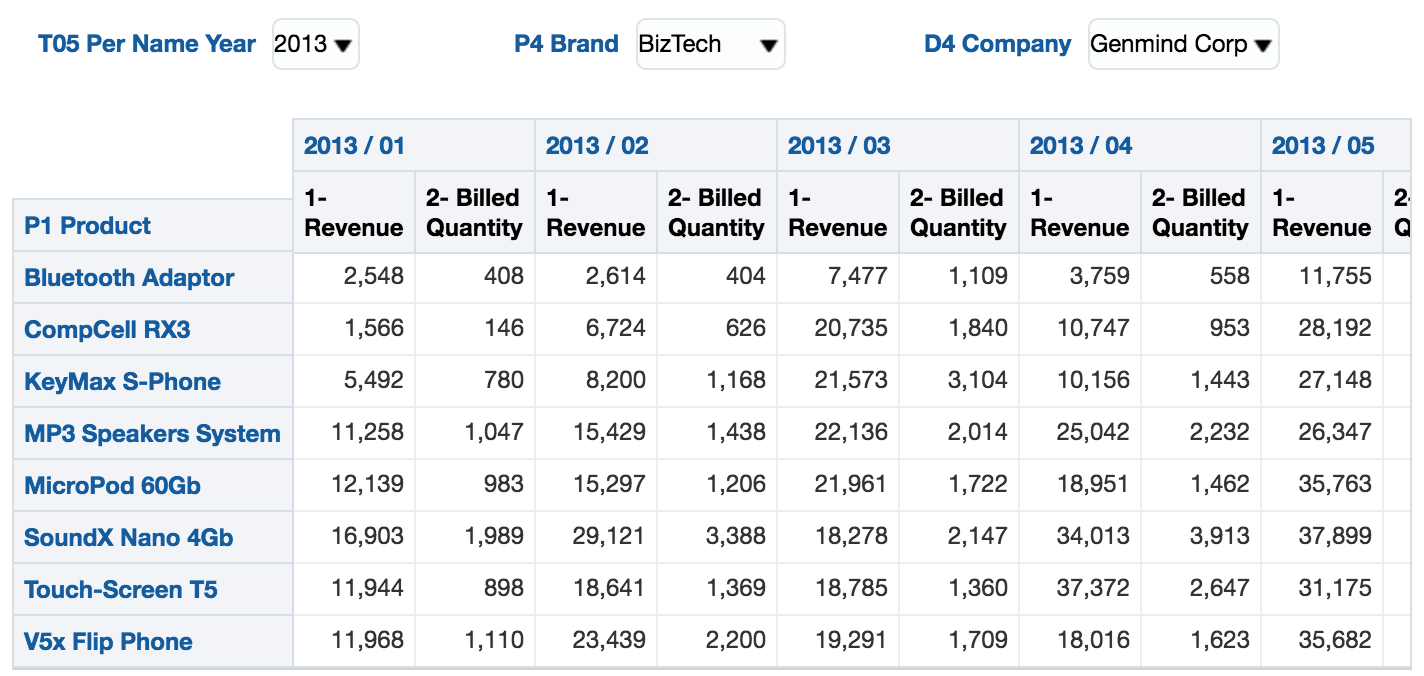
As an example, you can create and run an analysis with a Pivot Table view as follow:
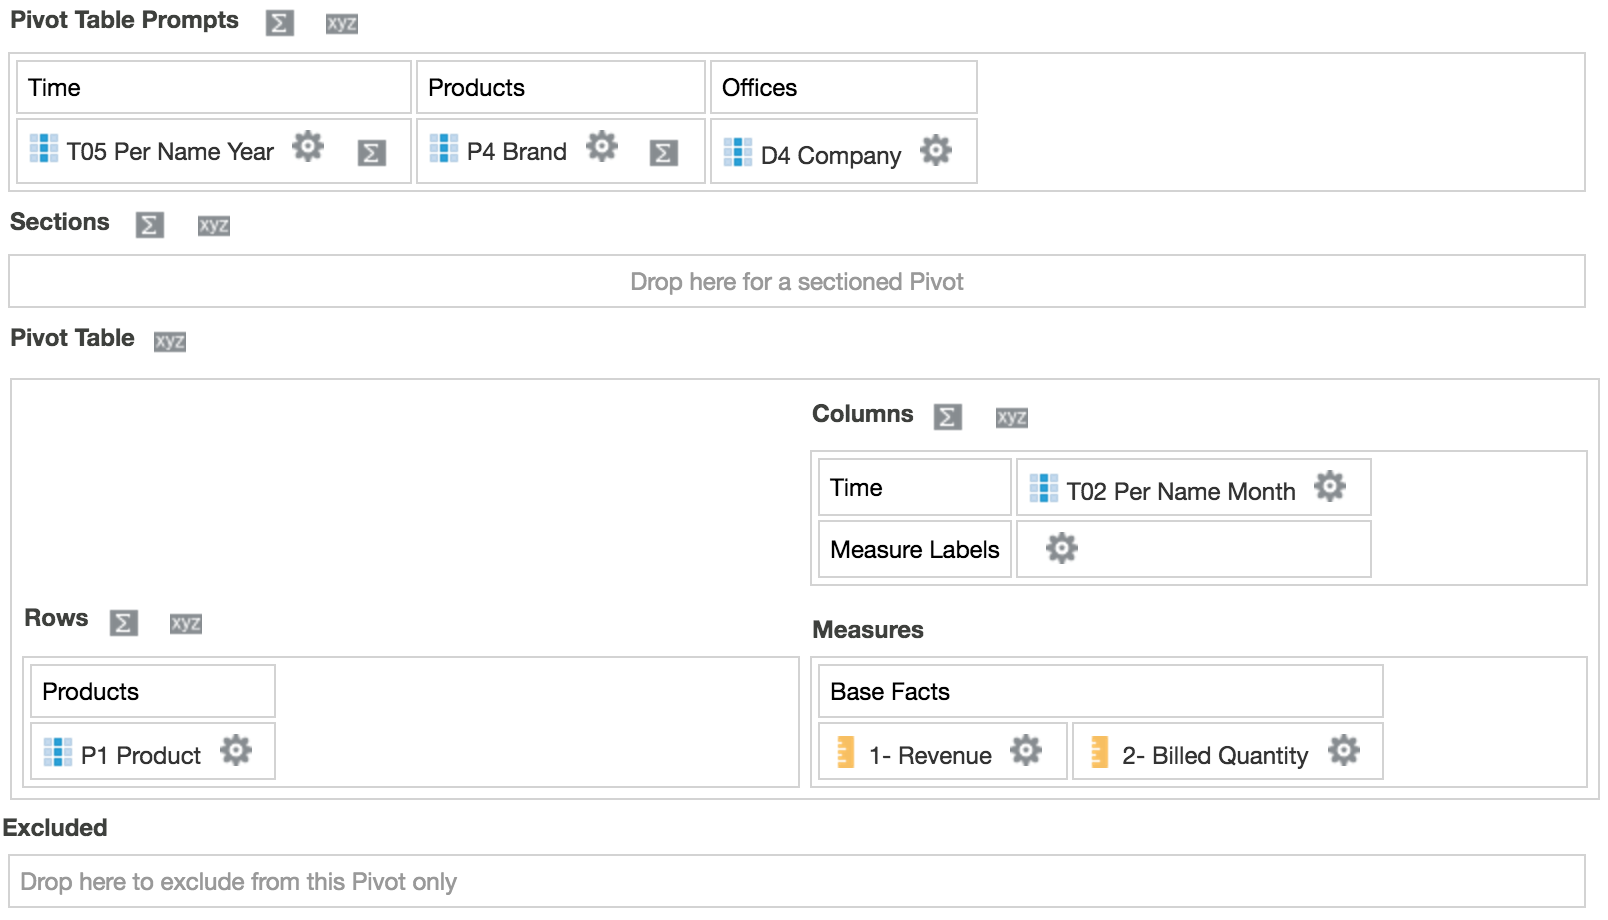
This will results in a pivot table with 8 rows and 25 columns:
Again, let's open obis1-query.log log file and have a look at the physical SQL generated by the BI Server:
select sum(T418.Units) as c1,
     sum(T418.Revenue) as c2,
     T666.Company as c3,
     T451.Prod_Dsc as c4,
     T451.Brand as c5,
     T653.Per_Name_Month as c6,
     T653.Per_Name_Year as c7,
     T666.Company_Key as c8,
     T451.Prod_Key as c9
from
     BISAMPLE.SAMP_PRODUCTS_D T451 /* D10 Product (Dynamic Table) */ ,
     BISAMPLE.SAMP_TIME_MTH_D T653 /* D02 Time Month Grain */ ,
     BISAMPLE.SAMP_OFFICES_D T666 /* D30 Offices */ ,
     BISAMPLE.SAMP_REVENUE_F T418 /* F10 Billed Rev */
where  ( T418.Prod_Key = T451.Prod_Key and T418.Bill_Mth_Key = T653.Mth_Key and T418.Office_Key = T666.Office_Key )
group by T451.Prod_Key, T451.Prod_Dsc, T451.Brand, T653.Per_Name_Year, T653.Per_Name_Month, T666.Company_Key, T666.Company
As expected no WHERE condition based on selected values in pivot prompts was applied to the query. It will take about 0.3 seconds to complete and 2k rows (10 MB) will be retrieved from the database.
Now let's replace pivot prompts with dashboard prompts and see what happens to the physical SQL:
select sum(T418.Units) as c1,
     sum(T418.Revenue) as c2,
     T451.Prod_Dsc as c3,
     T653.Per_Name_Month as c4,
     T451.Prod_Key as c5
from
     BISAMPLE.SAMP_PRODUCTS_D T451 /* D10 Product (Dynamic Table) */ ,
     BISAMPLE.SAMP_TIME_MTH_D T653 /* D02 Time Month Grain */ ,
     BISAMPLE.SAMP_OFFICES_D T666 /* D30 Offices */ ,
     BISAMPLE.SAMP_REVENUE_F T418 /* F10 Billed Rev */
where  ( T418.Prod_Key = T451.Prod_Key and T418.Bill_Mth_Key = T653.Mth_Key and T418.Office_Key = T666.Office_Key and T451.Brand = 'BizTech' and T653.Per_Name_Year = '2013' and T666.Company = 'Genmind Corp' )
group by T451.Prod_Key, T451.Prod_Dsc, T653.Per_Name_Month
It looks better than before, huh? The optimised code will take about 0.1 seconds - 67% less - to complete and 96 rows (0.2 MB) - 95% less - will be retrieved from the database.
OBIEE as a data extraction tool
A large number of clients are using OBIEE mostly as a feed for Excel-marts. Using OBIEE simply as a data extraction tool for lots of data into Excel or other destinations can cause both performance and functional problems. OBIEE is designed to be primarily used as a reporting and analytics tool, with users interacting with the data within OBIEE and, as my colleague Francesco Tisiot already noted in another post, almost any transformation doable in Excel can be achieved in OBIEE, probably faster and with zero impact on local workstations.
This behaviour could highlight a lack of end user training and / or communication between them and BI developers. End users may don't know OBIEE at all, but are used to working with Excel: at the end of the day people just want their job done as painlessly as possible. We recommend to talk to your end users about what they're doing with the data in their destination system, and whether the same can be achieved within OBIEE. If users really do just need the data in Excel, then you should look at how best to do it (Oracle Doc ID 1558070.1).
Conclusion
I've shown here some of the pitfalls that are commonly made with OBIEE. They can impact the performance for end-users, as well as making life more difficult for those building and maintaining the reports.
If you'd like Rittman Mead to take a look at your OBIEE implementation and make sure you're getting the best out of it, please do get in touch!