An Oracle DVD story of... DVDs
Have you ever wondered what the trend in movie releases has been for the past few decades? Comparing the number of Sci-Fi releases vs. Romantic Comedy releases? Me too, which is why I've taken my first look Oracle Data Visualization Desktop (DVD) to spot trends between these movie genres - Sci-Fi and the Romantic Comedy.
For this post, I found an interesting dataset from IMDB.com on Kaggle.com, listing a smattering of movies since the early 1900s from which to sort and analyze. For this example, I will contrast the number of releases between the two movie genres, looking for any possible relationship as to number of releases for both.
If you haven't installed the application yet, take a quick look at Matthew Walding's post for a good introduction. Oracle's DVD installer is fairly quick and simple, and you'll be creating visualizations in no time.
So, once the DVD application is running, we can create our first project:
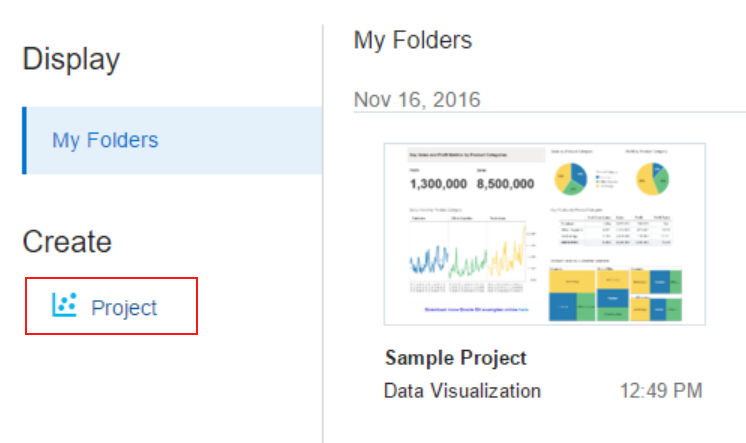
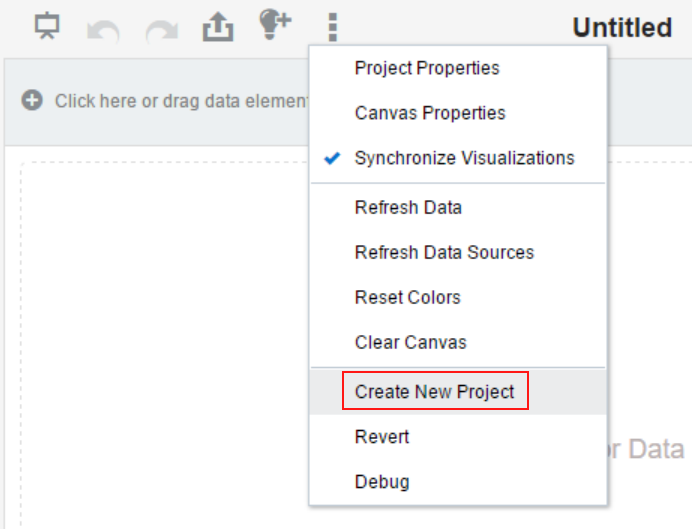
Or, alternatively...
Next, we'll need a data source:
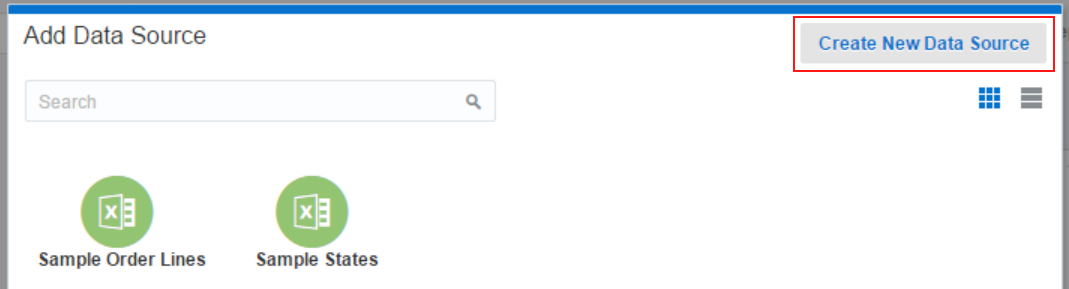
And, we'll import the CSV-formatted file I downloaded from Kaggle.com earlier:

Select the "movie_metadata.csv" file to import:
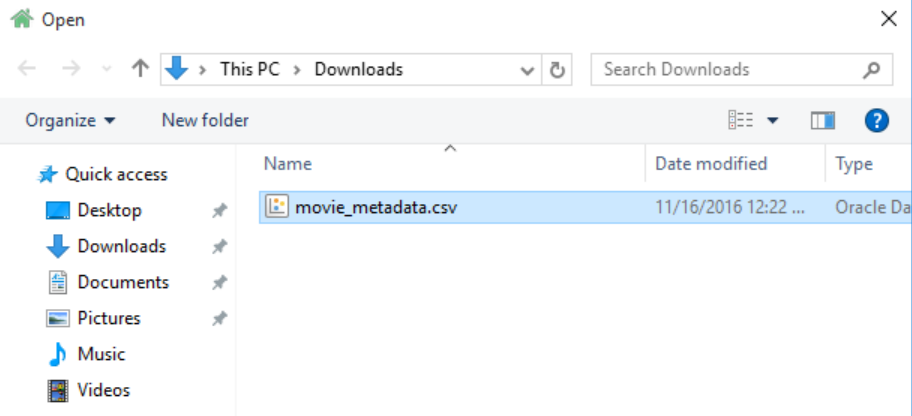
And, change the Name to "IMDB Movies A" for clarification:
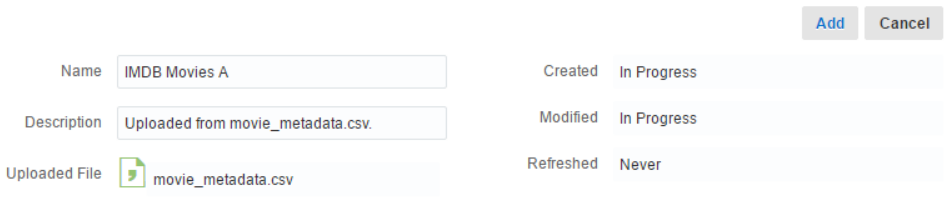
After the file has been imported, we see a problem:
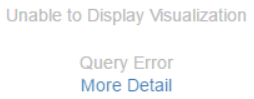
Clicking "More Detail", the following screen displays the detail we can use to troubleshoot the query error:
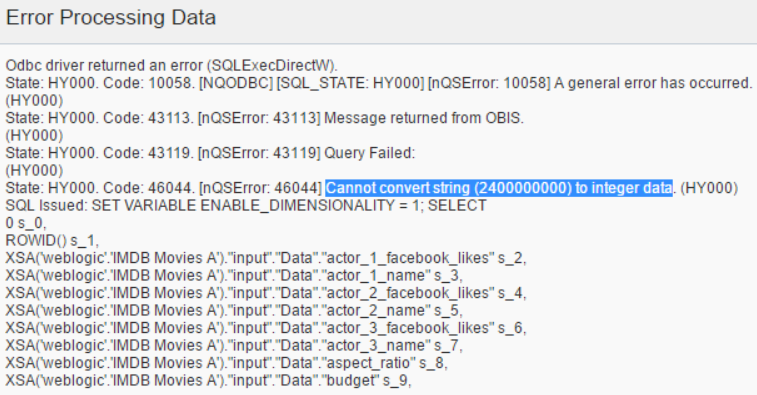
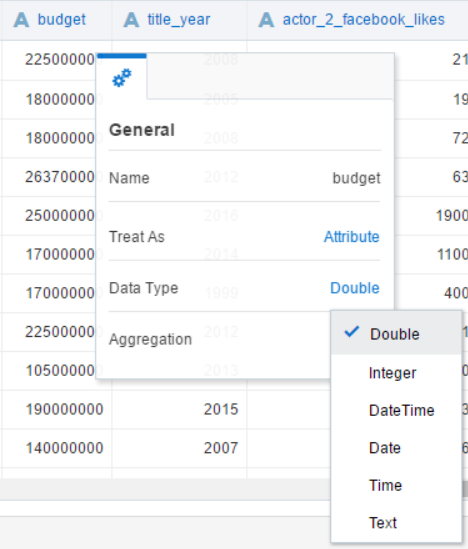
For troubleshooting, I used the highlighted value and found the problem is with the "budget" column, which requires a datatype change from "Integer" to "Double":
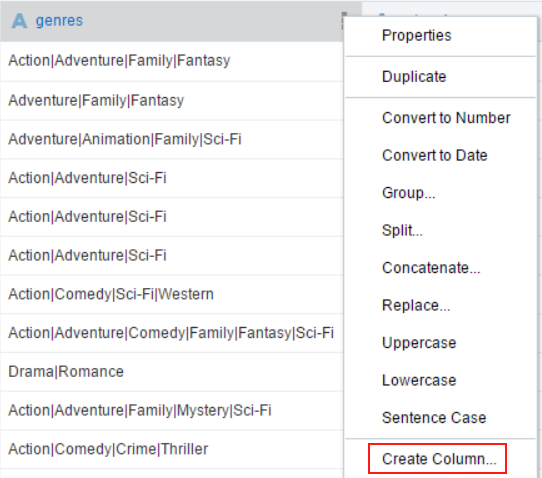
The next task is to create a method of identifying a specific movie genre, however, as you can see, all genre labels for each movie are stored in a pipe-delimited value of the genres column:
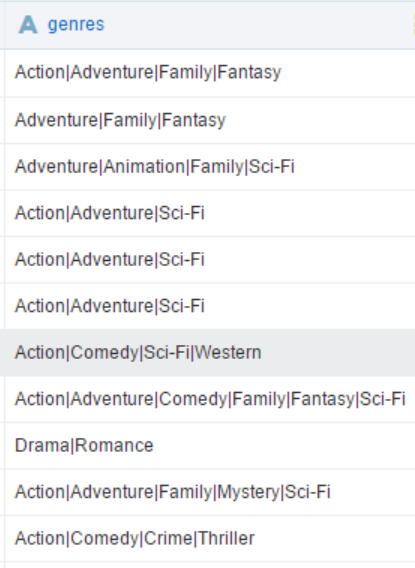
So, for this demonstration, I've chosen to add a calculated column for each genre I want to analyze, locating the desired string within the pipe-delimited value under the assumption that the same value, "Sci-Fi" for instance, is recorded with the same characters in every occurrence of each pipe-delimited value.
For the first column (data element), I chose the functions LOCATE and SIGN to provide a simple logical indicator (0 and 1) that can be aggregated (summed) easily.
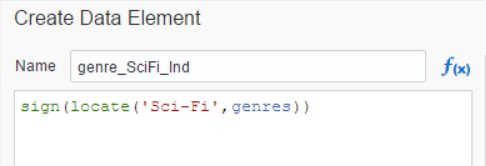
Click the "Validate" button to verify syntax:

The LOCATE function returns a positive integer where the expression "Sci-Fi" is located in a given string, the genres data element in this case. The SIGN function subsequently returns either a 0, 1, or -1, depending on the sign of the resulting integer from the LOCATE function. 1 (one) indicates yes, this movie release includes a Sci-Fi label for genre. 0 (zero) indicates a missing Sci-Fi label for genre, for example.
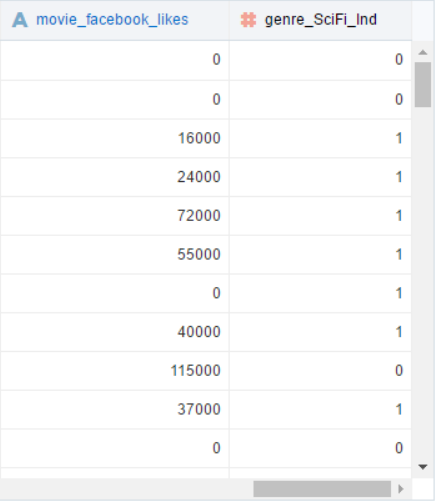
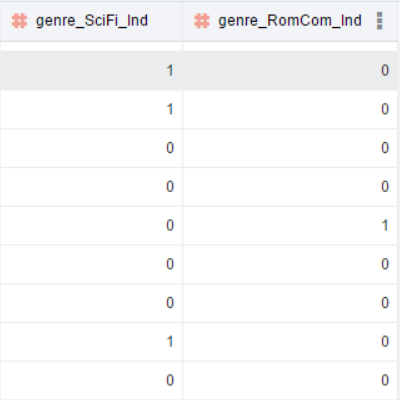
Here is the new column, appended to our existing dataset:
Next, I will create another column to identify the Romantic Comedy genre - genre_RomCom_Ind, as follows:
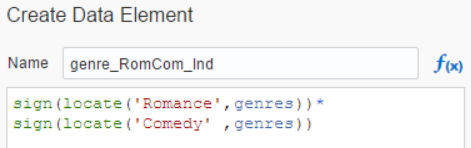
With the two new data columns, our dataset is expanded accordingly:
Now, it's let's create the visualizations:
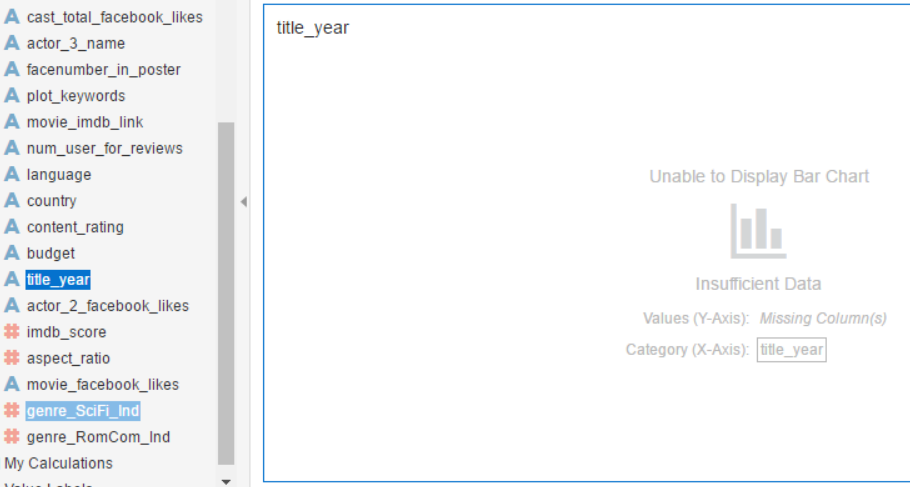
Let's create a bar graph for each of our new Indicator columns, starting with the Sci-Fi genre:
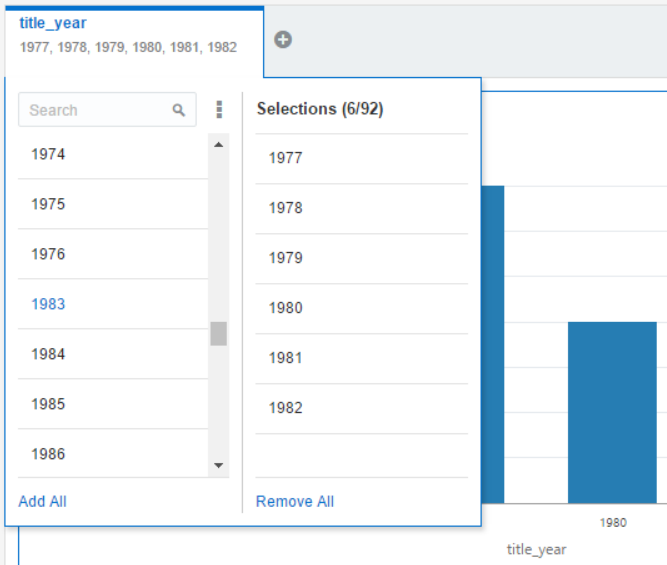
We'll create a filter to include data only for title years between 1977 and 2015:
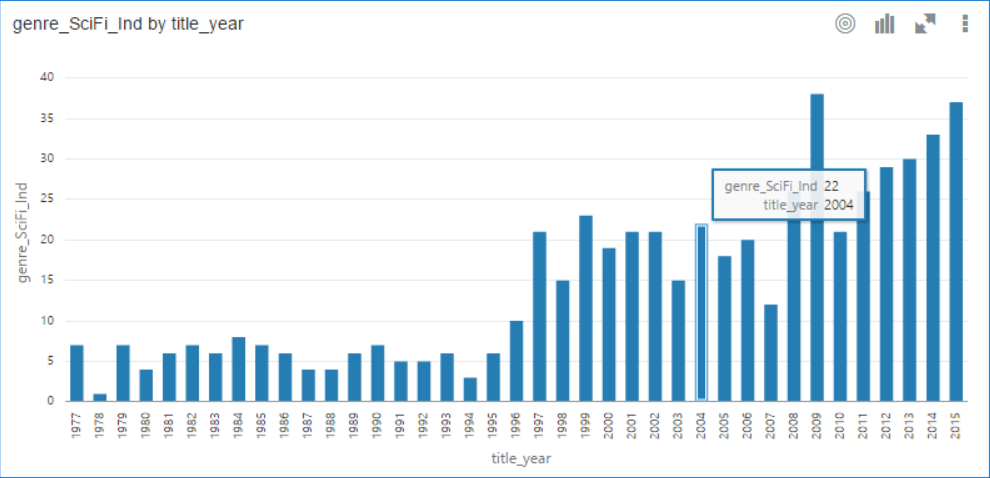
Afterward, our initial graph appears as follows, with a default aggregate summing all genre_SciFi_Ind values (0 or 1) for each title year:
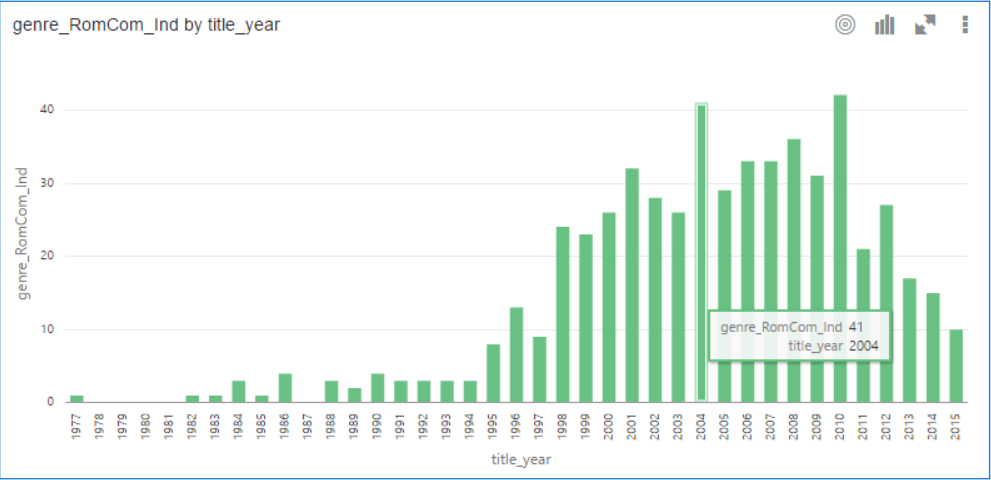
Now, let's add a similar bar graph for all Romantic Comedy (genre_RomCom_Ind) releases. Notice, the same filter for title year will be applied to this new graph:
Next, I'll change the labels for each graph, providing proper context for the visualization:
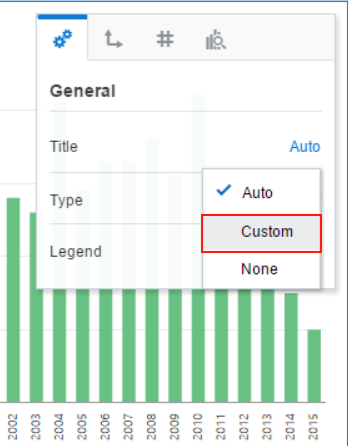
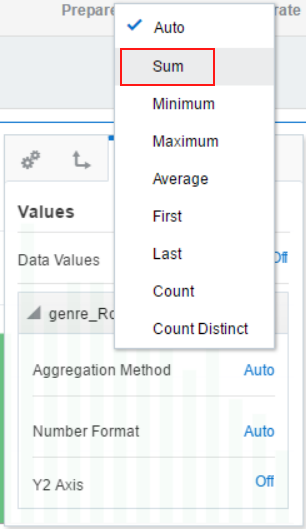
We can also change the aggregate method used for the graph, when necessary:
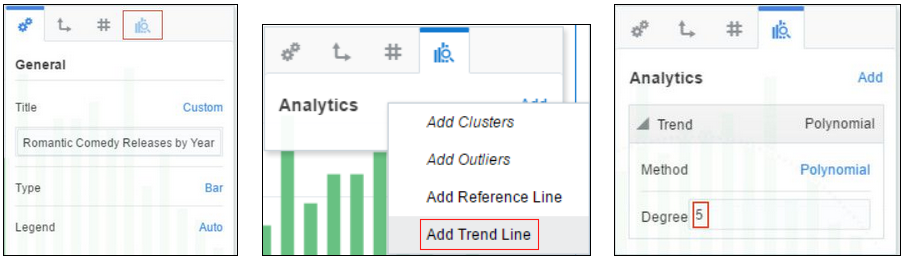
For an added touch, let's add a trend line to the bar graph for even easier viewing:
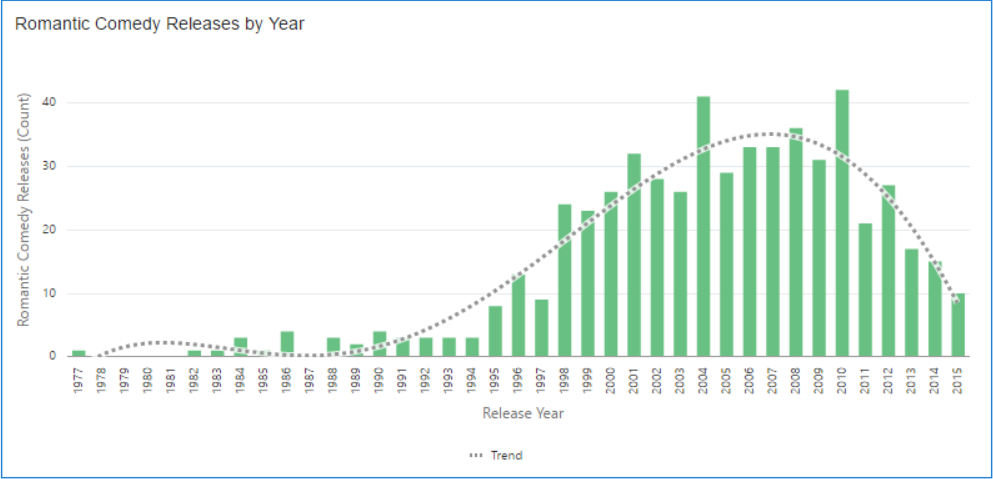
And now, our graph appears as follows:
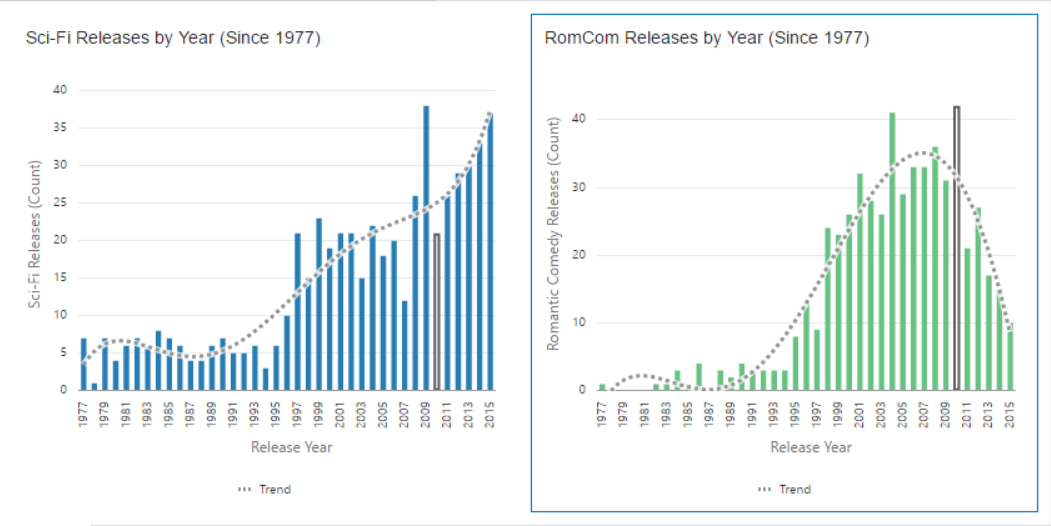
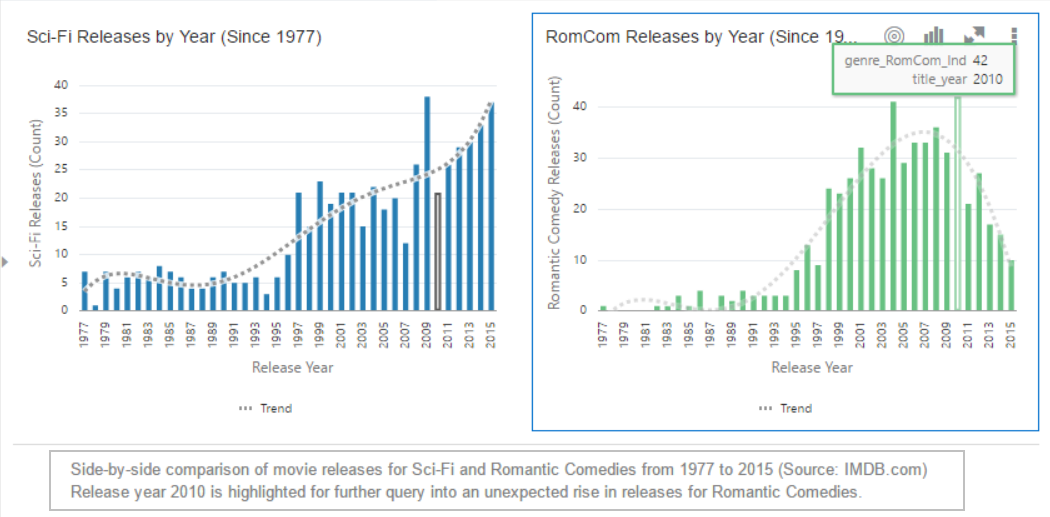
Applying similar modifications to our Sci-Fi Releases graph and displaying both graphs together on Canvas 1, we have the following:
Next, we'll add this Canvas to an Insight, select Narrate, and add our own description of any interesting comparisons we can identify:
In viewing the two graphs side-by-side, we notice one interesting outlier that, in year 2010, the number of Romantic Comedy releases outnumbered Sci-Fi releases by 21 movies, and on this Insight, I can enter a description (narration) beneath the graphs, highlighting this departure from the plotted trend line, as shown below. Another interesting, and unexpected, trend we see is the decreasing number of Romantic Comedy releases after 2008. But, do these two graphs display an obvious relationship, or correlation, between the two genres, either positive or negative? If we look at each trend line between 1990 and 2008, each movie genre shows an increasing number of releases, generally speaking, and leaves a somewhat inconclusive determination as to correlation, although, the periods after 2008 seem to indicate an inverse relationship.
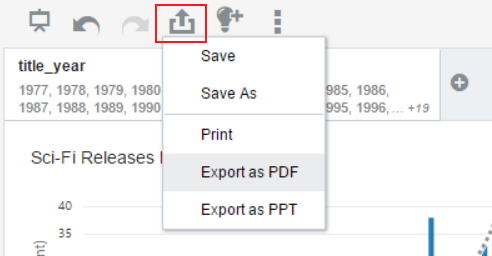
At this point, the project can be saved (with a new title), exported, and/or printed:
In this post, I've demonstrated a basic example as an introduction to Oracle Data Visualization Desktop, with IMDB movie data, to visually quantify the number of movie releases in a given timeline, 1977 to 2015, creating custom calculations and dynamic visualizations for our particular measures.
One note I would add is that I did not attempt to eliminate any overlapping indicators, which were minimal, in the newly-added columns, genre_Sci-Fi_Ind and genre_RomCom_Ind. Although, it is possible that a movie can be labeled as all three - Sci-Fi, Romance, and Comedy, it did not distort the overall trend. And, these graphs now create a question - Can we know what influences the release of Sci-Fi movies and their increasing popularity? Are Romantic Comedy movies truly decreasing in popularity or is the movie studios choice to decrease the number of RomCom releases because of the surge in Sci-Fi releases? We all understand limitations of all studios investment capital, but must the RomCom genre suffer because of the Sci-Fi genre? If so, why? I realize this is a simplified view of the trend, but does lend itself to more scrutiny among other genres as well.