Common Questions and Misconceptions in The Data Science Field

There are many types of scenarios in which data science could help your business. For example, customer retention, process automation, improving operational efficiency or user experience.
It is not however always initially clear which questions to concentrate on, or how to achieve your aims.
This post presents information about the type of questions you could address using your data and common forms of bias that may be encountered.
Types of Question
-
Descriptive: Describe the main features of the data, no implied meaning is inferred. This will almost always be the first kind of analysis performed on the data.
-
Exploratory: Exploring the data to find previously unknown relationships. Some of the found relationships may define future projects.
-
Inferential: Looking at trends in a small sample of a data set and extrapolating to the entire population. In this type of scenario you would end up with an estimation of the value and an associated error. Inference depends heavily on both the population and the sampling technique.
-
Predictive: Look at current and historical trends to make predictions about future events. Even if x predicts y, x does not cause y. Accurate predictions are hard to achieve and depend heavily on having the correct predictors in the data set. Arguably more data often leads to better results however, large data sets are not always required.
-
Causal: To get the real relationship between variables you need to use randomised control trials and measure average effects. i.e. if you change x by this much how does y change. Even though this can be carried out on observed data huge assumptions are required and large errors would be introduced into the results.
Biases in data collection or cleaning
It is very easy to introduce biases into your data or methods if you are not careful.
Here are some of the most frequent:
-
Selection/sampling bias: If the population selected does not represent the actual population, the results are skewed. This commonly occurs when data is selected subjectively rather than objectively or when non-random data has been selected.
-
Confirmation bias: Occurs when there is an intentional or unintentional desire to prove a hypothesis, assumption, or opinion.
-
Outliers: Extreme data values that are significantly out of the normal range of values can completely bias the results of an analysis. If the outliers are not removed in these cases the results of the analysis can be misleading. These outliers are often interesting cases and ought to be investigated separately.
-
Simpson's Paradox: A trend that is indicated in the data can reverse when the data is split into comprising groups.
-
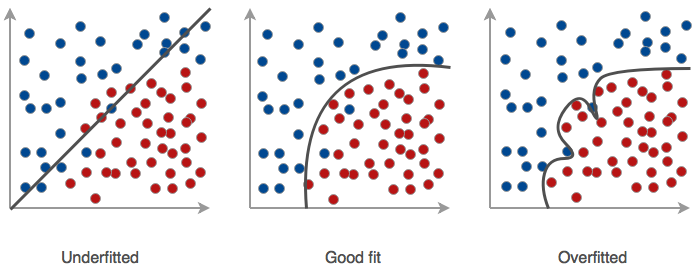
Overfitting: Involves an overly complex model which overestimates the effect/relevance of the examples in the training data and/or starts fitting to the noise in the training data.
-
Underfitting: Occurs when the underlying trend in the data is not found. Could occur if you try to fit a linear model to non linear data or if there is not enough data available to train the model.
-
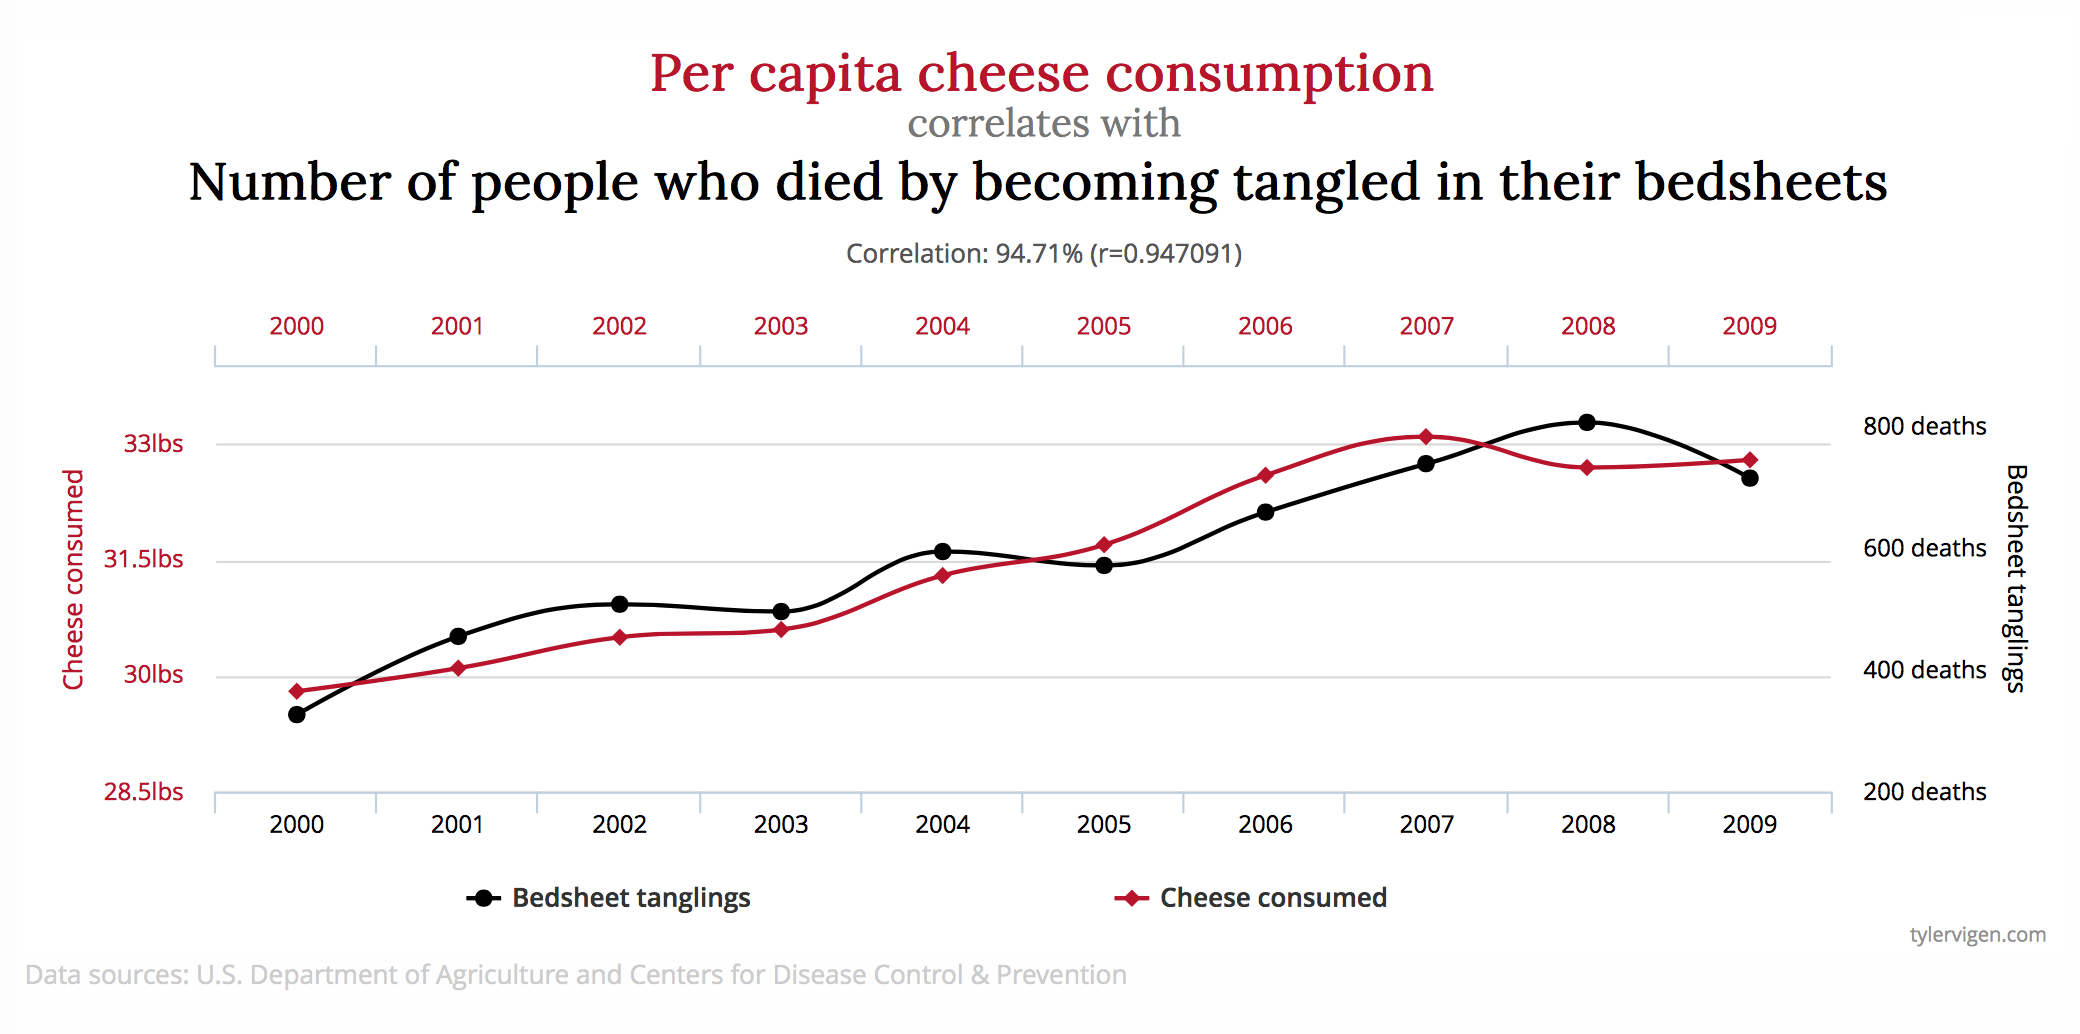
Confounding Variables: Two variables may be assumed related when in fact they are both related to an omitted confounding variable. This is why correlation does not imply causation.
- Non-Normality: If a distribution is assumed to be normal when it is not the results may be biased and misleading.
- Data Dredging: This process involves testing huge numbers of hypotheses about a single data set until the desired outcome is found.
Citations:
Comics from Dilbert Comics By Scott Adams.
Spurious Correlations from http://tylervigen.com/spurious-correlations.
Insights Lab
To learn more about the Rittman Mead Insights Lab please read my previous blog post about our methodology.
Or contact us at info@rittmanmead.com