Tracing Data Lineage from Source Column to End User


A while ago I blogged about our Lineage Tool, which back then was limited to diving into the ODI Work Repository and emerging from it with source-to-target data flow diagrams. The task at hand was simple and the design straightforward: show Source and Target database entities and connect them with arrows representing the ELT logic in ODI Mappings. The hierarchy to use to drill down from summary to detail was quite natural: ODI Environment > ODI Model > Datastore (Table) > Attribute (Column).
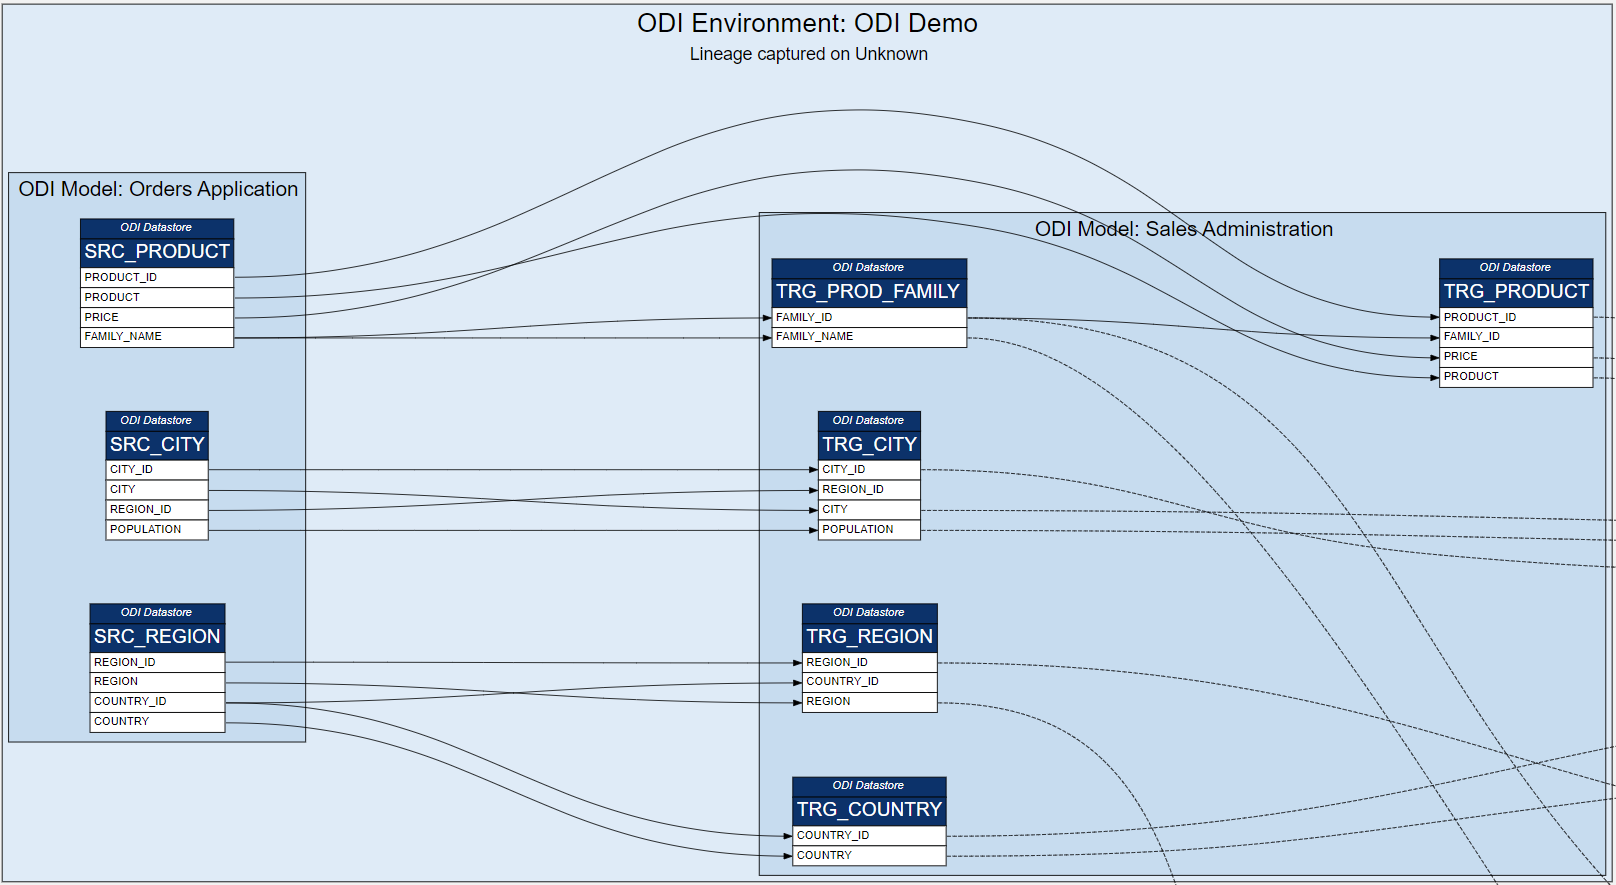
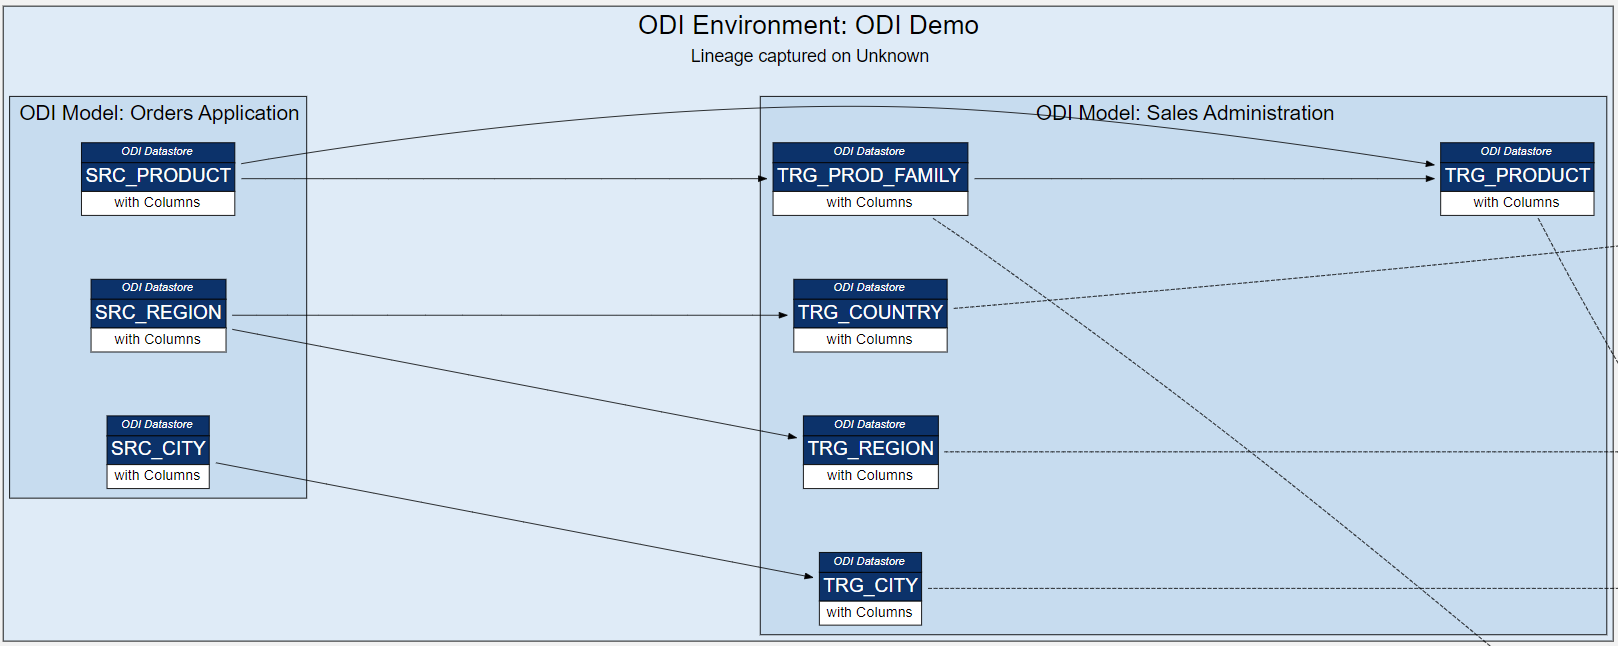
This 4-level hierarchy works very well with ODI. Here is a view at the Table level:(Similarly we can have views at the Model or the Environment level.)
However, there was a temptation to add more to the lineage: OBIEE (OAS/OAC) RPD and Web Catalog lend themselves nicely to lineage analysis. In fact, in the case of these two, Oracle allows us to generate lineage reports from the Model Administration Tool and Catalog Manager respectively.
Starting with RPD's Physical Model, we have very similar entities there: Physical Tables and their Aliases have Columns. Tables are grouped into Physical Schemas, which in turn are part of Databases. It looks like we have one more hierarchy level here: OBIEE Environment > Database > Physical Schema > Physical Table / Alias > Column. We could acknowledge that different lineage analysis sources will have different hierarchies with their own number of hierarchy levels. However, we also want to see the entire lineage across ODI and OBIEE at a certain hierarchy level - showing ODI lineage at a Column level and OBIEE lineage at a Table level will not work very well. Therefore we had to force all hierarchies to conform to 4 hierarchy levels. Here is the OBIEE RPD Physical Layer:
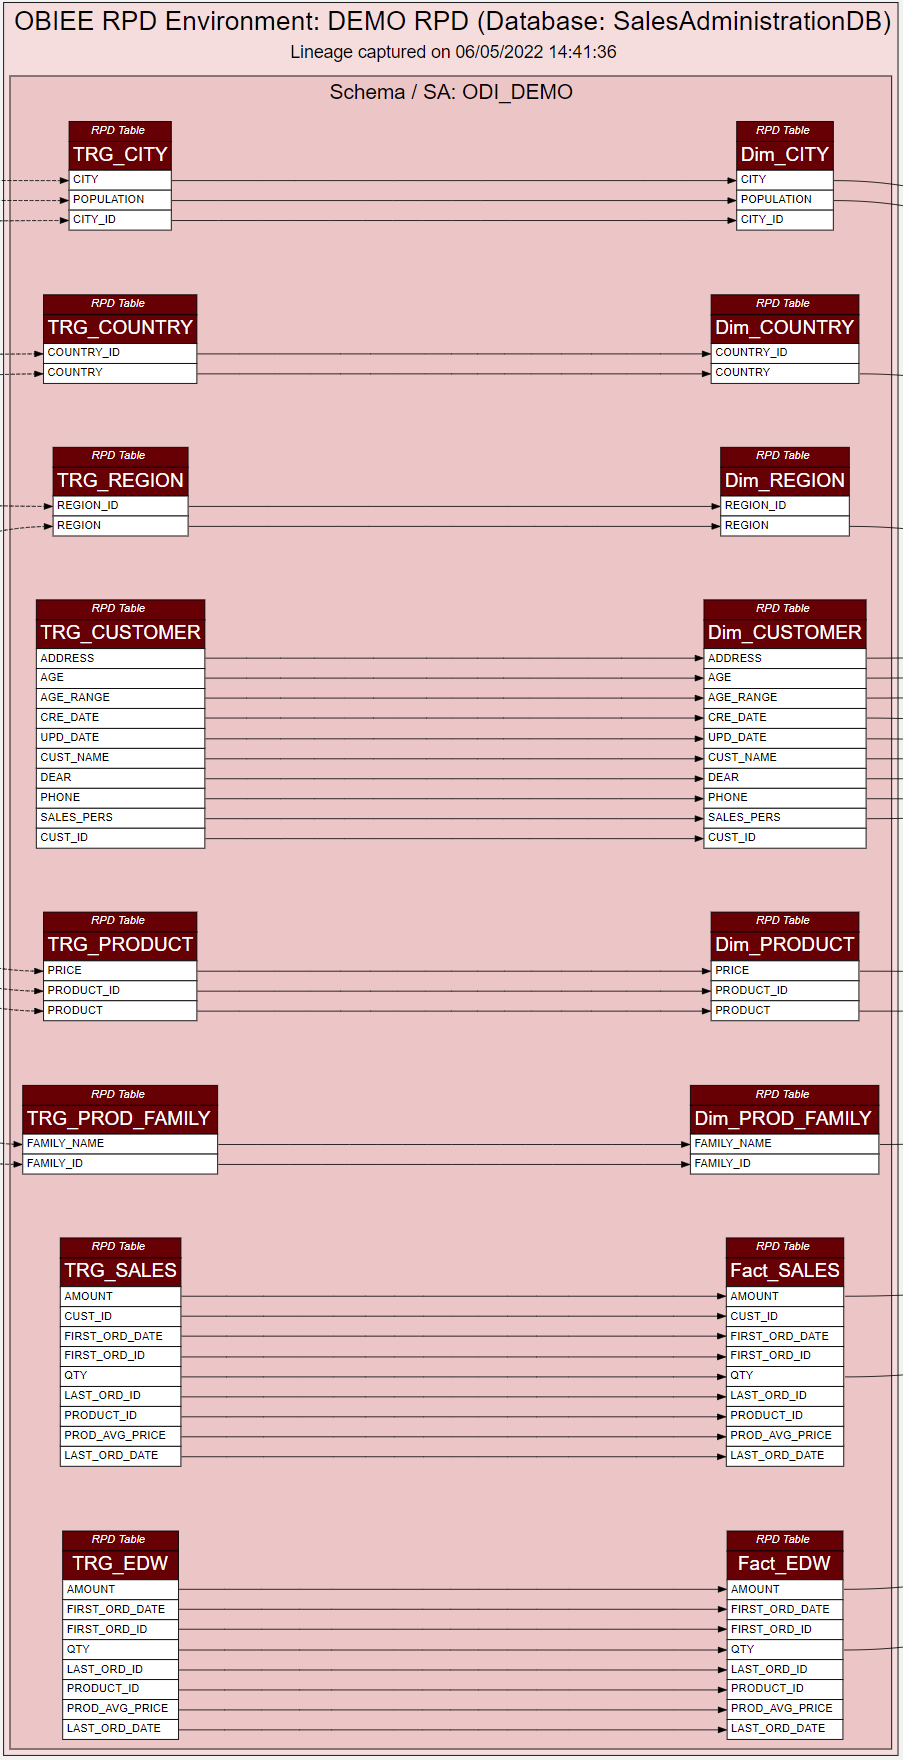
We have 4 hierarchy levels instead of 5 - Environment and Database are squeezed into a single level.
Notice Physical Tables on the left and their Aliases on the right - table and view aliasing naturally becomes part of the lineage flow.
Further down the lineage line, we have the OBIEE Presentation Layer - we can keep the Lineage more compact by hiding the BMM Layer by going from Physical straight to Presentation. Controversial? Yes, we do not always want as much detail in a diagram as possible. Just like our ODI lineage diagram that shows only Source and Target tables, hiding the inner workings of the ODI Mapping.
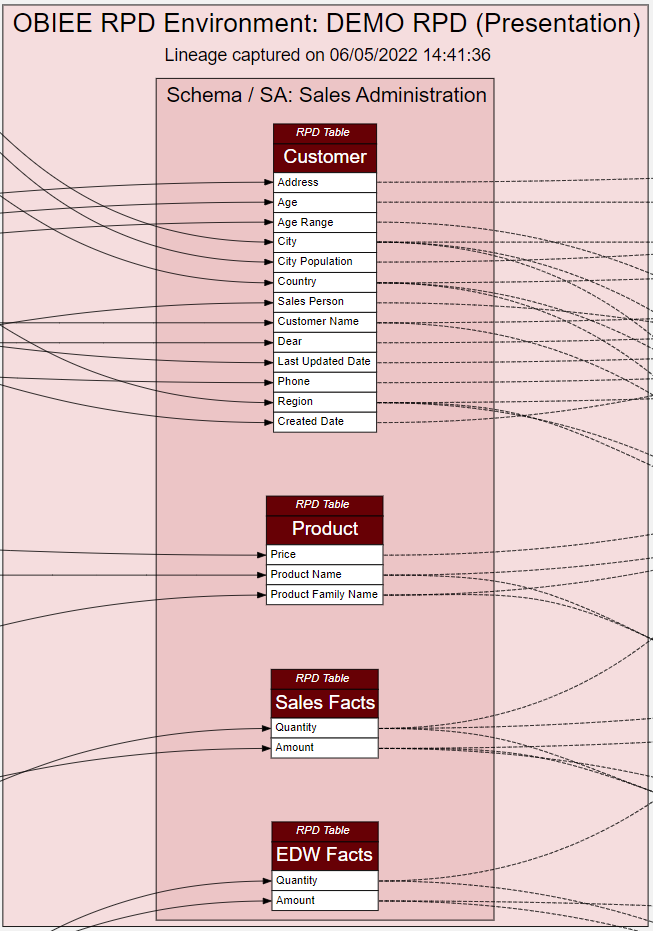
Here we have Presentation Tables and their Columns, Subject Area (SA) instead of a Schema, OBIEE RPD Environment at the top. This time there is no need to an extra hierarchy level, but we add (Presentation) after the Environment name to better distinguish it from the Physical Layer.
Adding OBIEE Web Catalog to our Lineage is no harder than adding the RPD.
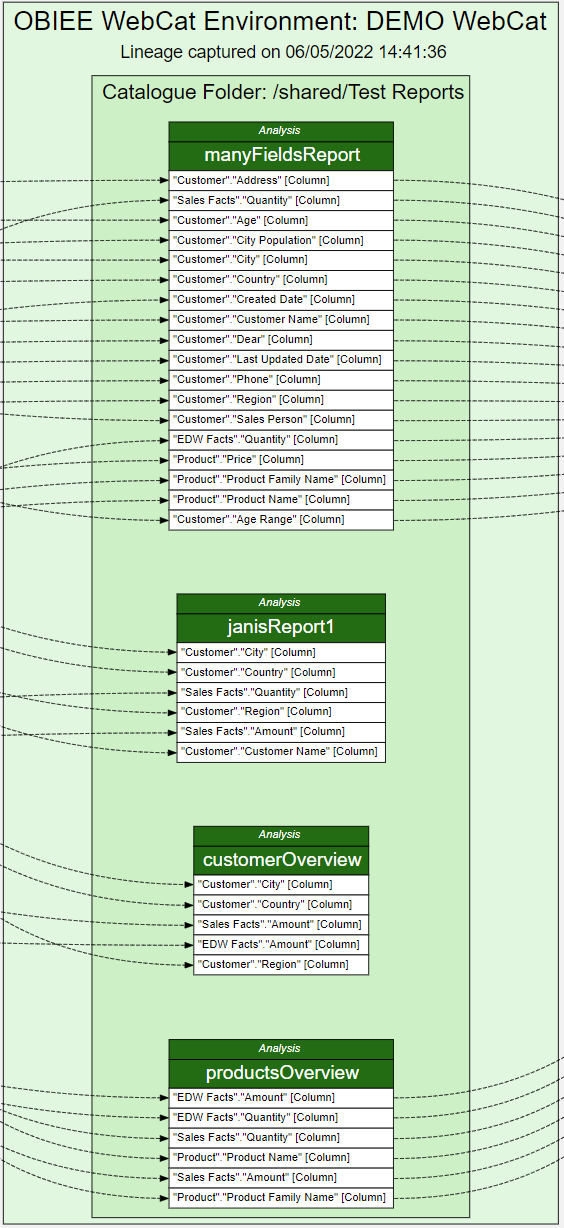
This time it seems we only really need 3 hierarchy levels: OBIEE Environment > Analysis (Report) > Report Column. However, we can introduce Catalog Folders to the hierarchy to stand at the Schema level.
As we can see, conforming to the 4-level hierarchy can be artificial in some cases, but overall the lineage makes sense and, importantly, we can easily switch between the 4 hierarchy levels to get summary or detailed views, drill down Schemas, Tables and Columns to get a filtered view of those entities.
But does the Lineage end at the BI Report? It depends on what we want to call Lineage. We can argue that the end point of our lineage is not the Report but the BI User. Getting Usage Adoption data from OBIEE is easy, assuming that Usage Adoption data gathering is enabled. But can we fit UA data into our lineage, and make it conform to the 4-level hierarchy?
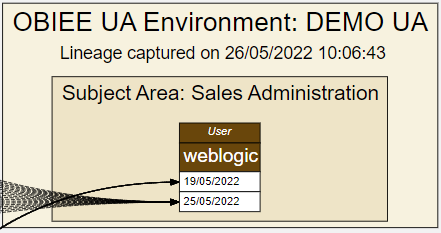
It is a stretch but yes, we can. Let us note that Usage Adoption is the first lineage source that does not have the concept of a Column and a collection of Columns (e.g. table or report). I chose to assign the user name to the table hierarchy level - because the table and the column hierarchy levels are probably going to be the two most frequently used and I do not want the user to be available at the finest level only. In the example above, the finest detail is Report Access Date. In a Production system that has been used for a few years, it would be substituted with Month or Quarter.
The end result is one large diagram that goes from the source table and column all the way to the BI User accessing that data in a report.
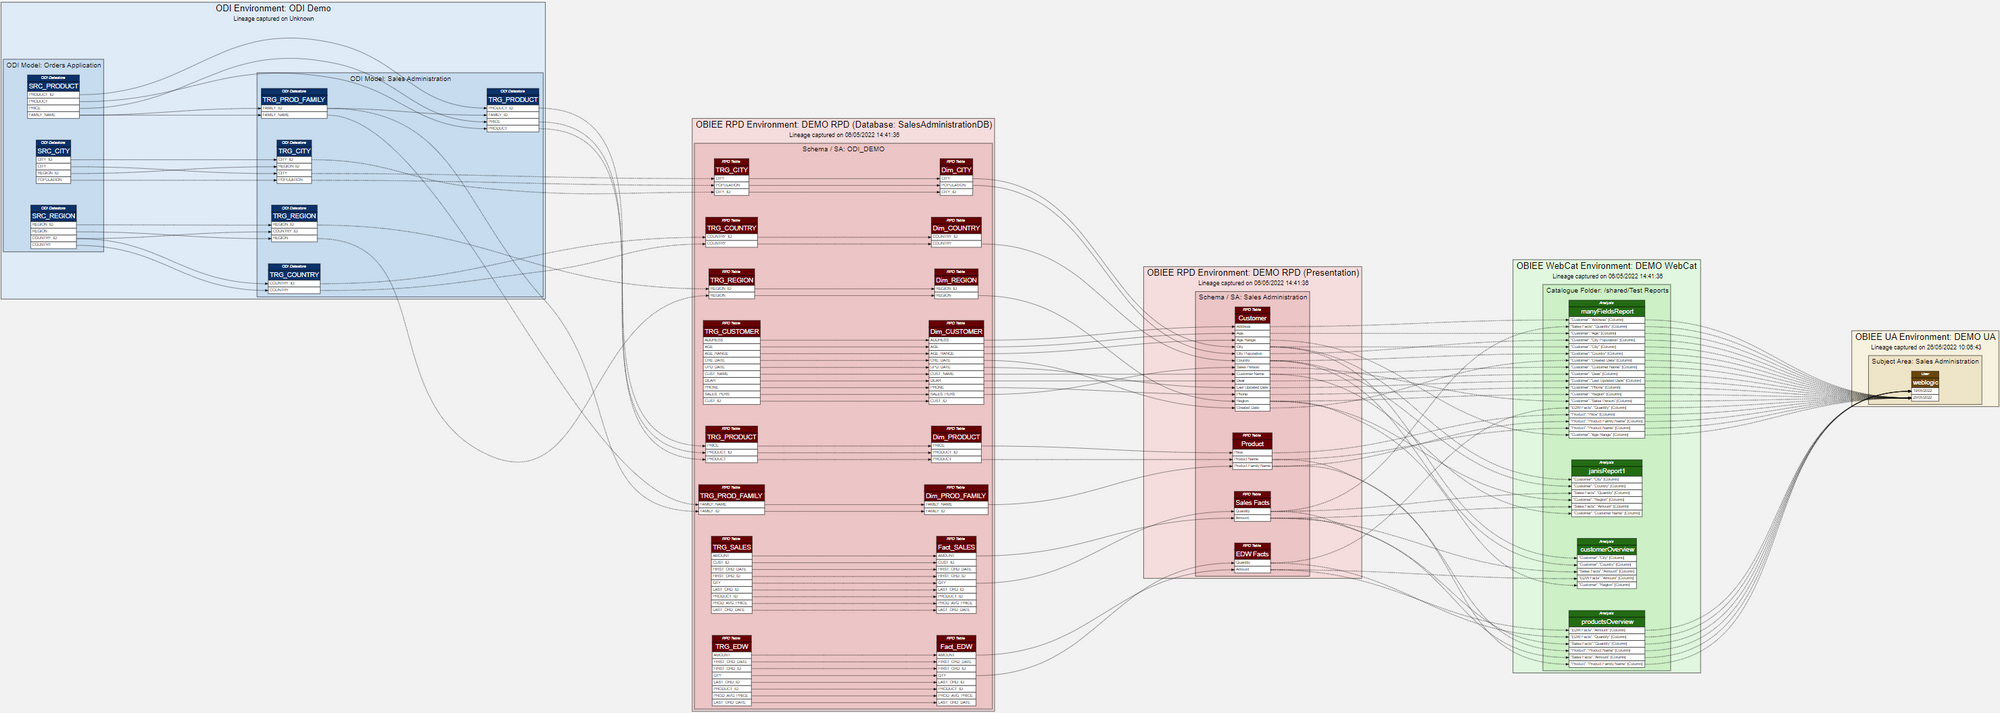
In the diagram, we can select a source column, say, SRC_PRODUCT.PRICE and see which users have accessed reports with Product Price in it. If the column data is deemed sensitive, we can do security audits by using this Lineage diagram. We can see if a certain source Table or Column is currently being used in BI reports and also if those reports are actually being used. We can start our analysis from the other end as well, by selecting a user and seeing what source table and column data that user is or is not accessing.
As of now, the Rittman Mead's Lineage Tool is capable of tracing and visualising data lineage starting with the ODI Mapping's Source Datastore Column and ending with the OBIEE User. The Lineage Tool is constantly evolving and there is still much we want to add to it. The journey so far has been interesting and I am sure we will revisit the compromises we have made to make the many lineage data sources fit together in a coherent hierarchy in a single end-to-end lineage.
Interested in finding out more about the Lineage Tool, contact us.