Performance and OBIEE - part V - Execute and Measure

Having designed and built our tests, we now move on to looking at the real nitty-gritty - how we run them and collect data. The data that we collect is absolutely crucial in getting comprehensible test results and as a consequence ensuring valid test conclusions.
There are several broad elements to the data collected for a test:
- Response times
- System behaviour
- Test details
- Ensure or challenge their validity
- Rerun the test myself
How about this enticing looking metric:
As Zed Shaw puts it:
It’s pretty simple: If you want to measure something, then don’t measure other shit.
Please consider the environment before running this test

- Work with a fixed code version. This can be difficult to do during a project particularly, but there is little point testing the performance of code release 1.00 if when you come to test your tuning changes 1.50 is in use. Who knows what the developers changed between 1.00 and 1.50? It whips the rug from out under your original test results. By fixed code, I mean:
- Database, including:
- DDL
- Object statistics
- BI Server Repository (RPD)
- Dashboard and report definitions (Webcat) If you can’t insist on this - and sometimes pragmatism dictates so - then at least have a very clear understanding of the OBIEE stack. This way you can understand the potential impact of an external code change and caveat your test results accordingly. For example, if a change was made to the RPD but in a different Business Model from the one you are testing then it may not matter. If, however, they have partitioned an underlying fact table, then this could drastically change your results to the extent you should be discarding your first results and retesting.
- Database, including:
- Make sure the data in the tables from which you are reporting is both unchanging and representative of Production. Unchanging is hopefully obvious, but representative may benefit from elaboration. If you are going live with 10M rows of data then you’d be pretty wise to do your utmost to run your performance test against 10M rows of data. Different types of reports might behave differently, and this is where judgement comes in. For example, a weekly report that is based on a fact table partitioned by week might perform roughly the same whether all or just one partition is loaded. However, the same fact table as the source for a historical query going back months, or a query cutting across partitions, is going need more data in to be representative. Finally, don’t neglect future growth in your testing. If it’s a brand new system with brand new data, you’ll be starting with zero rows on day one, but if there’ll be millions of rows within a month or so you need to be testing against a million rows or so in your performance tests.
- The configuration of the software should be constant. This means obvious configuration such as BI Server caching, but also things like version numbers and patch levels of the OBIEE stack. Consider taking a snapshot of all main configuration files (
NQSConfig.INIinstanceconfig.xml, etc) to store alongside your test data.- You should aim to turn off BI Server caching for your initial tests, and then re-enable it if required as a properly tested optimisation step. The appropriate use and implementation of BI Server caching is discussed in the optimisation article of this series.
Measure
Before you execute your performance test, work out what data you want to collect and how you will collect it. The reason that it is worth thinking about in advance is that once you’ve run your test you can’t usually retrospectively collect additional data.The data you should collect for your test itself includes:
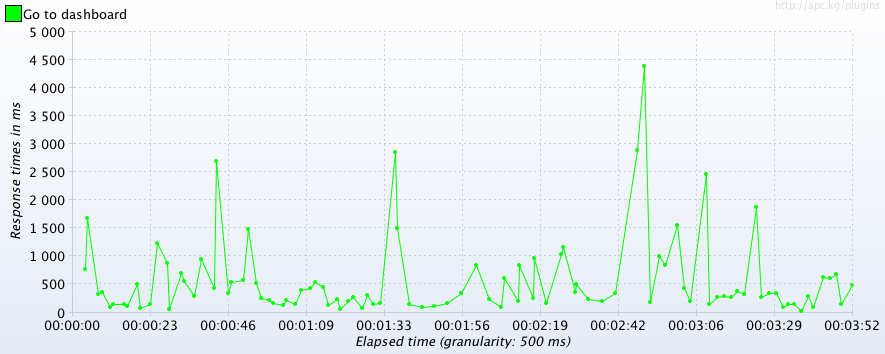
- Response times at the lowest grain possible/practical - see Dashboard example above. Response times should be 2-dimensional; transaction name, plus time offset from beginning of test.
- Number of test users running over time (i.e. offset from the start of your test)
- Environment details - a diagram of the top-to-bottom stack, software versions, code levels, and data volumes. Anything that is going to be relevant in assessing the validity of the test results, or rerunning the test in the future.
- System metrics - if response times and user numbers are the eye-catching numbers in a test, system metrics are the oft-missed but vital numbers that give real substance to a test and make it useful. If response times are bad, we need to know why. If they’re good, we need to know how good. Both these things come from the system metrics.
- Query Metrics - depending on the level at which the testing is being done, collecting metrics for individual query executions can also be vital for aiding performance analysis. Consider this more of a second round, drill down, layer of metrics rather than one to always collect in a large test since it can be a large volume of data.
Response times
Depending on your testing method, how you capture response time will be different. Always capture the raw response time and test duration offset - don’t just record one aggregate figure for the whole test. Working in BI you hopefully are clear on the fact that you can always aggregate data up, but can’t break a figure down if you don’t have the base data.JMeter has “Sample time” or “Response Time”. Use the setSampleLabel trick to make sure you get a response time per specific dashboard, not just per dashboard refresh call. Some useful listeners to try out include:
jp@gc - Response Times Over Timejp@gc - Response Times vs Threads(although be aware that this shows an average response time, which is not the best summary of the metric to use)View Results in Table
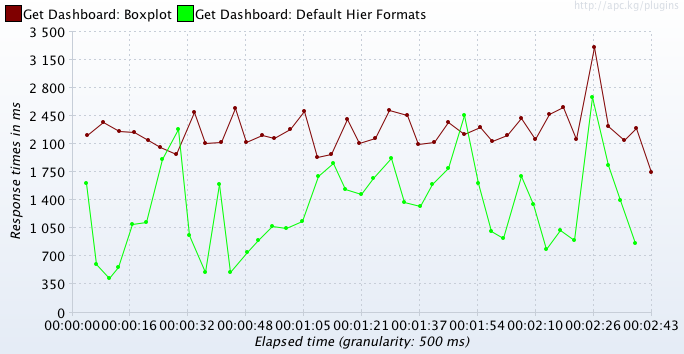
If you are doing a test for specific tuning, you might well want to capture response times at other points in the stack too; for example from the database, BI Server, and Presentation Server.
Whichever time you capture, make sure you record what that time represents - is it response time of the query at the BI Server, response time back to the HTTP client, is it response time including rendering - and so on. Don’t forget, standard load test tools such as JMeter don’t include page render time.
System metrics

- Environment metrics - everything outside OBI - the host OS, the database, the database OS.
- OBI metrics - internal metrics that let us understand how OBI is ticking along and where any problems may lie
Some of the tools described below for capturing system metrics could be considered for putting in place as standard monitoring for OBIEE, whilst others are a bit more detailed than you’d want to be collecting all the time.
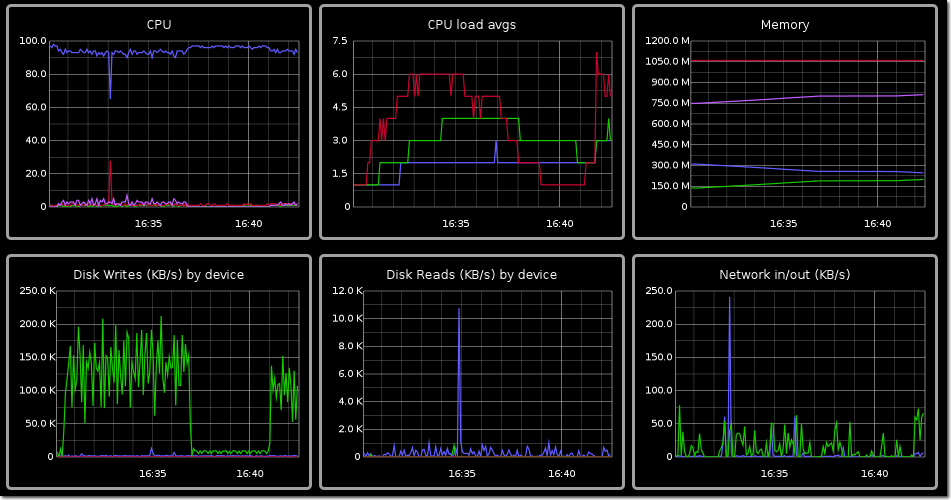
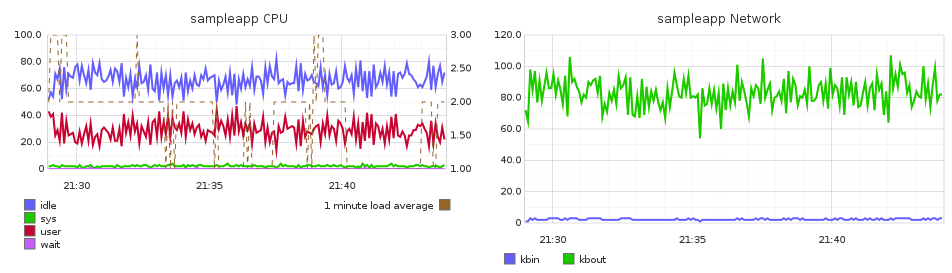
OS metrics
OS stats should be collected on every server involved in the end-to-end serving of OBIEE dashboards. If you have a separate web tier, a 2-node OBIEE cluster and a database, monitor them all. The workload can manifest itself in multiple places and the more “eyes-on” you have the easier it is to spot the anomalies in behaviour and not just be stuck with a “it was slow” response time summary.As well as the whole stack, you should also be monitoring the server(s) generating your load test. If you’re testing large numbers of concurrent users the overhead on the generator can be very high, so you need to be monitoring to ensure you’re not hitting a ceiling there, rather than in what is being monitored.
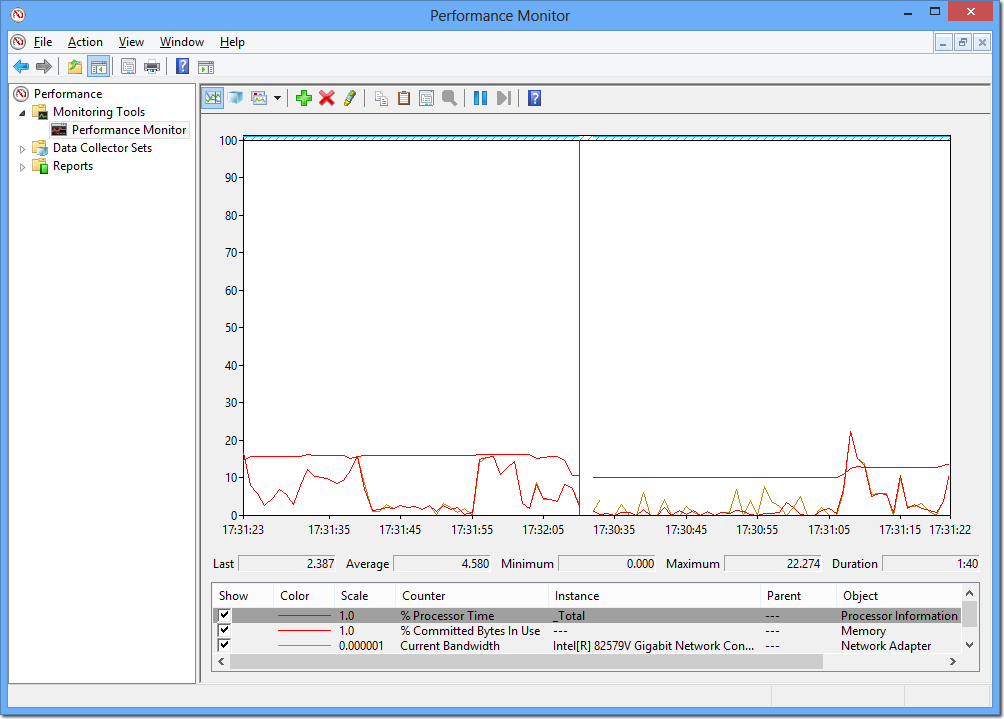
On Windows, I would use the built-in Performance Monitor (perfmon) tool to collect and analyse data. You can capture CPU, IO, Memory, Network and process-specific data to file, and analyse it to your heart’s content afterwards within the tool or exported to CSV.
Finally, it’s worth noting that JMeter also offers collection of OS stats through the JMeter plugins project.
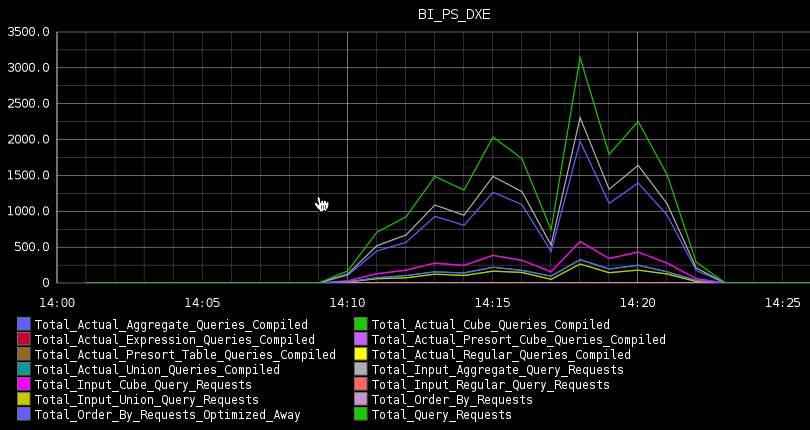
OBI metrics
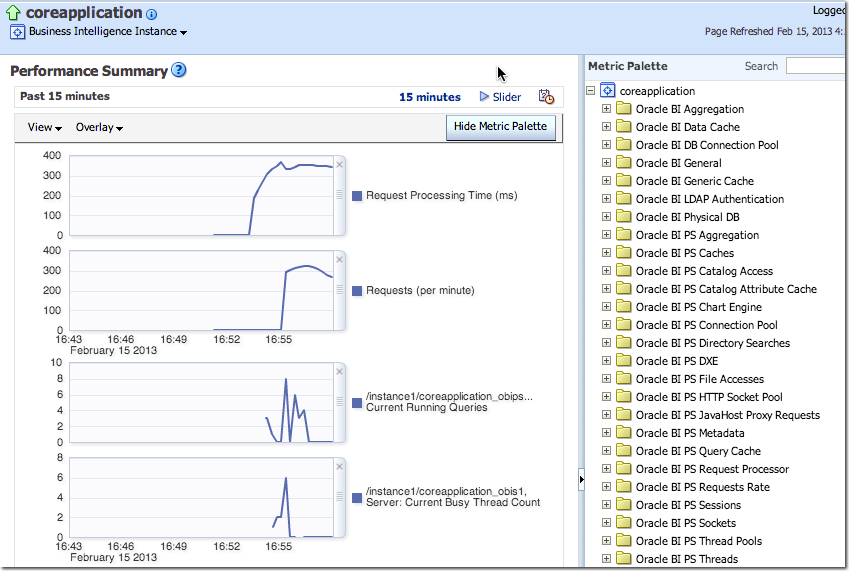
The OBIEE performance counters are a goldmine of valuable information, and one it’s well worth the time mining for nuggets. The counters give you both a better picture of how different workloads are executed within OBIEE but also where any bottlenecks may arise.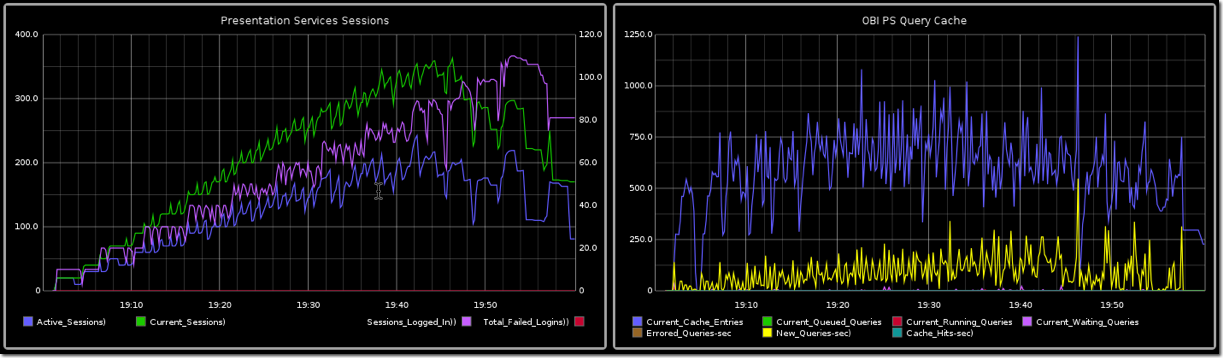
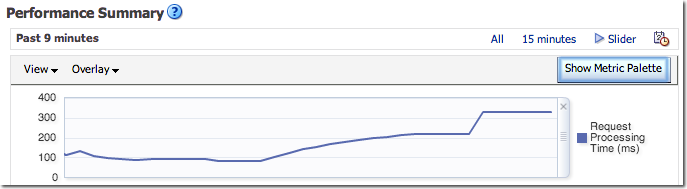
- Through Fusion Middleware Control, under Capacity Management -> Metrics -> View the full set of system metrics. This gives a point-in-time view of the data for the last 15 minutes, and does not store history.
- Presentation Services includes its own Performance Monitor which can be accessed at
http://<yourserver>:<analytics port>/saw.dll?perfmon. In OBIEE 10g it showed BI Server metrics too, but in 11g seems to only show Presentation Services (Oracle BI PS) metrics. It is point in time with no history.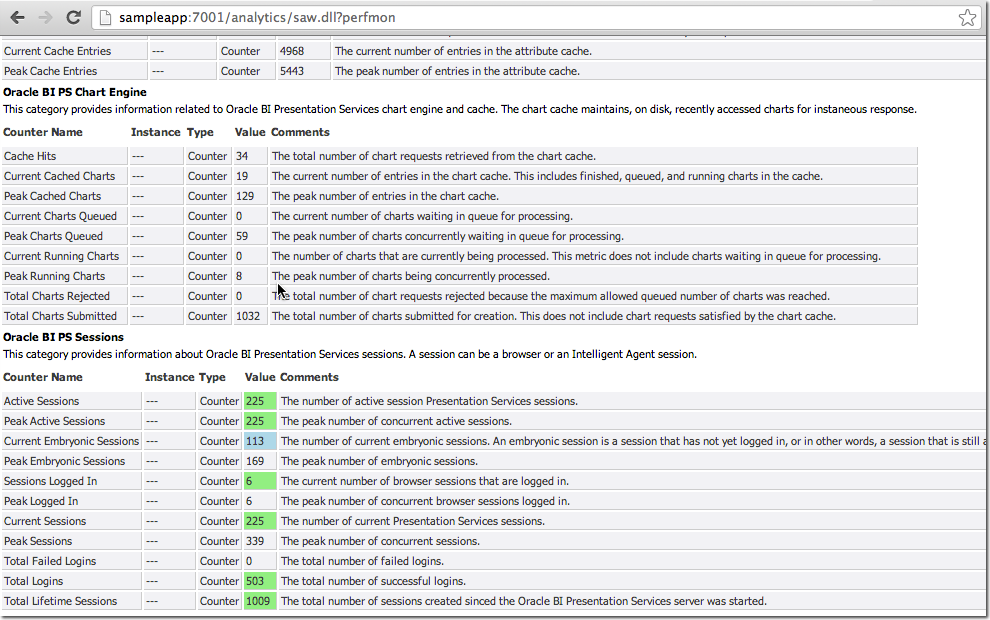
- Similar to Performance Monitor but with a lot more metrics available, DMS Spy is a java deployment hosted on the Admin Server by default, available at
http://<yourserver>:<adminserver port>/dms/Spy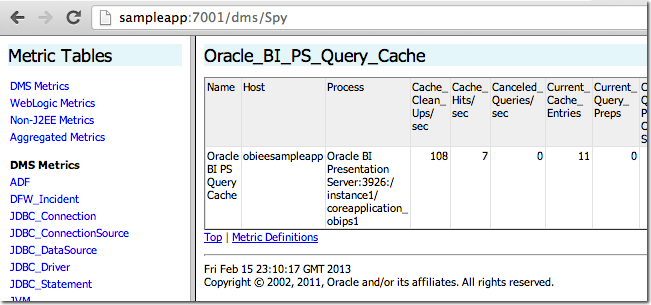
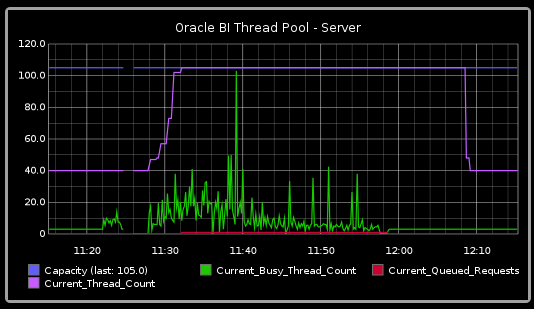
- Through a manual call to
opmnon the commandline. For example:[oracle@obieesampleapp bin]$ ./opmnctl metric op=query COMPONENT_TYPE=OracleBIServerComponent HTTP/1.1 200 OK Connection: close Content-Type: text/html<?xml version='1.0'?> <!DOCTYPE pdml> <pdml version='11.0' name='Oracle BI Server' host='obieesampleapp' id='4399' timestamp='1359703796346'> <statistics> <noun name="Oracle BI Server" type="Oracle_BI_Applications"> <noun name="Usage_Tracking" type="Oracle_BI_Thread_Pool"> <metric name="Peak_Thread_Count.value"> <value type="integer"><![CDATA[5]]></value> </metric> <metric name="Current_Thread_Count.value"> <value type="integer"><![CDATA[2]]></value> </metric> <metric name="Lowest_Queued_Time_(milliseconds).value"> <value type="integer"><![CDATA[0]]></value> </metric> […]
See the documentation for details - DMS through WLST
- BI Server diagnostics through ODBC/JDBC
- It is worth noting that one place you cannot get the OBI metrics from any more is through JMX. In 10g this was an option and interfaced very well with industry-standard monitoring tools. In 11g, JMX is available for metrics outside core OBI, but not the core metrics themselves.
Query Metrics
If you are running a test for a specific performance issue then capturing query metrics is important as these will feed into the diagnosis that you do including building a time profile.A Logical SQL query has two elements to it for which we capture information:
- BI Server (Logical SQL)
- Query runtime
- Total Rows returned from the database
- Total Bytes returned from the database
- Number of database queries
- Database (x n Physical SQL queries)
- Response time
- Rows returned
- Bytes returned
All of the above information can be obtained from the BI Server’s nqquery.log, or most of it from Usage Tracking tables S_NQ_ACCT and S_NQ_DB_ACCT.
For really detailed analysis you may want to capture additional information from the database about how a query ran such as its execution plan. On Oracle, Real Time SQL Monitoring is a very useful tool, along with several others. For further details, speak to a DBA … this is an OBIEE blog ;-)
Execute
And now the moment you’ve all been waiting for … it’s party time!Here is a checklist to work through for executing your test:
- Clear down the logs of any component you’re going to be analysing (eg
nqquery.log,sawlog.log) - Record any configuration/environment changes from the original baseline
- Record test start time
- Restart the OBIEE stack (i.e. WLS, OPMN)
- Start OS metric collection
- Start OBIEE metric collection (if used)
- Run the test!
- Monitor for errors and excessively bad response times
- Record test end time
- Record any errors observed during test
- Copy all logs, metric outputs, etc to a named/timestamped folder
- Your test script is duff. For example, there’s a typo in the login script and no users are logging in let alone executing dashboards. All your test will tell you is how fast OBIEE can reject user logins.
- Your test has hit a performance bottleneck in the stack. If you leave your test running beyond a certain point, all you’re doing is collecting data to show how bad things still are. If response times are flat on their back at 50 concurrent users, what’s the point leaving a test to run all the way up to 200? It’s best to curtail it and move swiftly on with the analysis and tuning stage
- Your test framework has hit a bottleneck in itself. For example, the host machine cannot sustain the CPU or network traffic required. If this happens then your test data is worthless because all you’re now measuring is the capacity of the host machine, not the OBIEE stack.
Don’t fiddle the books!
If your test execution doesn’t work, or you spot an improvement or fix – resist the biggest temptation which is to ‘just fix it’. Hours become days with this approach and you lose complete track of what you changed.Take a step back, make a note of what needs fixing or changing, and document it as part of the full cycle.
There is nothing wrong whatsoever with aborting a test for the reason that “I defined it incorrectly” or “I forgot to change a config setting”. Better to have a half dozen aborted tests lying around showing that you got your hands dirty than a suspiciously pristine set of perfectly executed tests.
Don’t forget that pesky documentation
Always document your testing, including method, definition, and results.- You will not remember precisely how you ran the test, even a few days later
- How can you identify possible confounding of results, without recording a clear picture of the environment?
- If you find something unexpected, you can quickly seek a second opinion
- Without things written down, people will not be able to reproduce your testing
- Test results on their own are worthless; they are just a set of numbers.
- If it’s not written down, it didn’t happen
What next?
With a test run completed and a set of data collected, it's time to make sense of the numbers and understand what they can tell us by analysing the resultsOther articles in this series
This article is part of a series on the subject of Performance and OBIEE:Comments?
I’d love your feedback. Do you agree with this method, or is it a waste of time? What have I overlooked or overemphasised? Am I flogging a dead horse?Because there are several articles in this series, and I’d like to keep comments in one place, I’ve enabled comments on the summary and FAQ post here, and disabled comments on the others.