Performance and OBIEE - part III - Test - Design

Having defined our test, we can now design it. Wordplay? Not really. Regardless of how we run our tests, we’ve got to define up front what it is we are testing. Once we’ve got that, we can then work out how to actually create a test that simulates what we’ve defined.
Pretty boring huh? Can’t we just, y’know, like, run LoadRunner a bunch of times?
Sure, go ahead. But unless everything is hunky-dory and passes with flying colours, you’ll only end up retrofitting the definition to your test in order to properly analyse the problem and create further tests to get to root-cause. Therein lies the path to madness, and more importantly, wasted time and poor quality tests.
Don’t jump the gun and wade into the 'fun' part, otherwise you’ll spend too much time trying to figure out what to build into your test on the hoof instead of carefully working it out up front.
The OBI stack
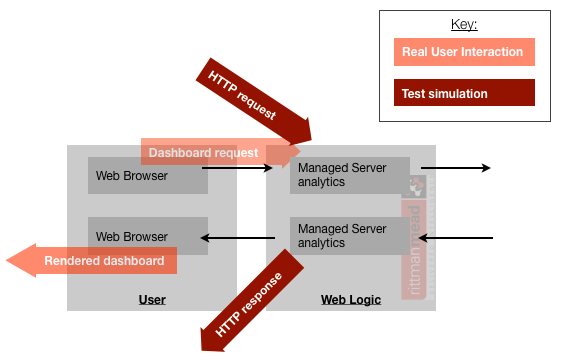
The key to designing a good performance test, and comprehending the results from it, is understanding the OBI stack. Doing so enables us to inject tests into the OBI stack at various points to focus our testing and reduce the time it takes to build a test. Being able to pinpoint where the work happens is also essential to focussing troubleshooting.At a very high level, the stack looks like this:

(NB this is not an exhaustive diagram, for example, it doesn’t include any alternative security providers)
The user accesses OBI through their web browser, which connects to WebLogic. Weblogic is a web and application server. It connects to OBI which in turn generates queries to run on the database
Examining the stack in a bit more detail, it looks like this:

When the user interacts with OBI all the web browser calls are done through WebLogic. WebLogic runs Java deployments including one called analytics which communicates with the Presentation Services OBI component. When the user requests a dashboard, the following happens:
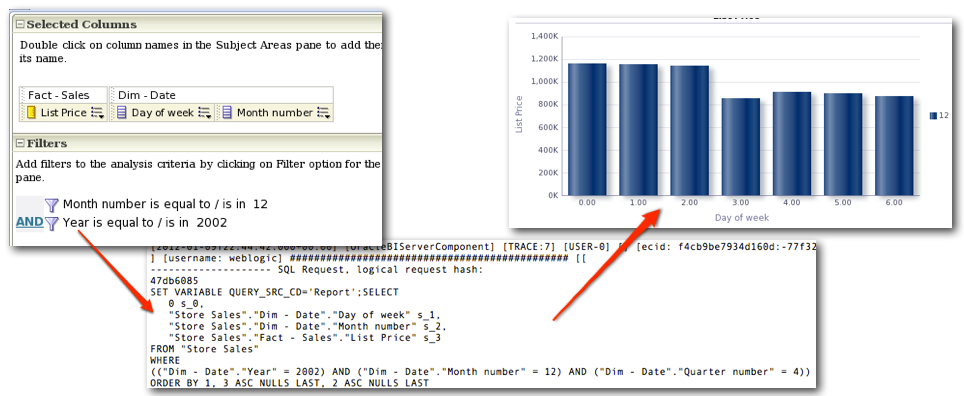
- Presentation Services takes all of the constituent analyses in the dashboard and sends the Logical SQL for each one to BI Server
- BI Server runs each Logical SQL through the RPD and generates one or more Physical SQL queries to run on the Database
- Once the Database has executed all of the queries required for one of the Logical SQL statements, BI Server processes the results and does any further calculations, federation, and so on. A single resultset per Logical SQL request is passed back to Presentation Services.
- Presentation Services receives the data from BI Server, sends any chart requests to Javahost, and does additional processing on the data for things like pivot tables. It then sends the rendered data for each analysis back to the web browser.
- In the web browser each analysis in the dashboard can receive its data independently. As the data is received, the browser will render it.
For each Logical SQL request from Presentation Services, there will be one or more Physical SQL queries, but just one resultset passed back to Presentation Services. For each Dashboard there may be many Logical SQL queries run.

£5 for the hammer, £95 for knowing where to hit it
Building an accurate, flexible performance test rig takes time and therefore it is wise to test only what needs testing. For example:- If our performance test is for a greenfield OBI deployment then we’d be pretty foolish not to conduct an end-to-end test. We need to make sure that all the components are performing together at the required workload.
- However, what about if we’re testing a existing mature deployment where there’s a specific problem in the database? We could do an end to end test, but if all that’s changing is the database (for example, new indexes) then we should probably just focus our test on the database.
- What about if the RPD is changing in an existing deployment and nothing else? Is there really any point performance testing the response time all the way to the user? If the data returned is the same then we can presume that the performance in Presentation Services and back to the user is going to be the same. Therefore we can build a more streamlined (and thus efficient) test against just the BI Server (because the RPD has changed) and the database (because a changed RPD could generate different Physical SQL).
Tools & Designs for OBI performance testing

There are several different ways to build a performance test for OBIEE. I have described them here as well as suggested where each one is most appropriate to use.
End-to-end (almost)
Traditional load testing tools such as JMeter, Oracle Application Testing Suite (OATS), and HP LoadRunner can be used to simulate a user clicking on a report in a web browser and recording how long it takes for the report to run. They can have multiple report definitions, and run many concurrently. This is usually sufficient for a comprehensive performance test. One should be aware when using these that there is still an element that has not been tested:- Outbound. A user interacting with OBI uses a modern web browser with lots of asynchronous traffic (AJAX). For example, clicking on a prompt to get a list of values, clicking on the dashboard menu to see a list of available dashboards. A standard load test will typically only send the HTTP request necessary to trigger the dashboard refresh itself.
- Inbound. A real user’s web browser will receive the data from a dashboard as it is returned from the OBI server and render it. Once it’s finished rendering, it is viewable to the user. If it is a large pivot table with hundreds of thousands of cells (“because that’s how the Excel report we’re duplicating does it”) then this might take many seconds or even minutes - or even not work at all. But a load test tool will parse the data that comes back from the server, and once all the data’s received, it will mark that as the completed response time - the time to render is not included.
This is not to dismiss this approach of test design – generally it is a very good one. These are the subtleties that a standard load test can overlook. The AJAX dashboard menu call might not take long, but the list of values might be a hidden bottleneck if it hits an unoptimised data source (for example, SELECT DISTINCT DIM_VALUE FROM 60M_ROW_UNAGGREGATED_DIM_TABLE).
It is important that the above limitations are noted, and the test design adjusted to compensate where these weaknesses are observed (for example, large pivot tables, list of values, etc).
Presentation Services via Web Services
Snuck in with the other goodies of SampleApp v207 is LoadTest.jar. You’ll find it in/home/oracle/scripts/loadtest, along with a readme file detailing how to use it. It takes as input a single Dashboard path, and runs concurrent user requests against it. Since it is using a dashboard path we can presume it is interfacing with Presentation Services, and my guess is that it utilises the OBIEE web services to generate the load.
This utility will presumably have the same limitation as JMeter, LoadRunner et al in that page render times are not included in the response time. LoadTest.jar also only returns timings at a total level for a batch of concurrent users - how long does it take, in total, for x users to run a given dashboard. Individual response times from the BI Server for the constituent queries can be seen in Usage Tracking. LoadTest.jar could also be invoked multiple times to simulate multiple users/dashboards and the timing for each invocation be recorded to get a more granular set of response times. Finally, LoadTest.jar can only fetch a dashboard in its default state - there is no apparent way to change prompt values or interact with hierarchical columns, drill paths, etc.
An alternative to LoadTest.jar for this type of testing could be using JMeter to invoke the web services, which could give more flexibility (at the expense of time to set it up and complexity to maintain).
BI Server + Database
The BI Server supports ODBC or JDBC for communication with clients (such as Presentation Services). We can use a client to send Logical SQL requests to it and record the response time. Because Presentation Services also sends Logical SQL to BI Server this test approach is a good one because from the BI Server + Database point of view, the behaviour is exactly the same whether the Logical SQL comes from Presentation Services or another client (eg injected by us for performance testing).
Database
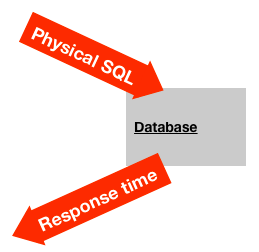
If nothing in your OBI configuration has changed and you just want to test the performance of the database, then you can just use standard database performance test tools. Take the Physical SQL from the report being tested and run it against the database using your database’s standard tools.
This is useful if you are doing tuning work at the database level (partitioning, indexing, etc), but only use this approach if nothing is changing in your RPD. As soon as the RPD changes, different physical SQL could potentially result.
Remember also that the response time from a physical SQL executed on the database is not the same as the response time of a report - it still has to go back up through the stack back to the user’s web browser. For a complex report or a large number of rows this can add significant time.
The only genuine end-to-end test - a stopwatch!

This is also a very easy way to determine page render times. As I discussed in the paragraph above, traditional load test tools such as LoadRunner and JMeter only measure the time taken for an OBI dashboard to return data and not how long it takes to render it. For the user obviously the only time they are going to be interested in is the complete time including rendering. So using a stopwatch (or more scientifically, inbuilt browser tools such as Chrome’s Developer Tools) you can measure the complete time as the user will experience it.
Which tool?
In an OBI performance test lifecycle I would expect to use several of the different tools described above. Typically a greenfield test will look at the performance of the stack end-to-end. If there are problems with the end-to-end, or if the testing is in response to a problem in an existing system, I would use a response time profile (of which more later) to understand where the bottleneck lay and focus the testing (and tuning) there. For example, if the bottleneck appeared to be the SQL that the RPD was generating I might use nqcmd to validate changes I made to the RPD and/or the database modelTest Design tips
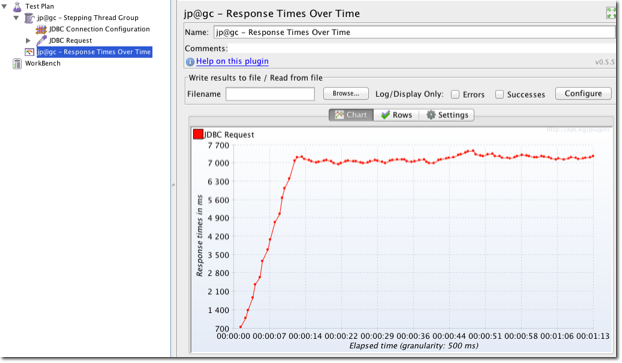
Whichever method you use, bear the following in mind:- Generating a big load is easy; generating a big load that provides useful data is more difficult. For example, when a test shows 100 concurrent users running 10 different dashboards doesn’t work, how do you break it down into components to see where the bottleneck is? A good test design will take this into account up front and include granular response times and instrumentation.
- K.I.S.S. : Sometimes a set of shell scripts run concurrently will do just as good a job of applying a high load to OBI as a “proper” load testing tool can. The
timecommand will always give you the duration of an execution, and you can modularise sets of shell scripts to your heart’s content.- If you use shell scripting, don’t forget to KISS - a complex mess of shell scripts isn’t Simple either.
- You may see a conflict between the above points. How do you build a test that is granular and well instrumented, yet isn’t overly complex? Well, therein lies the gold ;-) Because all performance tests are different, I can only outline here good approaches to take, but you have to walk that line between complexity and flexibility in your design.
Heuristic and Holistic performance testing
There is more than one way to evaluate the performance of OBIEE. Tools like those I have described above are great for simulating known workloads with a fixed definition. Unfortunately, all of these assume a known set of reports and predicates, and user behaviour. What about testing a system where there is ad hoc capability and/or a great number of possible predicate values and thus execution plans?Here I would recommend a thorough review of the system’s implementation, with the view to determining possible bottlenecks before they occur. It is more difficult to prescribe this area as it comes down to a combination of personal experience of good design, careful evaluation of right practices, and the ability to isolate and test particular configurations.
The difficulty with this type of testing is that is produces less tangible data with which to say yea or nay on a system’s ability to perform. It means that the audience for the performance test report must be receptive to “It Depends”. Just because a table doesn’t have a particular index doesn’t mean in itself that the performance test is a failure and the index must be defined before go live. What it does mean is that the missing index may cause a worse execution plan which may require additional database resources which may limit how many queries can run concurrently before a bottleneck is reached.
For specific suggestions of what to examine in this type of evaluation, see here. I am well aware of the apparent contradiction in advocating a heuristic approach here yet criticising "best practices". My problem with best practices is when they are treated as absolutes and without context; they normally originate from good intentions and are subsequently abused. In the context of evaluating a system's performance that is impossible to comprehensively test (eg ad hoc report workload) then looking at how past implementations of the technology is the only sensible option. The success of these past implementations may or may not be encoded as 'best practices'; the point is that they are evaluated in a conscious manner and not followed blindly.
Resource management
To reduce the risk to a Production system of running ad hoc or untested reports, resource management at the database level could be used. On Oracle, Database Resource Manager (DBRM) enables queries to be allocated a greater or lower priority for CPU on the database, or limit the execution time. Fixed reports which have been through a strict performance QA process could be given greater resource since the effect has been quantified and analysed in advance, whilst ad hoc or unproven reports could be more restricted.To implement this, pass through the report or user name through in the connection pool, and then define a Resource Manager rule to assign the resource management policy accordingly.
Resources can also be controlled at the BI Server level by setting restrictions on query runtimes and rows returned on a per-application role basis.
What next?
Now that we've defined the test we want to perform, and have designed how it will be implemented, we move onto actually building it, hereOther articles in this series
This article is part of a series on the subject of Performance and OBIEE:Comments?
I’d love your feedback. Do you agree with this method, or is it a waste of time? What have I overlooked or overemphasised? Am I flogging a dead horse?Because there are several articles in this series, and I’d like to retain the discussion in one place, I’ve enabled comments on the summary and FAQ post here, and disabled comments on the others.