This article is the fourth in a series about performance and OBIEE. In previously articles I described how test design should be approached, and in this article I explain in detail how to use some of the tools available to build the tests.
JMeter
JMeter is open-source software maintained by the Apache Software Foundation. It is a flexible and powerful tool that has a GUI design interface that can run on any java-supporting desktop (e.g. Windows/Linux/Mac). The test execution can be run from the GUI, or “headless” from the commandline.
To get started with JMeter, simply download it, and uncompress the archive (tgz / zip). Go to the bin folder and doubleclick on jmeter.sh or jmeter.bat. This will launch JMeter.
There are plenty of JMeter tutorials on the web and I am not going to replicate them here. Any tutorial that demonstrates how to record a web browsing session into a JMeter script should suffice for creating an initial OBIEE load test. Below I will detail some specifics that it is useful to be aware of.
When a user clicks on a dashboard in OBIEE, the server returns shortly after the text “Loading…”. You need to make sure that your test doesn’t incorrectly accept this as the completed report. There are a couple of ways to do this:
Design your test so that it waits until the text isn’t “Loading…”
Set NewCursorWaitSeconds in instanceconfig.xml so that the “Loading…” text isn’t displayed before the query results are returned. See this blog post for more details
The JMeter Plugins are very useful for additional graphing options and better user control (eg jp@gc - Stepping Thread Group)
Try to use variables throughput to increase code reusability and reduce maintenance. It’s worth taking time to refactor a test that has evolved into something complex.
Use the Constant Timer object to add think time
Response Assertion steps are a very good way of ensuring that your test is getting the result it should at each stage. For example, to check the OBIEE login page is loading, check for Enter your user id and password..
Use the Not option in a Response Assertion to check for things that definitely shouldn’t be there, such as Odbc driver returned an error or Loading…
For a flexible test, parameterise the dashboard pages fetched. This is done in several stages:
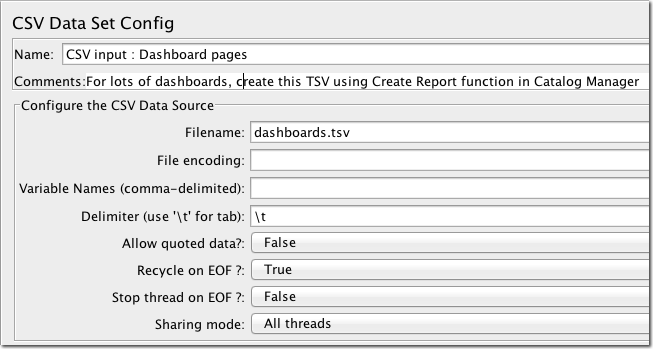
Add a CSV Data Set Config step, configured to read a TSV (Tab-Separated) file from a path you specify. NB relative paths in JMeter are relative to the folder that the JMeter script (JMX) resides
If you want to end the test once each dashboard page has been run once, set Stop thread on EOF to False. To control the longevity of the test elsewhere, set Recycle on EOF to True
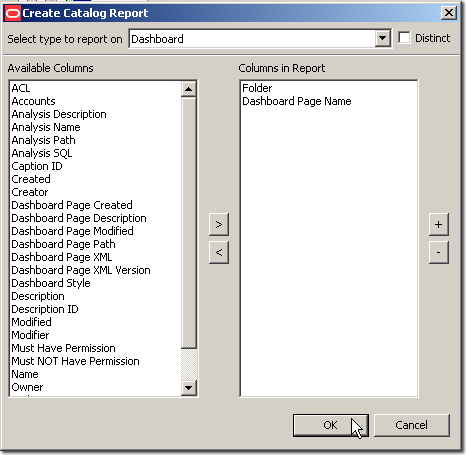
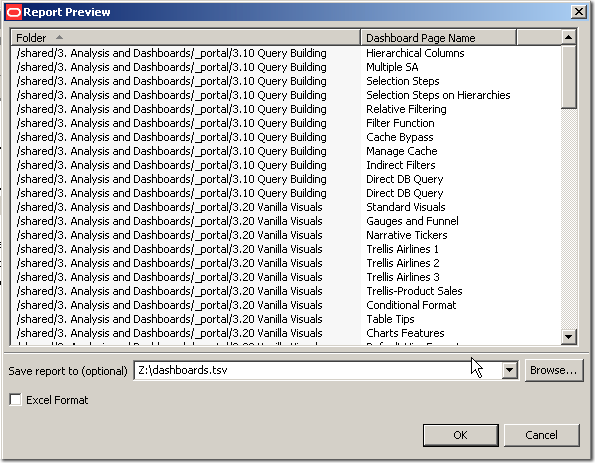
Load OBI’s Catalog Manager and navigate to the part of the catalog for which you want to generate a list of dashboards. Go to Tools -> Create Report. Set the Type to Dashboard and columns: Folder and Dashboard Page Name.
Save the resulting TSV file local to the JMeter script you have built.
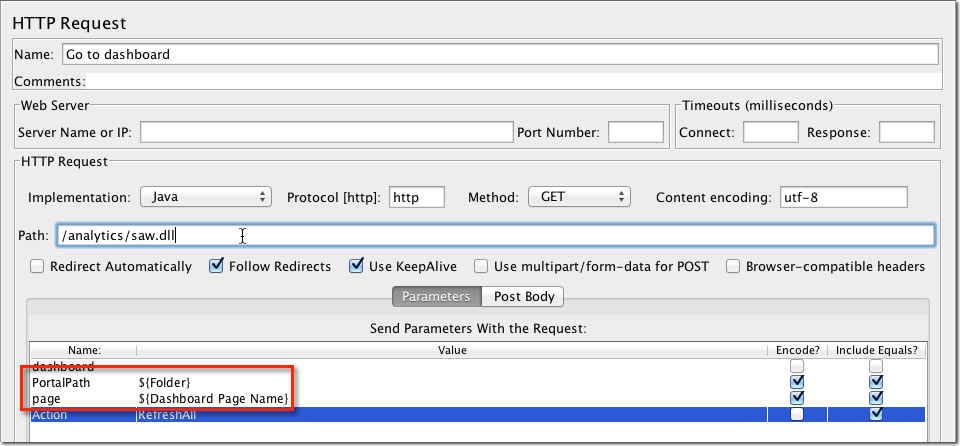
The TSV file is written with a header, and this acts as a source for the variable names, so in this case Folder and Dashboard Page Name. Use these in the Dashboard HTTP request
Finally, use the following trick to ensure that each dashboard is recorded as a separately labelled transaction. Insert a BeanShell PostProcessor as a child of the HTTP Request with the following code:
Validate your JMeter test response times by actually using the system yourself, both at single user and when the test is ramped up. If JMeter says response times are subsecond but you’re waiting 30 seconds to run a report, it’s possible that your JMeter test is not measuring the correct timings.
If a system under test is failing to cope, an increased response time and/or increase error rate is usually seen. To avoid unnecessarily excessive test durations, a test can be set to abort at a certain threshold, using the jp@gc - AutoStop Listener step.
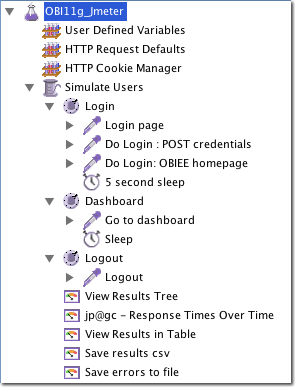
A simple OBIEE JMeter script may have the following steps:
The other thing to remember when you are building your JMeter tests is where and how you will run them:
Be very concious of where you run your JMeter script from. If you run it over a poor wifi connection from a 3 year old laptop, don’t be surprised if your test apparently tells you that your 40-core OBIEE server only supports a handful of users. Rather than observing bottlenecks on OBIEE, you’ll actually just be measuring how easy it is to saturate your local machine’s CPU and/or network connection. Particularly around network, be aware that each dashboard request will pull back the complete dashboard content, which can be 100s of KB. Multiply that by the number of simultaneous users you plan to simulate, and you’ll quickly see that your JMeter script needs to run from a machine with a nice fat network pipe
JMeter can be run distributed across servers, controlled from a central one. This is a good way to simulate many users if you find a single machine cannot keep up with the load.
JMeter can be run from the command line if you are not able (or don’t want) to use a GUI.
BI Server + Database
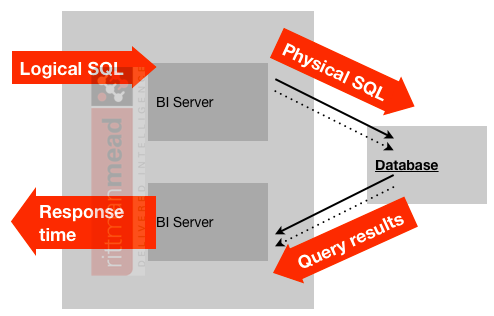
The BI Server uses ODBC or JDBC for communication with clients (such as Presentation Services). We can use a client to send Logical SQL requests to it and record the response time :
nqcmd
nqcmd is the ODBC client that is provided with OBIEE. You can wrap it in a series of shell scripts to create a complete test
This method is as simple as extracting the Logical SQL for a report, putting it in a file, and referencing this file in invoking nqcmd.
Extracting the Logical SQL can be done from several places including:
Usage Tracking
select query_blob from s_nq_acct;
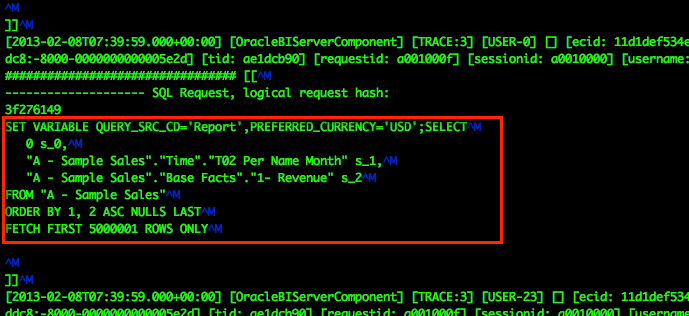
nqquery.log
You’ll find this file in the path $FMW_HOME/instances/instance1/diagnostics/logs/OracleBIServer/coreapplication_obis1/ (it will be different for deployments using scaleout).You can also view and download nqquery.log through Enterprise Manager
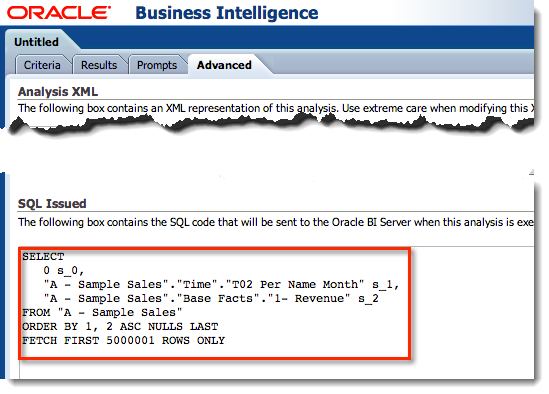
Answers editor
This is particularly useful for extracting Logical SQL in a report you’re working on or investigating.
Go to Edit Report and then the Advanced tab:
Having extracted the Logical SQL, write it to a file, for example test_report.lsql. I use the suffix lsql (Logical SQL) to differentiate it from normal SQL (‘Physical’ SQL).
Now you can send the Logical SQL to the BI Server from an ODBC/JDBC client, of which the most commonly used with OBIEE is nqcmd.
To use nqcmd, you first need to set up the OBI environment variables. On Linux/Unix this is done by “dot-sourcing” a file which sets the environment for the current shell. The first character to type is dot, then space, then the path to the bi-init.sh script:
 cd $FMW_HOME
 . instances/instance1/bifoundation/OracleBIApplication/coreapplication/setup/bi-init.sh
On Windows, you can just run bi-init.cmd and it will open a new command window for you to use, with the environment correctly set.
Once the environment is set correctly, call nqcmd, supplying:
The DSN of the BI Server
on Linux/Unix as defined in $FMW_HOME/instances/instance1/bifoundation/OracleBIApplication/coreapplication/setup/odbc.ini
In Windows, it's defined in Administrative Tools -> Data Sources
This will execute the Logical SQL and return the results to your screen. With a few more tweaks we can easily get some performance data:
Unless you want to see the data, use the -o flag to route it to a file, or -q for no output. Remember if there is lots of data from the query there will be a time overhead in sending it all to your console (or to file with -o)
Use the undocumented but very useful -T flag to return a detailed timings breakdown.
On Linux/unix prefix the nqcmd call with time to give a report of the time taken by the whole command:
Oracle BI ODBC Client
Copyright (c) 1997-2011 Oracle Corporation, All rights reserved
Connection open with info:
[0][State: 01000] [DataDirect][ODBC lib] Application's WCHAR type must be UTF16, because odbc driver's unicode type is UTF16
You can build a more flexible and scalable test rig based on the same design as above using JMeter with the OBIEE JDBC driver.
Take the OBI JDBC driver file bijdbc.jar from $FMW_HOME/Oracle_BI1/bifoundation/jdbc/ and put it in the JMeter /lib folder, or specify it in JMeter's root test step under Add directory or jar to classpath.
In JMeter add a User Group and within it:
JDBC Connection Configuration
Variable Name : eg, OBI
Validation Query : blank
Database URL: jdbc:oraclebi://<host>:9703/ (see the jdbc README.txt for full syntax of the URL including clustering)
JDBC Driver class: oracle.bi.jdbc.AnaJdbcDriver
Username + Password : Valid OBIEE logins
JDBC Request
Variable Name : OBI (or whatever you specified in the config above)
Query Type : Select Statement
SQL Query: <Your Logical SQL>
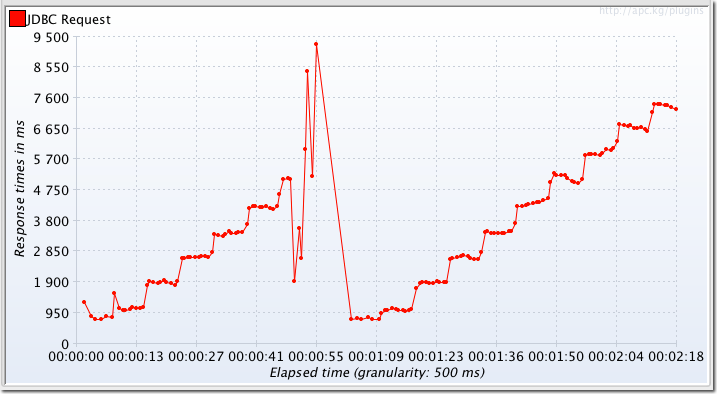
Add a listener to visualise the results, such as jp@gc - Response Times Over Time (part of JMeter Plugins)
Since this is JMeter, you can easily parameterise this test, running a predefined set of Logical SQL extracted from Usage Tracking or nqquery.log.
If nothing in your OBI configuration has changed and you just want to test the performance of the database, then you can just use standard database performance test tools. Take the Physical SQL from either the nqquery.log or (in 11.1.1.6+) table S_NQ_DB_ACCT and run it against the database.
For example, using sqlplus, the input file would look like this, with a set termout off to supress the rows, and exit to quit sqlplus after execution:
$ cat test_report.sql
set termout off

select sum(T233609.DEPARTURES_PERFORMED) as c1,
     T233732.Cal_Month as c2,
     T233804.ROUTE as c3
from      BI_AIRLINES.OBIEE_ROUTE T233804 /* 18 ROUTE */ ,     BI_AIRLINES.OBIEE_TIME_MTH_D T233732 /* 41 TIME MONTH */ ,     BI_AIRLINES.DOMESTIC_SEGMENT T233609 /* 01 DOMESTIC Segment */
where  ( T233609.DEST = T233804.DEST and T233609.MONTH = T233732.Cal_Month and T233609.ORIGIN = T233804.ORIGIN and T233609.QUARTER = T233732.Cal_Qtr and T233609.YEAR = T233732.Cal_Year )
group by T233732.Cal_Month, T233804.ROUTE;

exit
Run it with time prefix to see how long it takes:
$ time sqlplus BISAMPLE/BISAMPLE @test_report

SQL*Plus: Release 11.2.0.3.0 Production on Wed Feb 6 22:32:41 2013

Copyright (c) 1982, 2011, Oracle.  All rights reserved.

Connected to:
Oracle Database 11g Enterprise Edition Release 11.2.0.3.0 - Production
With the Partitioning, OLAP, Data Mining and Real Application Testing options

Disconnected from Oracle Database 11g Enterprise Edition Release 11.2.0.3.0 - Production
With the Partitioning, OLAP, Data Mining and Real Application Testing options

real    0m0.669s
user    0m0.028s
sys     0m0.083s
LoadTest.jar
Snuck in with the other goodies of SampleApp v207 is LoadTest.jar. You’ll find it in /home/oracle/scripts/loadtest, along with a readme file detailing how to use it. It takes as input a single Dashboard path, and runs concurrent user requests against it
[oracle@obieesampleapp loadtest]$ ./runtest
Start time: Wed Feb  6 22:42:39 GMT 2013
Load Test Starting...

----------------------------------------------
Creating User Sessions for Concurrency Test..
Total active sessions: 54

Initiating Queries..
Total queries initiated: 54

Cleaning up User Sessions created for Concurrency Test..
        - Remaining Active Sessions: 54
Completed User Sessions Cleanup
----------------------------------------------

Load Test Completed...
End time: Wed Feb  6 22:42:45 GMT 2013
It requires a list of usernames (all having the same password) and these users to have been created in the security directory beforehand.
What next?
With a test designed and built we're now ready for launch ... read on to see how best to make sure all the important metrics are captured with your test when you execute it.
Other articles in this series
This article is part of a series on the subject of Performance and OBIEE:
I’d love your feedback. Do you agree with this method, or is it a waste of time? What have I overlooked or overemphasised? Am I flogging a dead horse?
Because there are several articles in this series, and I’d like to the comments in one place, I’ve enabled comments on the summary and FAQ post here, and disabled comments on the others.