Performance and OBIEE - part II - Test - Define

Take the first tentative steps along the yellow brick road of investigating performance and OBIEE with this jump into the nitty gritty of how we should define a performance test.
An overview of defining a performance test
The first step in assessing the performance of OBIEE is defining the test we are going to use. For troubleshooting a performance problem in Production, this might be a single report. For performance testing a new system it might be more complex. The process to define it needs to be the same though.Let us consider for a moment what it is we want to achieve through a performance test. It should be a validation - or possibly determination - of some or all of the following, which may or may not be formally documented in a project as ‘Non-Functional Requirements’ (NFRs):
- Report response times
- User concurrency levels
- Hardware utilisation
This seems to be the level at which some people perceive the complexity of performance testing; that is, not at all.
But, to put any weight in the above results would presume that the system under test had :
- Only one report
- No parameters or other interactivity on the report
- Every user runs the report at the exact same time
As soon as you accept this premise, then you have to accept the need to design your performance test properly if you want any kind of confidence in the results that you get.
Of course, there is the chance - [sarcasm]vastly improbable and unheard of I know[/sarcasm] - that Performance Testing is a tick box on a project plan (normally about a week before Go Live), from which there is the expectation that it can deliver the confidence of an accurate test with the simplicity and brevity of the one-report test I describe above. If that is the case then I hope this article will explain why it is a fallacy.
Walk before you run
There are three key things to aim for in the design of a performance test:- Repeatability. You must be able to rerun the test, so that you can (a) prove bugs/performance problems have been fixed, and (b) re-use the test as a baseline for future measurements
- Accuracy. This can be difficult with a stack as complex as the OBIEE one, but you must do all you can to avoid conflation and misinterpretation of data.
- Ease of Analysis. If the result of your test is unsuccessful, you will have to start analysing the issue. If your test is unnecessarily big or complex then it will be very difficult and time consuming to pare it back to find root cause.
 Avoid the blunderbus approach. It’s tempting (and fun!) to get carried away building a huge test and run it with a big number of users - but if it brings the system down then the only immediately conclusion you can draw is that you can crash the system. To get to any kind of root cause of the limitation you will have to run more tests, and you will have to simplify the test that you did run to pinpoint the actual issue(s).
Build up small tests with single users and check things work at this level first. You can then combine these together into larger tests for load testing. By working this way you get the added benefit of a better understanding of the workings of your load test and system being tested, as you will have gained this experience from the smaller tests.
Think of it as assembling a car’s engine for yourself versus buying a car out of the showroom. If it breaks (or you want to tune it), you’ll be in a better place to start if you have been under the bonnet [hood] already.
Define a User
The first step in defining a good test is to define extremely precisely and clearly what it is we are testing. This section’s heading I take from Zed Shaw’s superb article “Programmers need to learn statistics…”. For me it encapsulates in three words the challenge that we face in designing a good test. We know we want our system to support more than one user, and we probably have a user concurrency figure (of which more below) that the system must support. So, how do we define ‘a user’? To quote from the aforementioned article, do we just “click around a bit, you know, like a user”? Maybe we run the OBIEE-equivilent ofSELECT 1 FROM DUAL a thousand times simultaneously, and then declare our system can support a thousand concurrent users?
The challenge is that good test or not, test results and system capacity will often be boiled down to a discussion of simple “user” numbers. Will the system support 100 users? 200 users? And so on.
Modelling the workload of a transactional (OLTP) system is relatively straightforward in that there is a finite number of transactions, even if it is a large number. When we consider how to model an OBIEE user in a performance test, we have additional challenges:
- Navigation paths
- In an OLTP system such as an online store once a user clicks on ‘add to cart’ we can be pretty sure they will then either (a) carry on shopping or (b) go to checkout. What about a BI user once they’ve run their first report, which will they run then? Maybe a different report, but quite likely it will be navigation within the existing report (eg drill down, prompt changes, etc)
- Ad hoc
- Whilst some reporting will be fixed reports, much business value from BI comes in the analysis and exploration of data in an ad hoc manner to discover trends etc to give competitive advantage. These ad hoc queries cannot, by definition, be known in advance, so the performance test definition must find a way to address this.
Think about how many types of users you have on your system, and how you would characterise and group them. There will be different sets of data they access, and varying degrees of interactivity with which they use the tool. Some will be using pre-built reports with fixed filters, other may be doing extensive ad-hoc analyses, and somewhere in the middle will be pre-built reports but with a fair amount of interactivity through functionality such as prompts and selection steps.
Define a Report
So for each of our User types that we define, we need to precisely define the workload for them. This will be made up of the execution of one or more dashboards/reports. Defining the report that our model users are going to run is not as simple as it may appear. As well as the distinction to make between individual reports (Analyses/Answers) and Dashboards, we also need to consider:- Filters
- How do we model a report which has six possible filters? We can’t just call that ‘report A’, because each filter permutation could cause different SQL to be generated by the BI reporting tool and consequently vastly different execution plan(s) on the database where the query runs.
- Aggregate navigation
- One of OBIEE’s many strengths is its aggregate navigation capability, enabling the user to drill down into data whilst in the background the tool switches between pre-defined aggregate tables on the database to pick the fastest one to use. For performance testing we need to make sure that within a report each possible aggregate is considered separately.
As an example, let us examine a dashboard from SampleApp.

At an initial glance, we could specify our “Report” as simply being “Dashboard 3.10”. But…the dashboard is made up of three analyses (plus some static text/image objects)
- “Product Line Analysis”
- “Ragged Hierarchy”
- “Value Based (Parent Child) Hierarchy”
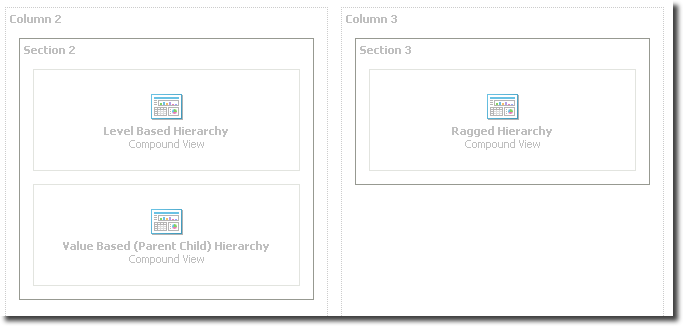
We need to consider each of these reports individually. In addition, there are hierarchical columns which, like Prompts, must be included in our test specification. Here’s one of the reports from the dashboard in two different states of hierarchical navigation.
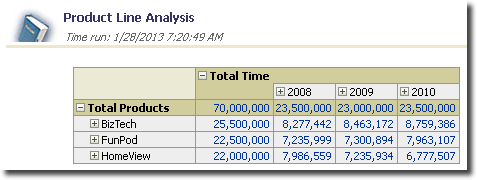
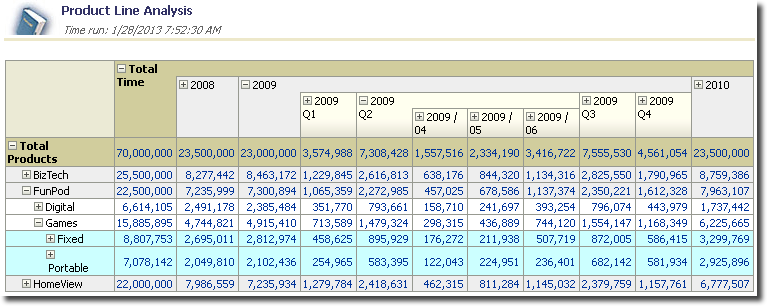
Depending on the hierarchical column states, depending on dashboard prompt values, depending on aggregate drill paths followed, the same individual report has the potential to behave quite differently.
Any report or dashboard that’s using prompts needs to have those prompt values stated in the test definition. The execution of a query on the database can vary considerably depending on the predicates supplied, and it is in part from the report/dashboard prompts that these predicates come.
Ad-hoc reports
Conspicuous by its absence from the above is how we deal with ad-hoc reporting with OBIEE in our performance tests. This is the elephant in the room when it comes to performance testing OBIEE, because we cannot go through the same methodical process of cataloging the workload – because it is ad hoc. This is discussed in detail later.User workload
Having precisely defined the reports which are going to be run, we can sequence them together to represent different types of users. Clearly this is going to be a generalisation, an estimation, of how a particular group of users is going to tend to use the reports. Unlike an OLTP transaction, where the steps are much more predefined and free from possible deviations, users of OBIEE have the flexibility to run any number of reports, drill within existing reports, and so on.Taking the above SampleApp dashboard as an example, one user (let’s call them the “Product Analyst”) might have the following test sequence:
- View
Dashboard 3.10in default state - Drill into hierarchical columns of
Product Line Analysis - View
1.3 Sample Sales - Product Details
You don’t need to restrict yourself to one user type per actual group of users. You could model several different instances of each user group in order or increase the test coverage and realism of different reports running concurrently. Be aware that the more user types and tests you have, the longer it will take to build, and the more complex the troubleshooting could be.
Think Time
Users are not computers, which is a shame because it would make reasoning with them a lot easier. It also means that they do not just one run report after another. They run a report, look at the numbers, get a cup of tea, change a prompt value, have a chat with a colleague, and so on.As part of your user workload, plan in some think times. Don’t spend too long thinking about it (geddit), because remember this user workload is an approximation of what a certain type of user is going to be doing.
User concurrency
 Once we have designed a set of individual user workloads, we can bring these together into a larger test to assess the performance of the system as a whole under load. The aim of load testing is to assess what happens to the response time of reports, and hardware utilisation, as the number of concurrent users on the system increases. There are three key things to define in a load test:
- the workload of each user
- the different types of user
- the number of concurrent users
First, make sure that you are clear in the definition of concurrency that you use. These include:
- Concurrent user sessions logged into OBIEE, viewing dashboards, formatting reports, and so on.
- Concurrently executing queries at the BI Server level, which could be a single user running one report or one dashboard.
- Concurrently executing queries on the database, which could be a single user in OBIEE running a single report or dashboard requiring more than one SQL request to get its data.
For some reason, user concurrency is often a contentious number to define. With the greatest of apologies to Monty Python, I offer this paraphasing of a familiar conversation:
“yah, my system needs to support 100 concurrent users”“100? I’d take that as a QUIET DAY for my system, bwahaha, I need to test at least 1,000 concurrent users!”
“1,000? You were LUCKY! My system would run a gazillion concurrent users at three o’clock in the morning, work twenty hours down t’pit and still run 5,000 concurrent users before having a handful of cold gravel for its tea”
 There does seem to be BSD syndrome around user concurrency figures, with people always pitching high numbers. This is counterproductive. If you run a performance test using a completely simulated workload with an excessively high number of users as the target then the margin of ‘error’ (how accurately your test represents reality) inherent in the simulation approach will be magnified as the user concurrency increases. The net effect of this is that you cannot be confident that any problems that do happen will actually happen in real life. Conversly, if you are taking real workload and running it for many users, you can honestly say if it doesn’t work in testing, it won’t work in real life.
If you are worried about pitching your user estimate too low and so double it or stick a zero on the end just in case, consider the following: If you define your test as being a fail if it does not support your high figure of concurrent users - what then? You have to ask for money, either literally to buy bigger hardware, or in kind, to support the time to optimise the system you do have. It’s not a great place to be in, and one which may be unnecessary. A sensible approach is the following:
- Load test to confirm whether the system can support the realistic number of users in the short-term, e.g. go-live and a few months beyond
- Defer part of the load testing until after go-live, when you can run a test for medium/long-term user numbers using real user workload for your tests. The benefit of this is that your second test will be far more accurate because your simulation will not be based on how you think you system will be used but how you know is it being used.
- take a realistic figure to start with for your first test
- run a second performance test to validate a future growth figure for your user base. If you don’t have a future growth figure, then you could consider the second test being to simply determine how many users your system can support by ramping numbers up until things start to creak.
User concurrency numbers for an existing system
If you have an existing system then it is easy to determine your actual user concurrency through either Usage Tracking (you do have it enabled, don’t you?) or the OBI DMS metrics.- If your user concurrency figure is based on users logged into OBIEE, not necessarily running reports, then the metric Oracle BI PS Sessions : Sessions Logged In should be appropriate.
- For the number of queries (logical SQL) concurrently running on the BI Server, use Usage Tracking (see below), or DMS metric t.b.c!
- The number of concurrent queries on the database can either be obtained from your database’s monitoring tool, or through the Oracle BI DB Connection Pool DMS metrics.
To estimate user concurrency from Usage Tracking, you can use the following query. It will analyse Usage Tracking to give an approximate number of concurrent users, but this is based on individual queries run on the BI Server, so it not the same as users simply logged into OBIEE, nor the same as dashboard refreshes (since one dashboard could be many queries):
-- Usage Tracking Concurrency usage estimate
-- Per minute granularity

SELECT TO_CHAR(start_ts, 'YYYY-MM-DD HH24:MI') AS start_ts_min,
       COUNT(DISTINCT user_name)               AS distinct_users
FROM   s_nq_acct
GROUP  BY TO_CHAR(start_ts, 'YYYY-MM-DD HH24:MI')
ORDER  BY 1 DESC
Estimating user concurrency numbers
If you don’t have empirical numbers to use then 10% of your total user base is the rule of thumb often worked to.User concurrency is multi dimensional
Just as there is no such thing as “A User”, to ensure an accurate performance test user concurrency figures should also be specified in terms of :- Types of concurrent user, for example:
- “10 Concurrent Finance Power Users”
- “2 Concurrent Finance Ad-Hoc Users”
- “60 Concurrent HR Report Consumers”
- Periods of system usage, for example:
- Monday morning peak
- EOD peak
- ‘Average’
You may only actually test the peak user concurrency model, but it’s a good idea to have a picture of the system profile, particularly when analysing the impact and capacity for ad-hoc usage.
Summary : User and Report Definition
Remember:Before you can measure something you really need to lay down a very concrete definition of what you’re measuring. – Zed ShawWhatever kind of testing you are doing, aim to make it modular wherever possible. It will make both analysis and reuse of test code easier. Almost all test definitions should be made up of one or more of the following levels:
- Specific Report or dashboard along with all prompt values, hierarchical column settings, etc. This is the base unit of your performance test.
- Then take these individual tests, and use them together to create an individual User Workload model for each user.
- Finally, combine the User models to produce an overall Concurrent User workload simulation.
Points to remember in your test definition:
- Whilst each dashboard does have its own name, a good idea is to use your own ID system to make it easy to refer to a specific dashboard state. For example, when using prompts there might be two or more versions of the dashboard to test (for different prompt values). It’s also easier to refer to something like “ID01” in conversation and notes than it is it “Finance Dashboard - Profitability EMEA blah blah blah”.
- Don’t forget default values in your navigation. If you are testing specific dashboard prompt values, you’ll need to also test the default values first - because that is what will get executed when the user first clicks onto the dashboard.
- As well as testing dashboard response times, factor in the usability of any prompts that the user will interact with. A fast dashboard is not quite so impressive if the user had to wait a long time for the dashboard prompts to display the available values.
- You need to be writing down nuts and bolts detail here. Resist the temptation to skimp on the detail or assume you’ll remember – you won’t, and certainly your colleague who can reuse your testing won’t appreciate having to fill in the blanks to make use of it.
What do you mean, not all of it has been tested?
 Before you run off to write down all your dashboards and types of user, consider the following. Unless you have :
- A very small system
- A lot of time, and/or an infinite number of monkeys
There are too many factors (prompt values, aggregate paths, ad hoc usage) to be able to model all plausible (let alone possible) permutations of these.
Designing the scope of a performance test needs to take into account the acceptable risk of things going wrong vs time/budget available vs functionality required. By functionality, I mean factors such as the breadth of dashboards delivered, or data made available.
- In some systems the stability is paramount and therefore the relative risk must be minimised. If this is the case and your time/budget is constrained then therefore the functionality will have to be constrained.
- If you need to deliver a lot of functionality and assuming that time/budget is fixed, then you will need to accept an increased risk to the stability of your system.
- If you have limitless time/budget then you can deliver lots of functionality and do large and wide-ranging performance tests to ensure minimal risk.
- Permutations of fixed reporting - each dashboard can have multiple prompt dimensions, hierarchical column expansions. Users can follow many different drill and navigation paths from any one dashboard.
- Ad hoc reporting - by definition, the report is not known until the user builds it, so we cannot test it beforehand
- Traditional performance testing of fixed reports as described above
- Testing predefined ad-hoc reports (if that isn’t a paradox)
- Holistic and heuristic evaluation of the system design and data model
- Resource management to curtail the impact of bad queries
- Active monitoring to identify bad queries and deal with them (using the T.E.A. method)
- Feedback loop : as system usage becomes clearer, refine original performance testing using a more accurately informed model (using the T.E.A. method)
How can you possibly test a new application enough to be confident that you’re not going to wreck your production implementation with performance problems?You can model. And you can test. However, nothing you do will be perfect. It is extremely difficult to create models and tests in which you’ll foresee all your production problems in advance of actually encountering those problems in production.
Some people allow the apparent futility of this observation to justify not testing at all. Don’t get trapped in that mentality. The following points are certain:
Somewhere in the middle between “no testing” and “complete production emulation” is the right amount of testing. The right amount of testing for aircraft manufacturers is probably more than the right amount of testing for companies that sell baseball caps. But don’t skip performance testing altogether. At the very least, your performance test plan will make you a more competent diagnostician (and clearer thinker) when it comes time to fix the performance problems that will inevitably occur during production operation.
- You’ll catch a lot more problems if you try to catch them prior to production than if you don’t even try.
- You’ll never catch all your problems in pre-production testing. That’s why you need a reliable and efficient method for solving the problems that leak through your pre-production testing processes.
An example OBIEE test definition
Here’s an example test definition, put together from SampleAppv207.What we are going to model is two groups of users. One likes pretty pictures and just runs two chart-based dashboards and then logs out. The other is interested in numbers and does some filtering on an analysis dashboard.
First, we’ll define the dashboards in use. For brevity, I’ve omitted the constituent analysis details, but in normal practice it’s a good idea to include them (for future reference, ease of understanding, clarity, etc).
Dashboards
Dashboard : ID01

- Dashboard : 3.20 Vanilla Visuals
- Page : Standard Visuals
- Path :
/shared/3. Analysis and Dashboards/_portal/3.20 Vanilla Visuals - Dashboard Prompts: None
- Analyses :
/shared/3. Analysis and Dashboards/Report Views/Gallery/Examples of Standard Visualizations
Dashboard : ID02

- Dashboard : 3.20 Vanilla Visuals
- Page : Trellis-Product Sales
- Path :
/shared/3. Analysis and Dashboards/_portal/3.20 Vanilla Visuals Trellis-Product Sales - Dashboard Prompts: None
- Drill state : Default (NB each chart can be clicked on to drill into detail)
- Analyses :
- /shared/3. Analysis and Dashboards/Report Views/Trellis/Revenue Breakup
- /shared/3. Analysis and Dashboards/Report Views/Trellis/Product Cost and Unit Price Trend
- /shared/3. Analysis and Dashboards/Report Views/Trellis/Brand Cost and Unit Price Trend
- Offices Region Hier : All collapsed, except AMERICAS expanded one level
Dashboard : ID03

- Dashboard : 1.3 Sample Sales
- Page : Brand Analysis
- Path :
/shared/1. Quick Demos/_portal/1.3 Sample Sales Brand Analysis - Dashboard Prompts:
- T05 Per Name Year : Default (2008, 2009, 2010, 2011)
- D4 Company : Default (none)
- T31 Cal Week : Default (between 0 and 53)
- “Products”.“Products Hierarchy” : Default (none)
- Analyses :
/shared/1. Quick Demos/Simple Demo Dashboard/Brand Analysis/Product Line Analysis/shared/1. Quick Demos/Simple Demo Dashboard/Brand Analysis/Trending Analysis/shared/1. Quick Demos/Simple Demo Dashboard/Brand Analysis/Gauges/shared/1. Quick Demos/Simple Demo Dashboard/Brand Analysis/Top Customers Bookings/shared/1. Quick Demos/Simple Demo Dashboard/Brand Analysis/Daily Revenue Timeline
Dashboard : ID04
- Dashboard : 1.3 Sample Sales
- Page : Brand Analysis
- Path :
/shared/1. Quick Demos/_portal/1.3 Sample Sales Brand Analysis - Dashboard Prompts:
- T05 Per Name Year : 2010, 2011
- D4 Company : Stockplus Inc.
- T31 Cal Week : between 1 and 27
- “Products”.“Products Hierarchy” : Default (none)
- Analyses :
/shared/1. Quick Demos/Simple Demo Dashboard/Brand Analysis/Product Line Analysis/shared/1. Quick Demos/Simple Demo Dashboard/Brand Analysis/Trending Analysis/shared/1. Quick Demos/Simple Demo Dashboard/Brand Analysis/Gauges/shared/1. Quick Demos/Simple Demo Dashboard/Brand Analysis/Top Customers Bookings/shared/1. Quick Demos/Simple Demo Dashboard/Brand Analysis/Daily Revenue Timeline
Tip: Use Catalog Manager to generate a report of dashboards and their constituent analyses to make the creation of the above specification easier. :


User Workload
Having defined the dashboards (ID01 - ID04), we define the user types and workloads:User A
- Description: Department X, executive
- Workload model:
- ID01
- Think time: 60 seconds
- ID02
- Think time: 60 seconds
- Logout
User B
- Description: Department Y, analyst
- Workload model:
- ID03
- Think time: 120 seconds
- ID04
- Think time: 90 seconds
- Logout
Concurrency
Our concurrent user model looks like this. I am defining concurrent users as active users, that is, executing dashboards or simulated thinking.Peak usage
- User A : 5 concurrent users
- User B : 2 concurrent users
Light usage
- User A : 3 concurrent users
- User B : 1 concurrent users
Types of testing
Before we can consider the types of test, we need to define what it is we are testing, hence the long section above. Once you’ve identified the types of user and specific reports they will run, you should also look at the type of test you want to run. The terminology is frequently used interchangably, so here’s my version of it:- Performance testing
- With a single user, is the response time acceptable?
- Load testing
- With concurrent users, is the response time acceptable and stable?
- Capacity testing
- How does the system behave when concurrent users are simulated? do any areas show signs of reaching capacity of resource?
- Soak testing
- How does the system behave if the concurrent user workload is left to run for many hours? For example, are there any memory leaks lurking, or connections which are not closed down properly and will eventually run out?
- Stress testing
- As we increase the number of concurrent users beyond that required (and already tested successfully), how far will the system go until something breaks or response times suffer?
- In a high-availability deployment, what happens to response times if we simulate partial stack failures? Does the system handle this gracefully under load?
These types of test do not have to be mututally exclusive in execution, but in defining your testing make sure you have covered them all, or explained why they are not necessary. An example would be performance testing a single report change on an existing system would probably not warrant a full scale soak test.
In summary
The output of this phase of the method should typically be a set of test definitions, not one single one. As already discussed, keeping tests modular and simple is a much better approach than trying to kill all the birds with one boulder.Footnote: The soft squidgy side of performance testing
Tangent: Enterprise change control processes
Taking the premise discussed above - that it is impossible to test every possible report execution - raises an interesting question around change control and the stability of a Production environment. If your company is one where releases must be triple tested and signed off in the blood of your firstborn the you might want to have this conversation sooner rather than later. Why? Well if your system has any element of ad-hoc usage then there is a chance that a user will run a query that disrupts other users on the system. There is always the potential for the perfect storm of it being a critical business period, high user traffic, and a rogue ad-hoc query. Without proper understanding of the nature of ad-hoc queries, an almighty witch hunt can ensue, looking for who broke Production. If this kind of risk is unacceptable then you will have to look into mitigating it with things like resource management and environment partitioning.Estimating performance test for project planning
The challenge that the complexity and multiple facets of performance testing gives is finding a way to communicate it accurately to project managers and business sponsors.Unlike an estimate for code delivery, which will be <x> days and after which the code will either function or not, performance testing can pretty much take as long as you like, and the kicker is that the tests will only give varying degrees of confidence that things should be OK in production, but with no guarantees.
Doing the initial analysis on the system is a fixed time, as is building the test rig(s) with which to test it. Once you have done this, then defining the number of dashboards to test can be done based on the time available. The more dashboards are tested, the greater certainty can be had that any problems will be uncovered. Other fixed tasks should be a review of the overall design, as well as time to properly document the tests undertaken and an analysis of the results obtained. It is a false economy to skimp on the documentation, as to do so renders almost useless the results obtained for future work. Good documentation of testing undertaken and results found can greatly shorten the time necessary in the future when revisiting the work either for a new phase of development or to troubleshoot performance problems that have arisen.
What next?
Next up is designing the test that we've just defined ... read on!Other articles in this series
This article is part of a series on the subject of Performance and OBIEE:Comments?
I’d love your feedback. Do you agree with this method, or is it a waste of time? What have I overlooked or overemphasised? Am I flogging a dead horse?Because there are several articles in this series, and I’d like to keep the discussion in one place, I’ve enabled comments on the summary and FAQ post here, and disabled comments on the others.