Monitoring OBIEE Performance for the End User with JMeter from EM12c

This is the third article in my two-article set of posts (h/t) on extending the monitoring of OBIEE within EM12c. It comes after a brief interlude discussing Metric Extensions as an alternative using Service Tests to look at Usage Tracking data.
Moving on from the rich source of monitoring data that is Usage Tracking, we will now cast our attention to a favourite tool of mine: JMeter. I’ve written in detail before about this tool when I showed how to use it to build performance tests for OBIEE. Now I’m going to illustrate how easy it can be to take existing OBIEE JMeter scripts and incorporate them into EM12c.
Whilst JMeter can be used to build big load tests, it can also be used as a single user. Whichever way you use it the basis remains the same. It fires a bunch of web requests (HTTP POSTs and GETs) at the target server and looks at the responses. It can measure the response time alone, or it can check the data returned matches what’s expected (and doesn’t match what it shouldn’t, such as error messages).
In the context of monitoring OBIEE we can create simple JMeter scripts which do simple actions such as
- Login to OBIEE, check for errors
- Run a dashboard, check for errors
- Logout
EM12c offers the ability to run “Custom Scripts” as data collection methods in Service Tests (which I explain in my previous post), and JMeter can be invoked “Headless” (that is, without a GUI) so lends itself well to this. In addition, we are going to look at EM12c’s Beacon functionality that enables us to test our JMeter users from multiple locations. In an OBIEE deployment in which users may be geographically separated from the servers themselves this is particularly useful to check that the response times seen from one site are consistent with those from another.
Note that what we’re building here is an alternative version to the Web Transaction Test Type that Adam Seed wrote about here, but with pretty much the same net effect - a Service Test that enables to you say whether OBIEE is up or down from an end user point of view, and what the response time is. The difference between what Adam wrote about and what I describe here is the way in which the user is simulated:
- Web Transaction (or the similar ATS Transaction) Test Types are built in to EM12c and as such can be seen as the native, supported option. However, you need to record and refine the transaction that is used, which has its own overhead.
- If you already have JMeter skills at your site, and quite possibly existing JMeter OBIEE scripts, it is very easy to make use of them within EM12c to achieve the same as the aforementioned Web Transaction but utilising a single user replay technology (i.e. JMeter rather than EM12c’s Web Transaction).
The JMeter test script
You can find details of building OBIEE JMeter scripts here and even a sample one to download here. In the example I am building here the script consists of three simple steps:- Login
- Go to dashboard
- Logout

The important bit to check is the Thread Group - it needs to run a single user just once. If you leave in settings from an actual load test and start running hundreds of users in this script called from EM12c on a regular basis then the effect on your OBIEE performance will be interesting to say the least

Test the script and make sure you see a single user running and successfully returning a dashboard

Running JMeter from the command line
Before we get anywhere near EM12c, let us check that the JMeter script runs successfully from the commandline. This also gives us opportunity to refine the commandline syntax without confounding any issues with its use in EM12c.The basic syntax for calling JMeter is:
./jmeter --nongui -t /home/oracle/obi_jmeter.jmxWith --nongui being the flag that tells JMeter not to run the GUI (i.e. run headless), and -t passing the absolute path to the JMX JMeter script. JMeter runs under java so you may also need to set the PATH environment variable so that the correct JVM is used.
To run this from EM12c we need a short little script that is going to call JMeter, and will also set a return code depending on whether an error was encountered when the user script was run (for example, an assertion failed because the login page or dashboard did not load correctly). A simple way to do this is to set the View Results In Table sampler to write to file only if an error is encountered, and then parse this file post-execution to check for any error entries.

We can then do a simple grep against the file and check for errors. In this script I’m setting the PATH, and using a temporary file /tmp/jmeter.err to capture and check for any errors. I also send any JMeter console output to /dev/null.
export PATH=/u01/OracleHomes/Middleware/jdk16/jdk/bin:$PATH
rm /tmp/jmeter.err
/home/oracle/apache-jmeter-2.10/bin/jmeter --nongui -t /home/oracle/obi_jmeter.jmx 1>/dev/null 2>&1
grep --silent "<failure>true" /tmp/jmeter.err
if [ $? -eq 0 ]; then
        exit 1
else
        exit 0
fi
Note that I am using absolute paths throughout, so that there is no ambiguity or dependency on the folder from which this is executed.
Test the above script that you’ll be running from EM12c, and check the return code that is set:
$ ./run_jmeter.sh ; echo $?The return code should be 0 if everything’s worked (check in Usage Tracking for a corresponding entry) and 1 if there was a failure (check in nqquery.log to confirm that there was a failure)
Making the script available to run on EM12c server
To start with we’ll be looking at getting EM12c to run this script locally. Afterwards we’ll see how it can be run on multiple servers, possible geographically separated.So that the script can be run on EM12c, copy across your run_jmeter.sh script, JMeter user test script, and the JMeter binary folder. Check that the script still runs after copying it across.
Building the JMeter EM12c Service Test
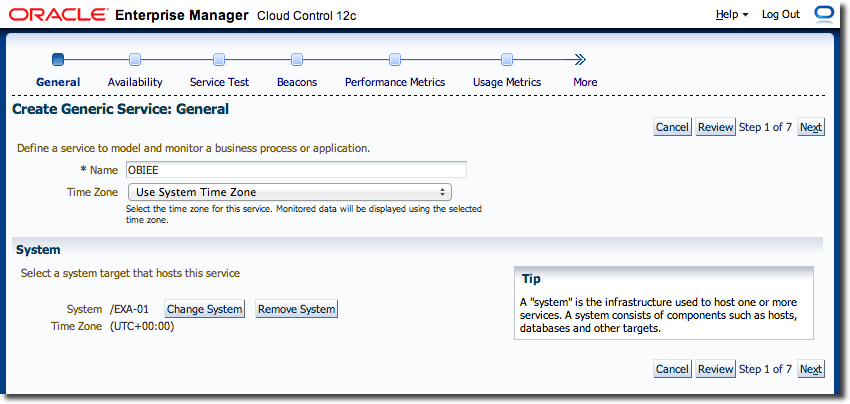
So now we’ve got a JMeter test script, and a little shell script harness with which to call it. We hook it into EM12c using a Service Test.From Targets -> Services, create a new Generic Service (or if you have one already that it makes sense in which to include this, do so).

Give the service a name and associate it with the appropriate System
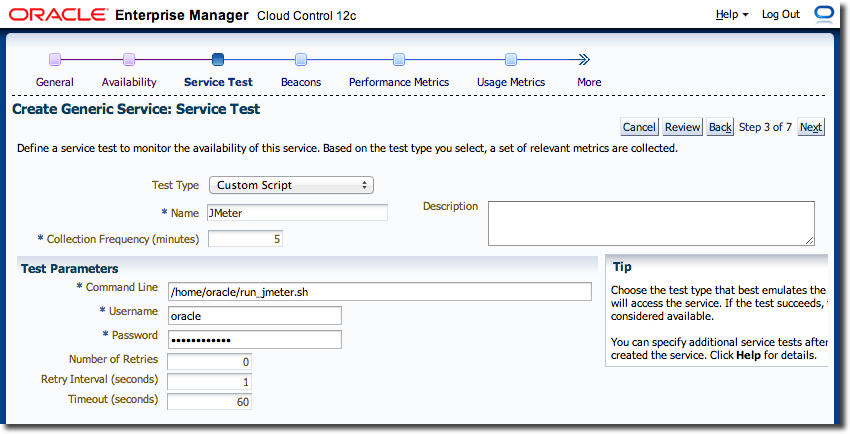
Set the Service’s availability as being based on a Service Test. On the Service Test screen set the Test Type to Custom Script. Give the Service Test a sensible Name and then the full path to the script that you built above. At the moment, we’re assuming it’s all local to the EM12c server. Put in the OS credentials too, and click Next
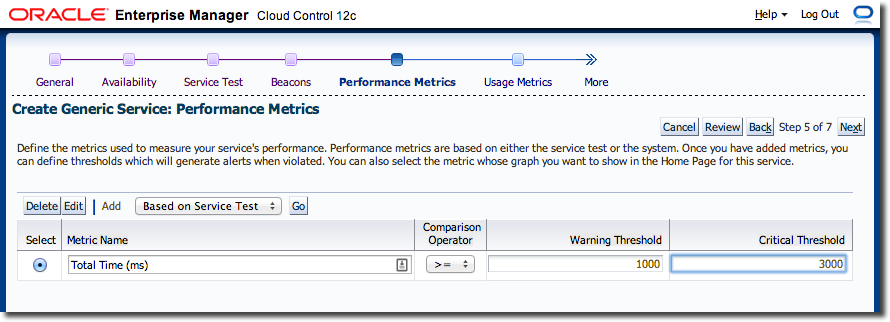
On the Beacons page, click Add and select the default EM Management Beacon. Click Next and you should be on the Performance Metrics screen. The default metric of Total Time is what we want here. The other metric we are interested in is availability, and this is defined by the Status metric which gets its value from the return code that is set by our script (anything other than zero is a failure).
Click Next through the Usage Metrics screen and then Finish on the Review screen
From the Services home page, you should see your service listed. Click on its name and then Monitoring Configuration -> Sevice Tests and Beacons. Locate your Service Test and click on Verify Service Test
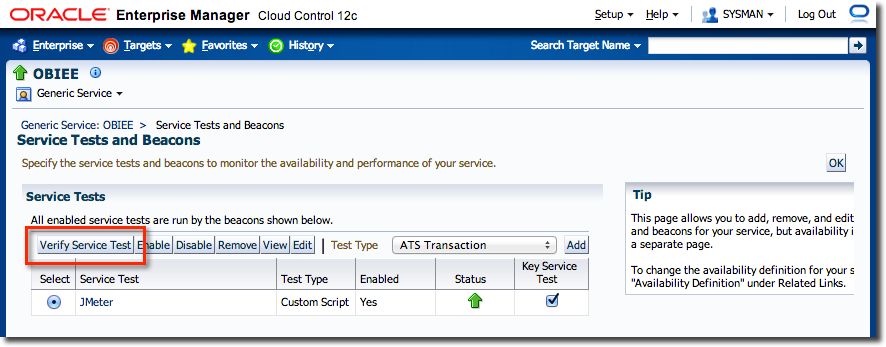
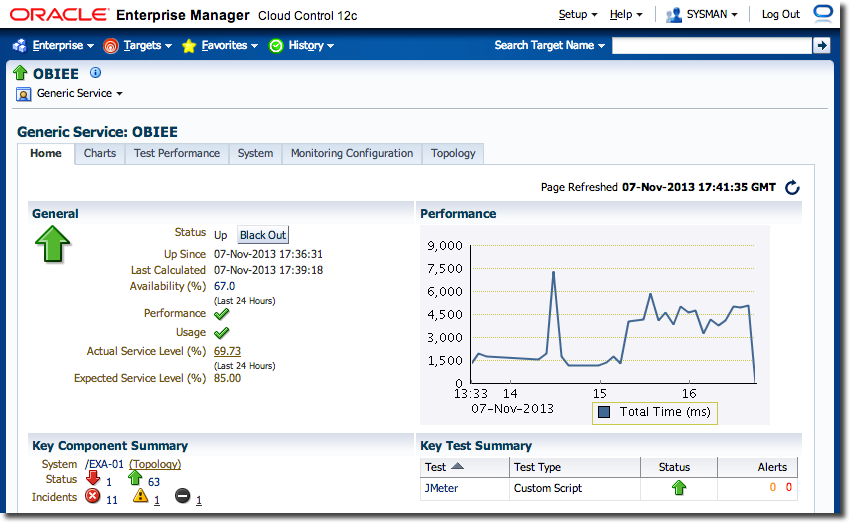
Click on Perform Test and if all has gone well you should see the Status as a green arrow and a Total Time recorded. As data is recorded it will be shown on the front page of the service you have defined:
One thing to bear in mind with this test that we’ve built is that we’re measuring the total time that it takes to invoke JMeter, run the user login, run the dashboard and logout – so this is not going to be directly comparable with what a user may see in timing the execution of a dashboard alone. However, as a relative measure for performance against itself, it is still useful.
Measuring response times from additional locations
One of the very cool things that EM12c can do is run tests such as the one we’ve defined but from multiple locations. It’s one thing checking the response time of OBIEE from local to the EM12c server in London, but how realistically will this reflect what users based in the New York office see? We do this through the concept of Beacons, which are bound to existing EM12c Agents and can be set as execution points for Service Tests.To create a Beacon, go to the Services page and click on Services Features and then Beacons:

You will see the default EM Management Beacon listed. Click on Create…, and give the Beacon a name (e.g. New York) and select the Agent with which it is associated. Hopefully it is self-evident that a Beacon called New York needs to be associated with an Agent that is physically located in New York and not Norwich…

After clicking Create you should get a confirmation message and then see your new Beacon listed:

Before we can configure the Service Test to use the Beacon we need to make sure that the JMeter test rig that we put in place on the EM12c server above is available on the server on which the new Beacon’s agent runs, with the same paths. As before, run it locally on the server of the new Beacon first to make sure the script is doing what it should.
To get the Service Test to run on the new Beacon, go back to the Services page and as before go to Monitoring Configuration -> Sevice Tests and Beacons. Under the Beacons heading, click on Add.

Select both Beacons in the list and click Select

When returned to the Service Tests and Beacons page you should now see both beacons listed. To check that the new one is working, use the Verify Service Test button and set the Beacon to New York and click on Perform Test.
To see the performance of the multiple beacons, use the Test Performance page:
