Stream Analytics and Processing with Kafka and Oracle Stream Analytics

In my previous post I looked the latest release of Oracle Stream Analytics (OSA), and saw how it provided a graphical interface to "Fast Data". Users can analyse streaming data as it arrives based on conditions and rules. They can also transform the stream data, publishing it back out as a stream in its own right. In this article we'll see how OSA can be used with Kafka.
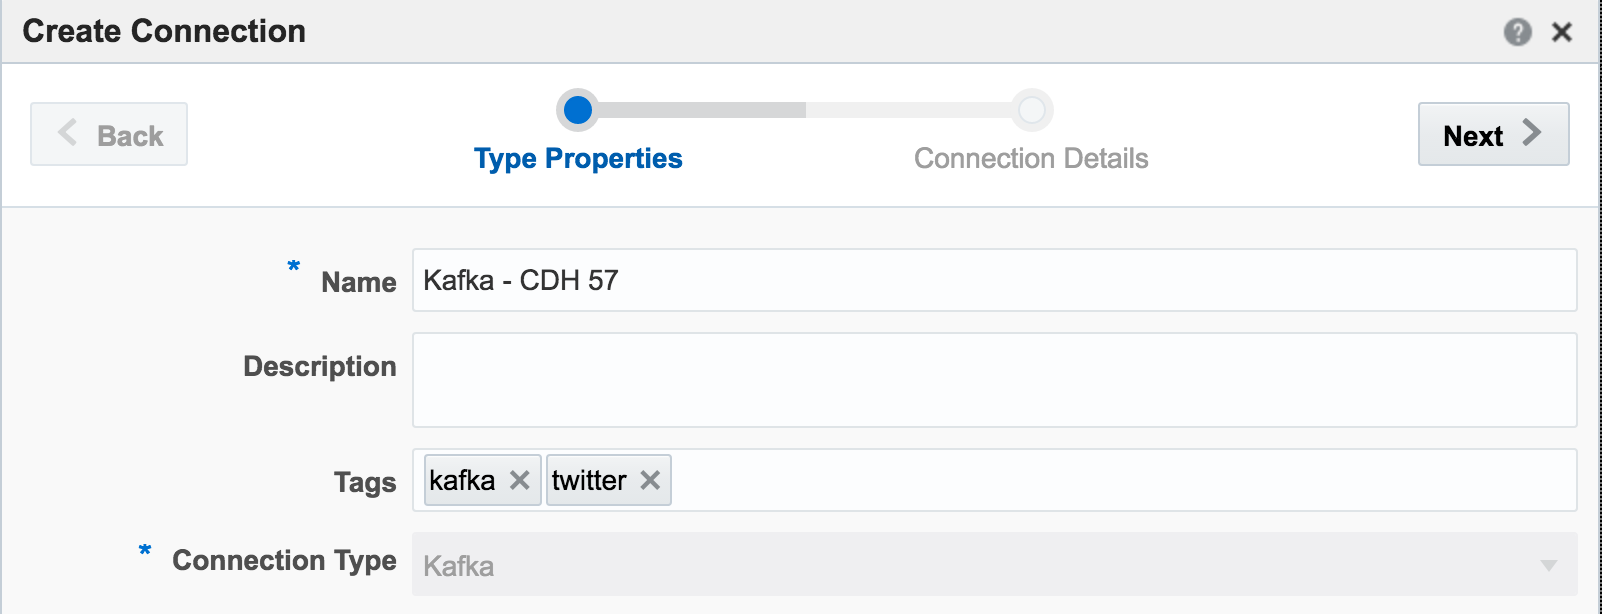
Kafka is one of the foremost streaming technologies nowadays, for very good reasons. It is highly scalable and flexible, supporting multiple concurrent consumers. Oracle Streaming Analytics supports Kafka as both a source and target. To set up an inbound stream from Kafka, first we define the Connection:
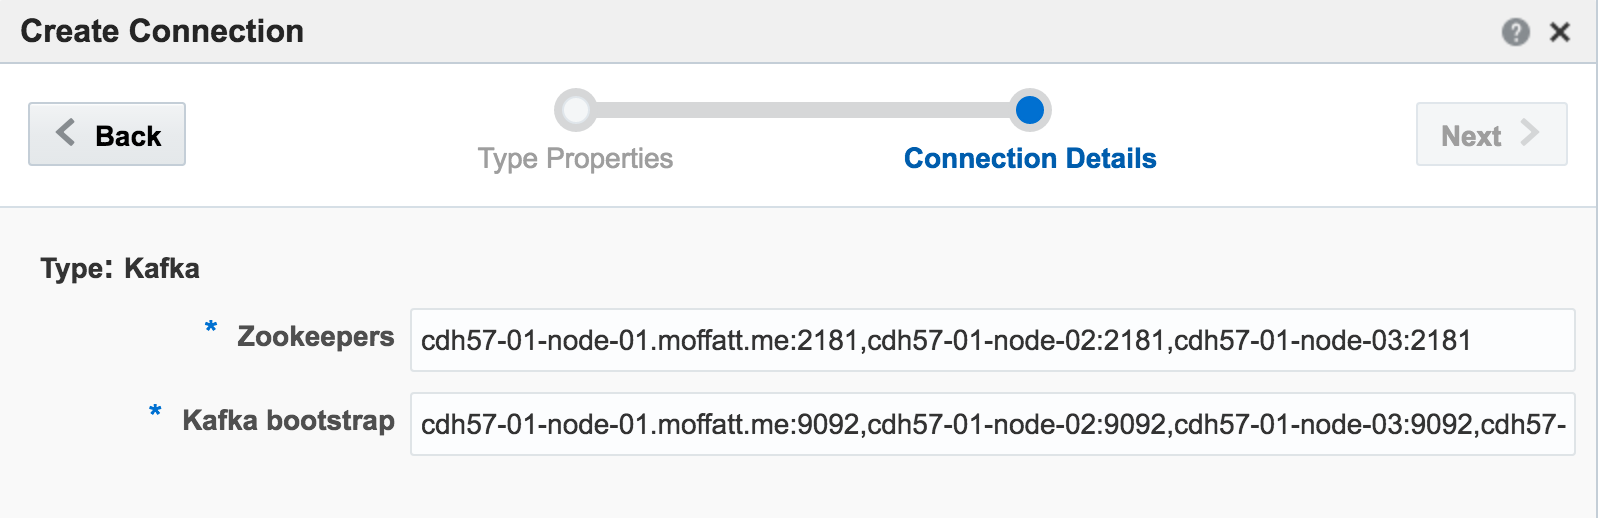
If you get an error at this point of Unable to deploy OEP application then check the OSA log - it could be a connectivity issue to Zookeeper.
Exception in thread "SpringOsgiExtenderThread-286" org.springframework.beans.FatalBeanException:
Error in context lifecycle initialization; nested exception is com.bea.wlevs.ede.api.EventProcessingException:
org.I0Itec.zkclient.exception.ZkTimeoutException:
Unable to connect to zookeeper server within timeout: 6000
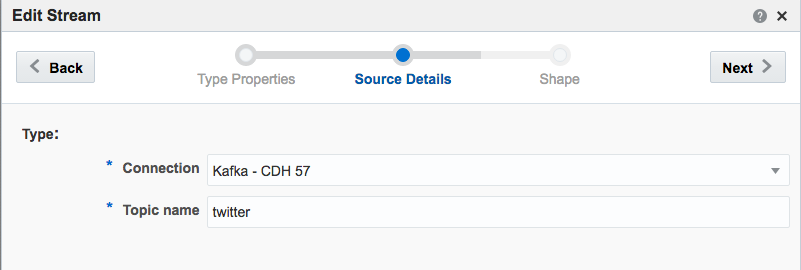
Assuming that the Stream is saved with no errors, you can then create an Exploration based on the stream and all being well, the live tweets are soon shown. Unlike the example at the top of this article, these tweets are coming in via Kafka, rather than the built-in OSA Twitter Stream. This is partly to demonstrate the Kafka capabilities, but also because the built-in OSA Twitter Stream only includes a subset of the available twitter data fields.
Avro? Nope.
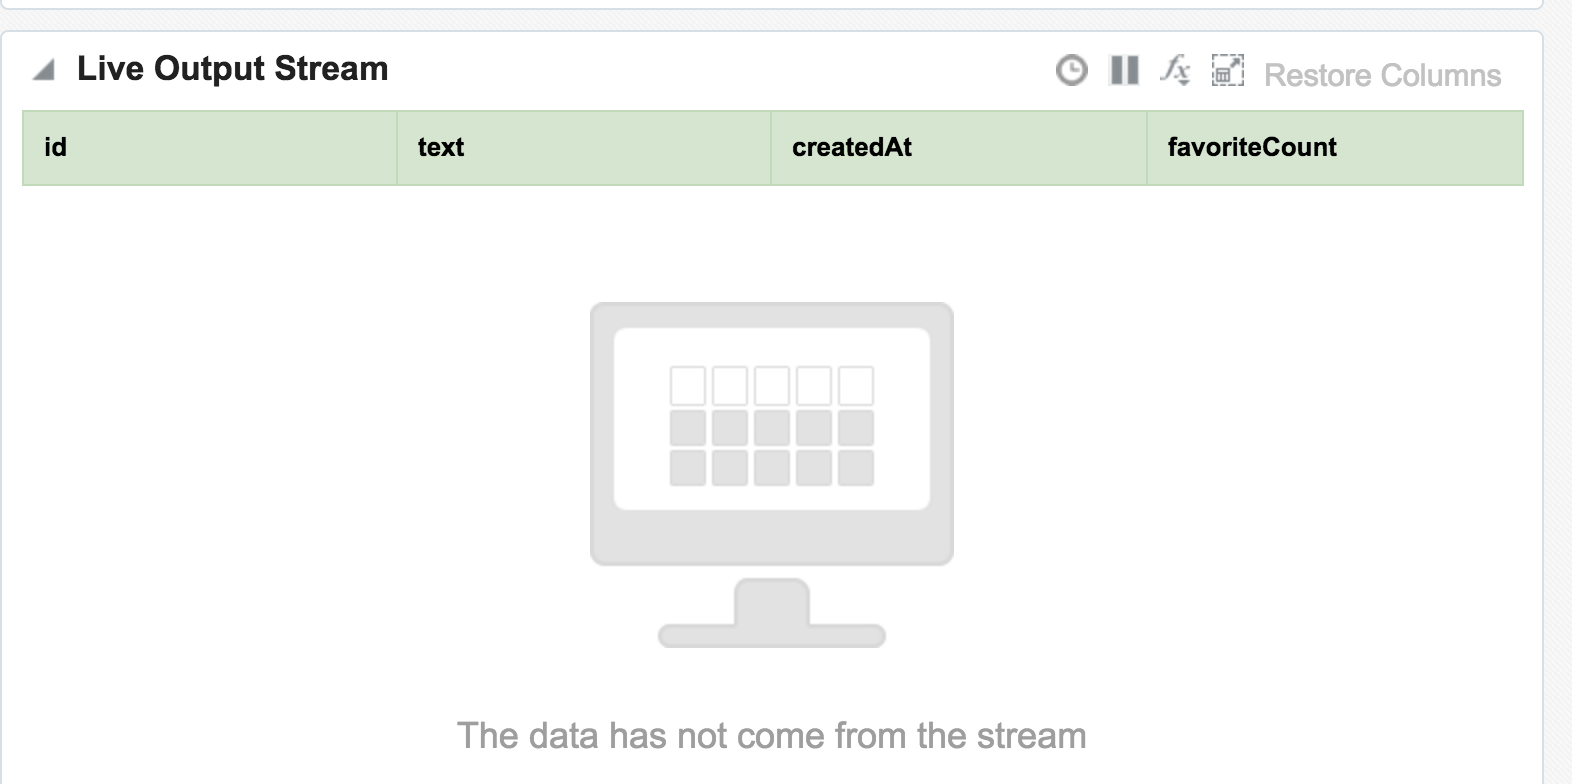
Data in Kafka can be serialised in many formats, including Avro - which OSA doesn’t seem to like. No error is thrown to the GUI but the exploration remains blank.
line 1:0 no viable alternative at character '?'
line 1:1 no viable alternative at character '?'
line 1:2 no viable alternative at character '?'
line 1:3 no viable alternative at character '?'
line 1:4 no viable alternative at character '?'
line 1:5 no viable alternative at character '?'
line 1:6 no viable alternative at character '?'
line 1:7 no viable alternative at character '?'
line 1:8 no viable alternative at character ''
JSON? Kinda.
One of the challenges that I found working with OSA was defining the “Shape” (data model) of the inbound stream data. JSON is a format used widely as a technology-agnostic data interchange format, including for the twitter data that I was working with. You can see a sample record here. One of the powerful features of JSON is its ability to nest objects in a record, as well as create arrays of them. You can read more about this detail in a recent article I wrote here. Unfortunately it seems that OSA does not support flattening out JSON, meaning that only elements in the root of the model are accessible. For twitter, that means we can see the text, and who it was in reply to, but not the user who tweeted it, since the latter is a nested element (along with many other fields, including hashtags which are also an array):
root
|-- created_at: string (nullable = true)
|-- entities: struct (nullable = true)
|    |-- hashtags: array (nullable = true)
|    |    |-- element: struct (containsNull = true)
|    |    |    |-- indices: array (nullable = true)
|    |    |    |    |-- element: long (containsNull = true)
|    |    |    |-- text: string (nullable = true)
|    |-- user_mentions: array (nullable = true)
|    |    |-- element: struct (containsNull = true)
|    |    |    |-- id: long (nullable = true)
|    |    |    |-- id_str: string (nullable = true)
|    |    |    |-- indices: array (nullable = true)
|    |    |    |    |-- element: long (containsNull = true)
|    |    |    |-- name: string (nullable = true)
|    |    |    |-- screen_name: string (nullable = true)
|-- source: string (nullable = true)
|-- text: string (nullable = true)
|-- timestamp_ms: string (nullable = true)
|-- truncated: boolean (nullable = true)
|-- user: struct (nullable = true)
|    |-- followers_count: long (nullable = true)
|    |-- following: string (nullable = true)
|    |-- friends_count: long (nullable = true)
|    |-- name: string (nullable = true)
|    |-- screen_name: string (nullable = true)
So what to do if the inbound streaming data is in nested-JSON format? It seems to me the only option is to pre-process it to flatten it. There are a variety of tools that could be used here - in the first instance I’d generally reach for Logstash, it being the one I’m most familiar with. To get an idea of the schema of a JSON record you can use jsonschema.net. Funnily enough when I was researching this blog post I came across the exact same problem on a forum posted by … me! Early last year I was working with the same dataset, and had the same issue with embedded arrays. The way to do it in Logstash is with a bit of Ruby code to flatten the arrays, and a standard mutate to bring nested objects up to the root level. Sample code:
mutate {
    add_field => { "user_name" => "%{[user][name]}" }
    add_field => { "user_screen_name" => "%{[user][screen_name]}" }
}
ruby {
    code => 'event["hashtags_array"] = event["[entities][hashtags]"].collect { |m| m["text"] } unless event["[entities][hashtags]"].nil?
             event["hashtags_list"] = event["hashtags_array"].join(",")  unless event["[hashtags_array]"].nil?'
}
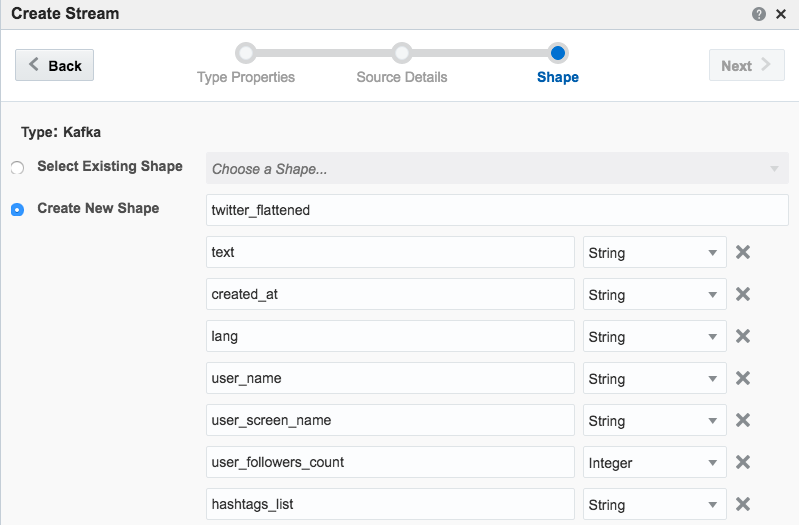
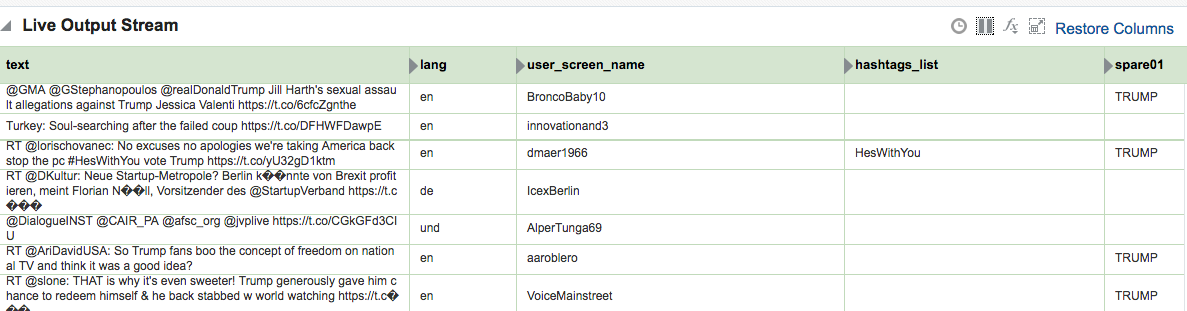
You can find the full Logstash code on gist here. With this logstash code running I set up a new OSA Stream pointing to the new Kafka topic that Logstash was writing, and added the flattened fields to the Shape:
Other Shape Gotchas
One of the fields in Twitter data is ‘source’ - which unfortunately is a reserved identifier in the CQL language that OSA uses behind the scenes.
Caused By: org.springframework.beans.FatalBeanException: Exception initializing channel; nested exception is com.bea.wlevs.ede.api.ConfigurationException: Event type [sx-10-16-Kafka_Technology_Tweets_JSON-1] of channel [channel] uses invalid or reserved CQL identifier = , sourceIt’s not clear how to define a shape in which the source data field is named after a reserved identifier.
Further Exploration of Twitter Streams with OSA
Using the flattened Twitter stream coming via Kafka that I demonstrated above, let’s now look at more OSA functionality.
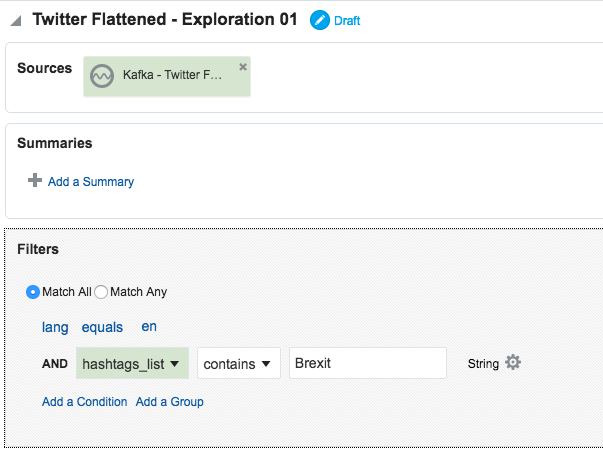
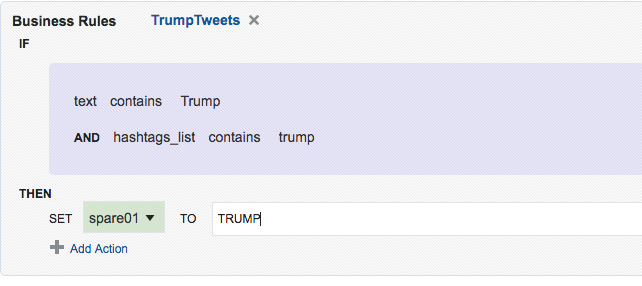
Depending on the source of your data stream, and your purpose for analysing it, you may well want to filter out certain content. This can be done from the Exploration screen:
Kafka Stream Transformation with OSA
Here we’ll see how OSA can be used to ingest one Kafka topic, apply a transformation, and stream it to another Kafka topic.
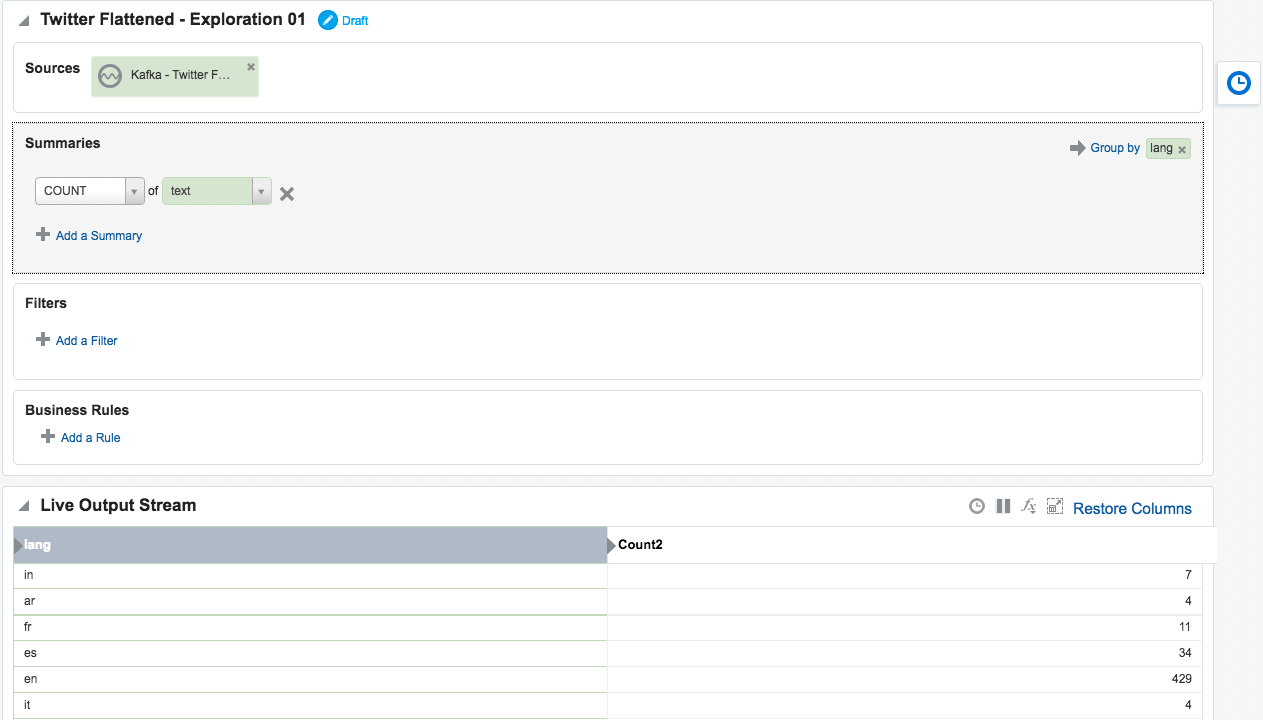
The OSA exploration screen offers a basic aggregation (‘summary’) function, here showing the number of tweets per language:
Taking the summarised stream (count of tweets, by language) I first Publish the exploration, making it available for use as the input to a subsequent exploration. Then from the Catalog page select a Pattern, which I’m going to use to build a stream showing the most common languages in the past five seconds. With the Top N pattern you specify the event stream (in this case, the summarised stream that I built above), and the metric by which to order the events which here is the count of tweets per language.
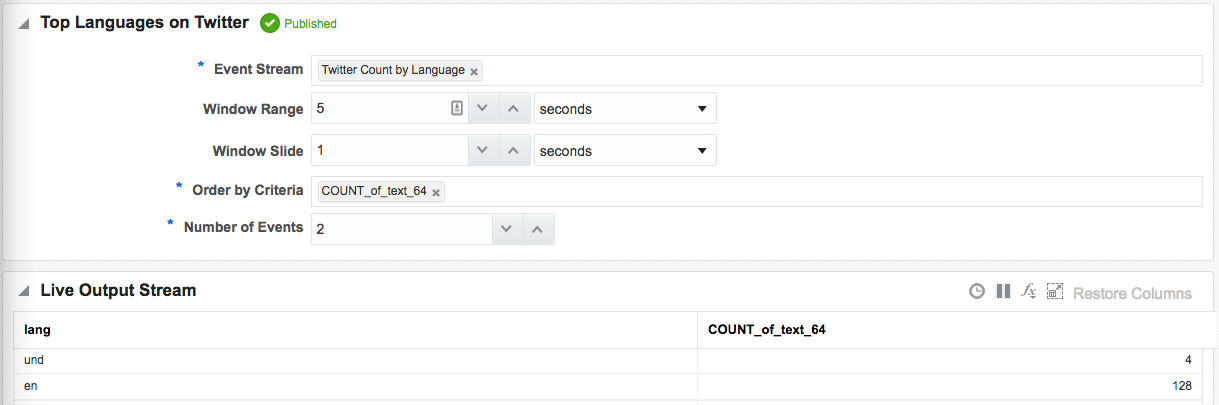
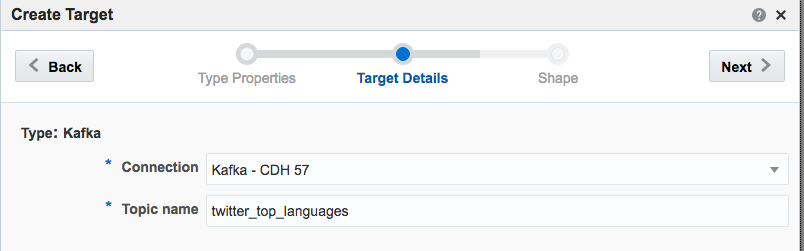
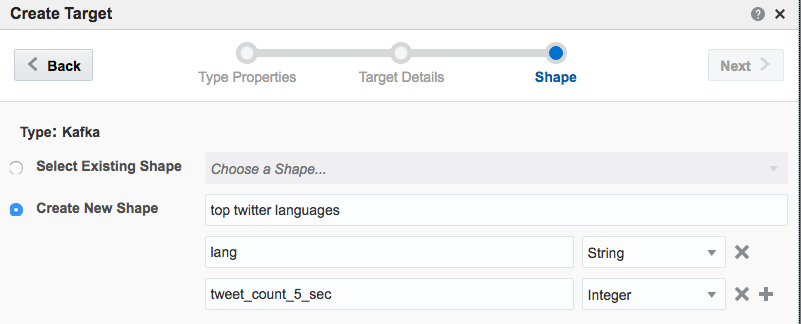
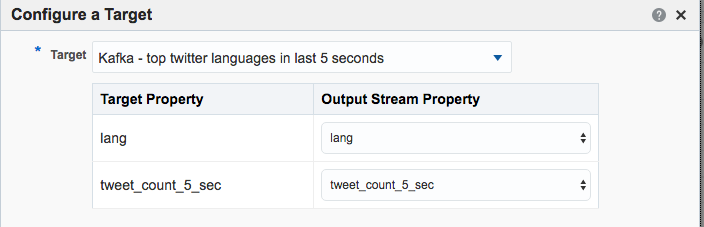
Note that I’ve defined a new Shape here based on the columns in the pattern. In the pattern itself I renamed the COUNT column to a clearer one (tweet_count_5_sec). Renaming it wasn’t strictly necessary since it’s possible to define the field/shape mapping when you configure the Target:
kafka-console-consumer can see the topic being populated in realtime by OSA:
OSA and Spatial
One of the Patterns that OSA provides is a Spatial one, which can be used to analyse source data that includes geo-location data. This could be to simply plot the occurrence of the data point (as we'll see shortly) on a map. It can also be used in a more sophisticated manner, to track a given entity's movements on a map. An example of this could be a fleet of trucks reporting their position back at regular intervals. Areas on a map can be defined and conditions triggered as the entity enters or leaves the area. For now though, we'll keep it simple. Using the flattened Twitter stream from Kafka that I produced from Logstash above, I'm going to plot Tweets in realtime on a map, along with a very simplistic tagging of the broad area in which they came from.
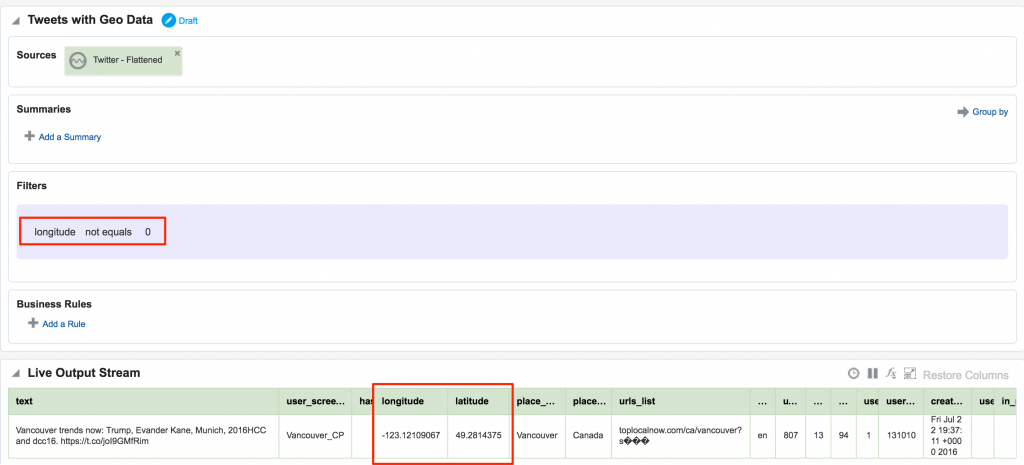
In my source Kafka topic I have two fields, latitude and longitude. I expose these as part of the 'flattening' of the JSON in this logstash script, since by default they're nested within the coordinates field and as an array too. When defining the Stream's Shape make sure you define the datatype correctly (Double) - OSA is not very forgiving of stupidity and I spent a frustrating time trying to work out why "-80.1422195" was coming through as zero - obviously defined as an Integer this was never going to work!
Not entirely necessary, but useful for debug purposes, I setup an exploration based on the flattened Twitter stream, with a filter to only include tweets that had geo-location data in them. This way I knew what tweets I should expect to be seeing in the next step. One of the things that I have found with OSA is that it has a tendency to fail silently; instead of throwing errors you'll just not get any data. By setting up the filter exploration I could at least debug things a bit more easily.
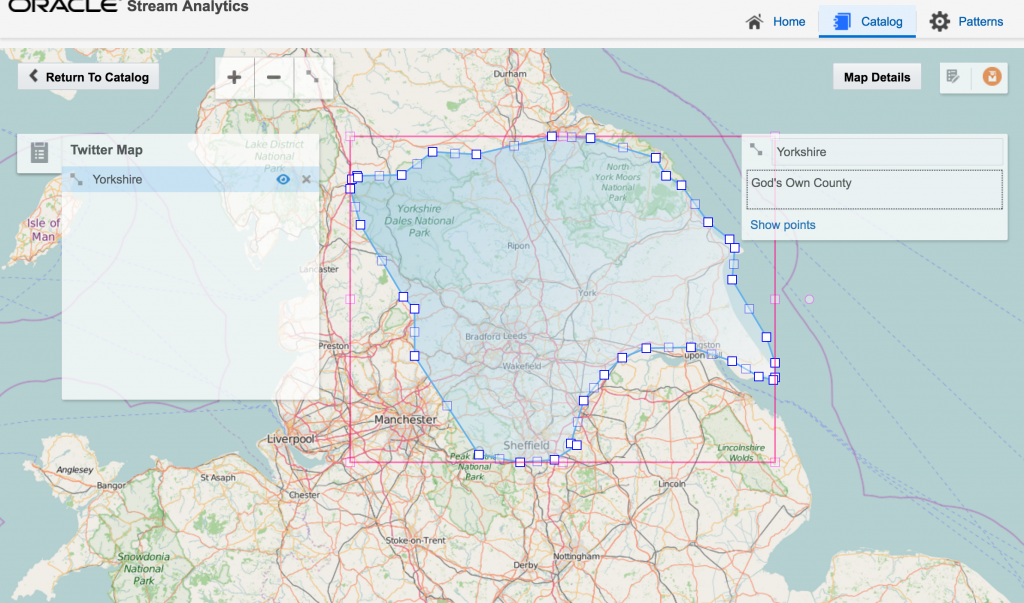
After this I created a new object, a Map. A Map object defines a set of named areas, which could be sourced from a database table, or drawn manually - which is what I did here by setting the Map Type to 'None (Create Manually)'. One thing to note about the maps is that they're sourced online (openstreetmap.org) so you'll need an internet connection to do this. Once the Map is open, click the Polygon Tool icon and click-drag a shape around the area that you want to "geo-fence". Each area is given a name, and this is what is used in the streaming data to label the event's geographical area.
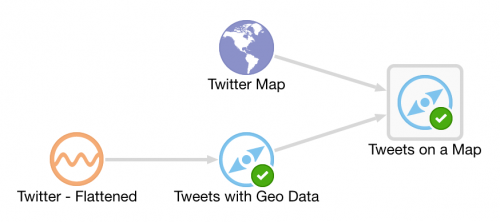
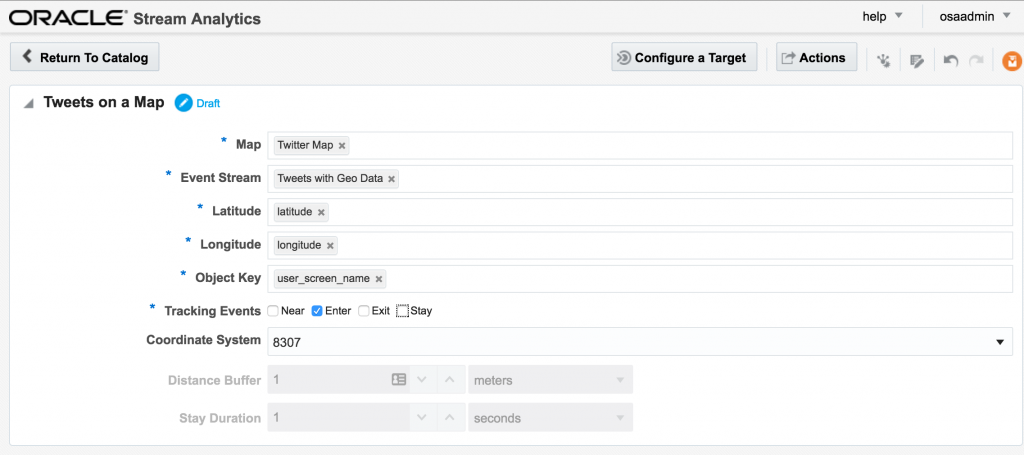
Having got our source data stream with geo-data in, and a Map on which to plot it and analyse the location of each event, we now use the Spatial General pattern to create an Exploration. The topology looks like this:
The fields in the Spatial General pattern are all pretty obvious. Object key is the field to use to track the same entity across multiple events, if you want to use the enter/exit/stay statuses. For tweets we just use 'Enter', but for people or vehicles, for example, you might get multiple status reports and want to track them on a map. For example, when a person is near a point of interest that you're tracking, or a vehicle has remained in a set area for too long.
If you let the Exploration now run, depending on the rate of event ingest, you'll sooner or later see points appearing on the map and event details underneath. The "status" column is populated (blank if the event is outside of the defined geo-fences), as is the "Place", based on the geo-fence names that you defined.
Summary
I can see OSA being used in two ways. The first as an ‘endpoint’ for streams with users taking actions based on the data, with some of the use cases listed here. The second is for prototyping transformations and analyses on streams prior to productionising them. The visual interface and immediacy of feedback on transformations applied means that users can quickly understand what further processing they may want to apply to the stream using actual streaming data to inform this.
This latter concept - that of prototyping - is similar to that which we see with another of Oracle’s products, Big Data Discovery. With BDD users can analyse data in the organisation’s data reservoir, as well as apply transformations to it (read more). Just as BDD doesn’t replace OBIEE or Visual Analyzer but enables users to understand how they do want to model the data in these tools, OSA wouldn’t replace “production grade” integration done by Oracle Data Integrator. What it would do is allow users to get a clearer idea of the transformations they would want performed in it.
OSA's user interface is easy to use and intuitive, and this is definitely a tool that you would put in front of technically minded business users. There are limitations to what can be achieved technically through the web GUI alone and something like Oracle Data Integrator (ODI) would still be a more appropriate fit for complex streaming work. At Oracle Open World last year it was announced (slides) that a beta would be starting for ODI using Spark Streaming for ETL and stream processing, so it'll be interesting to see this when it comes out.
Further Reading
- Providing Oracle Stream Analytics 12c environment using Docker, by Guido Schmutz
- Real-Time Data Streaming & Exploration with Oracle GoldenGate & Oracle Stream Analytics, by Issam Hijazi
- Demonstration of Oracle Stream Explorer for live device monitoring – collect, filter, aggregate, pattern match, enrich and publish by Lucas Jellema
- OTN OSA home page
- Documentation index