Unify: Could it be any easier?

Rittman Mead’s Unify is the easiest and most efficient method to pull your OBIEE reporting data directly into your local Tableau environment. No longer will you have to worry about database connection credentials, Excel exports, or any other roundabout way to get your data where you need it to be.
Unify leverages OBIEE’s existing metadata layer to provide quick access to your curated data through a standard Tableau Web Data Connector. After a short installation and configuration process, you can be building Tableau workbooks from your OBIEE data in minutes.
This blog post will demonstrate how intuitive and easy it is to use the Unify application. We will only cover using Unify and it’s features, as once the data gets into Tableau it can be used the same as any other Tableau Data Source. The environment shown already has Unify installed and configured, so we can jump right in and start using the tool immediately.
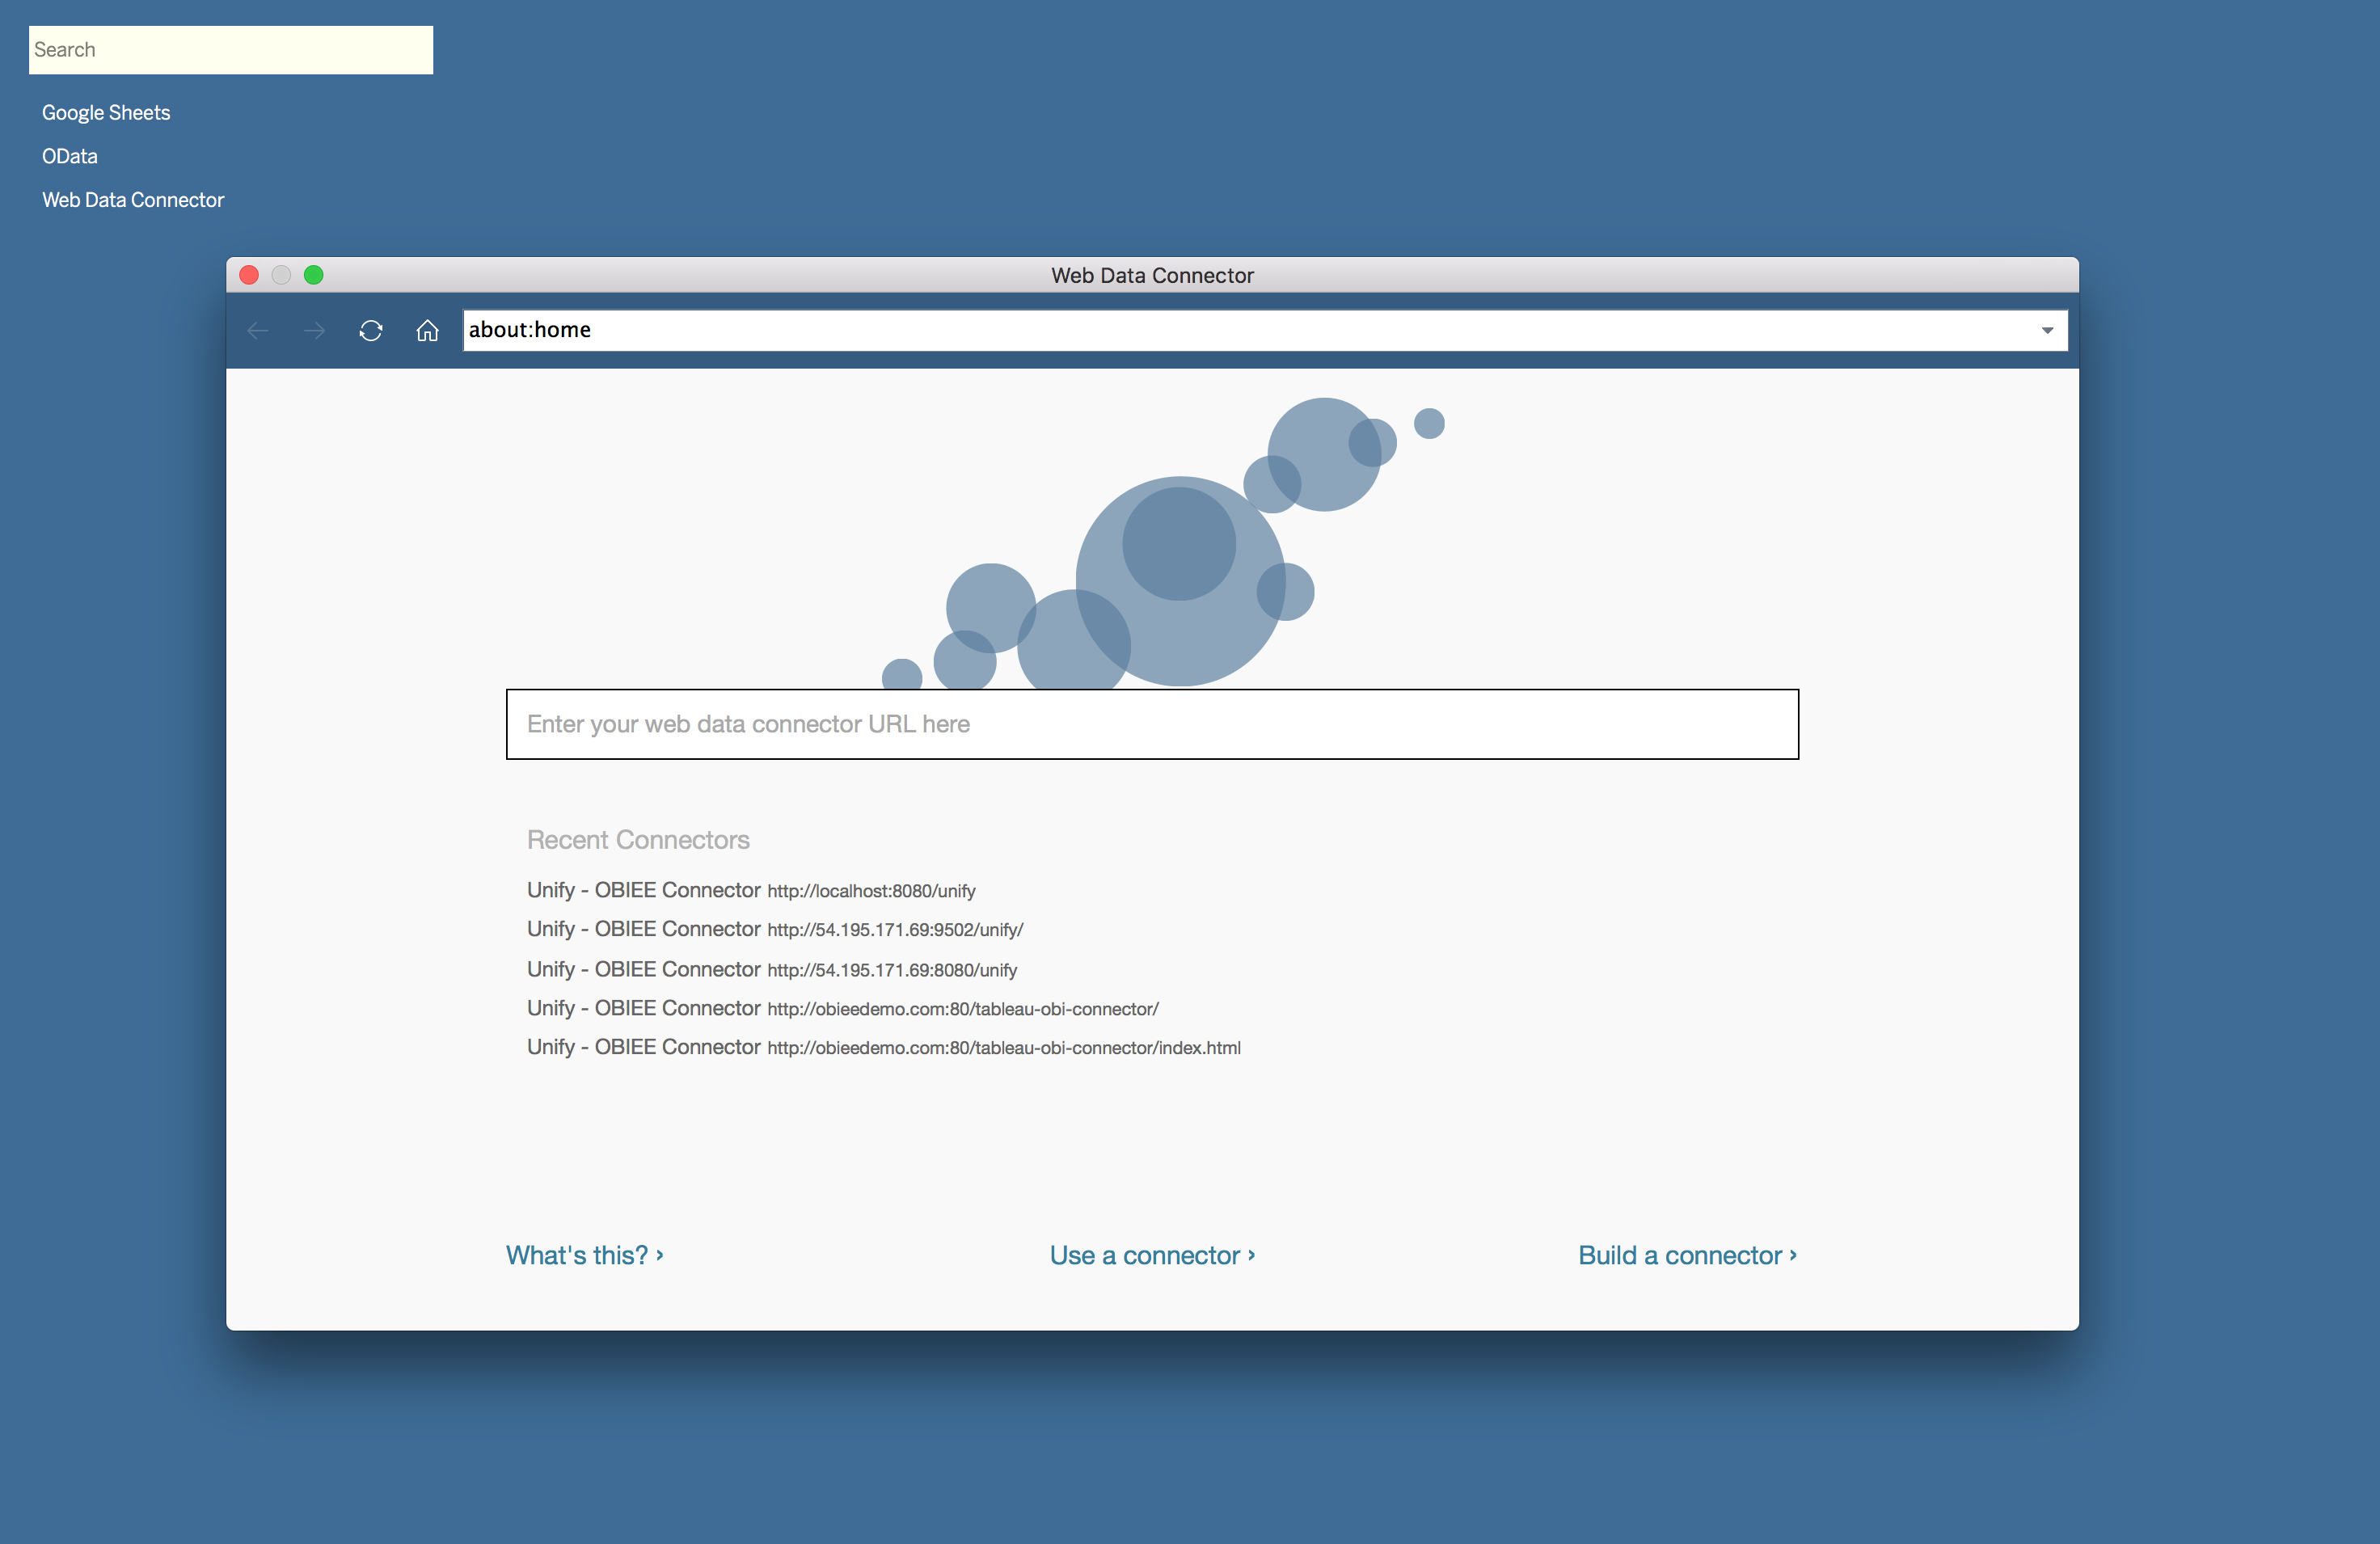
To start pulling data from OBIEE using Unify, we need to create a new Web Data Connector Data Source in Tableau. This data source will prompt us for a URL to access Unify. In this instance, Unify is installed as a desktop application, so the URL is http://localhost:8080/unify.
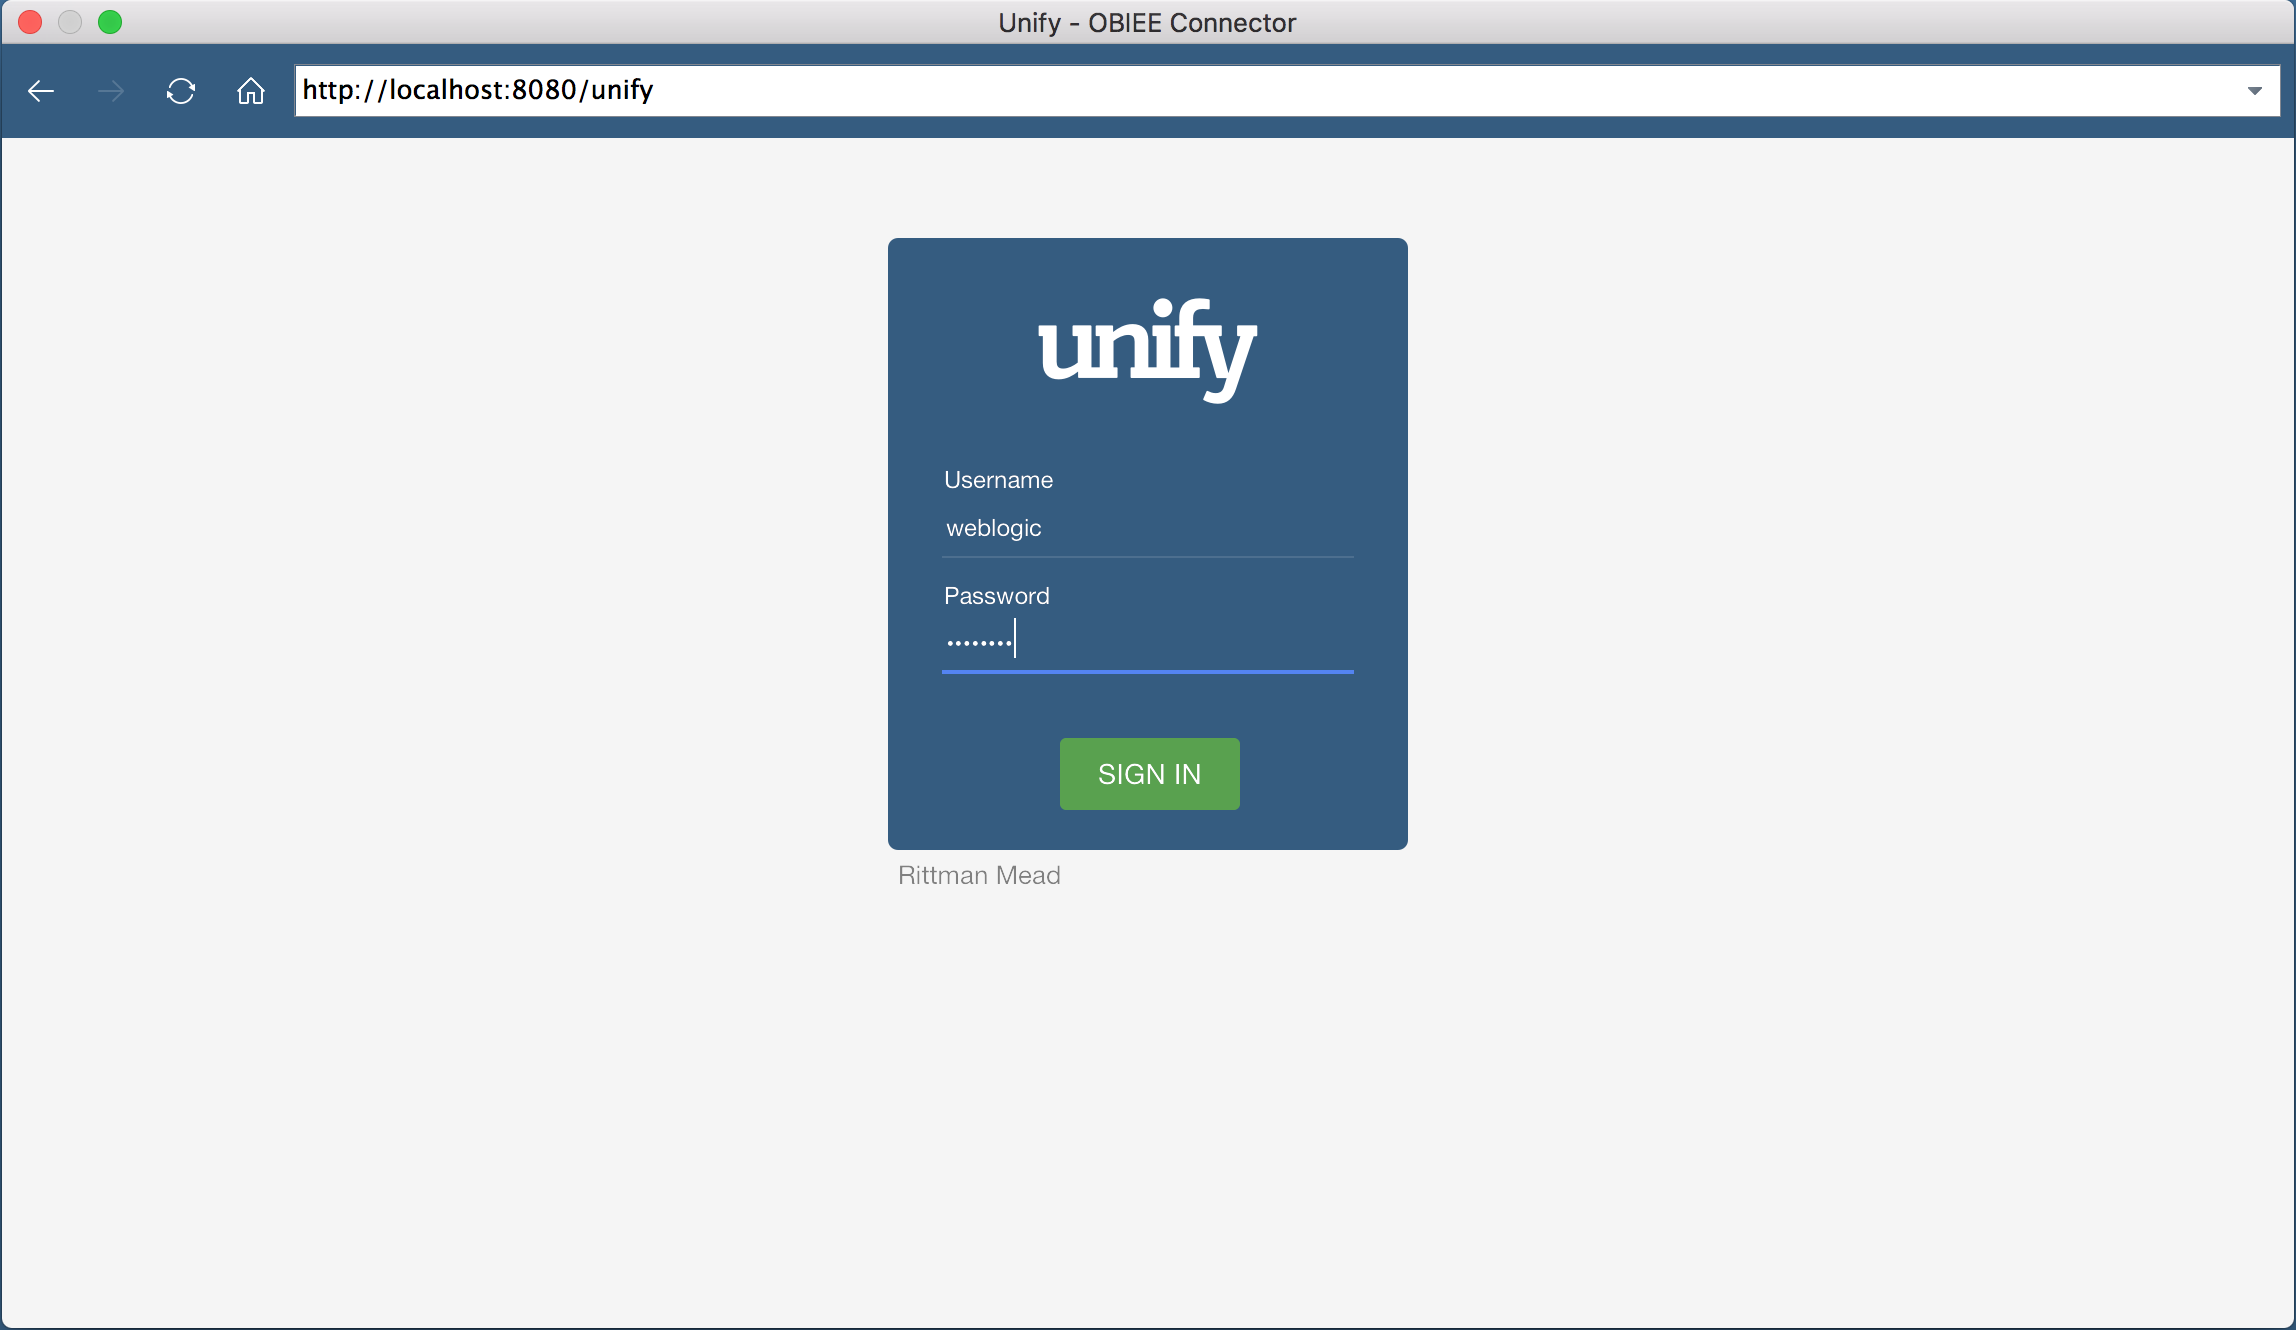
Once we put in the URL, we’re shown an authentication screen. This screen will allow us to authenticate against OBIEE using the same credentials. In this case, I will authenticate as the weblogic user.

Once authenticated, we are welcomed by a window where we can construct an OBIEE query visually. On the left hand side of the application, I can select the Subject Area I wish to query, and users are shown a list of tables and columns in the selected Subject Area. There are additional options along the top of the window, and I can see all saved queries on the right hand side of the window.
The center of the window is where we can see the current query, as well as a preview of the query results. Since I have not started building a query yet, this area is blank.
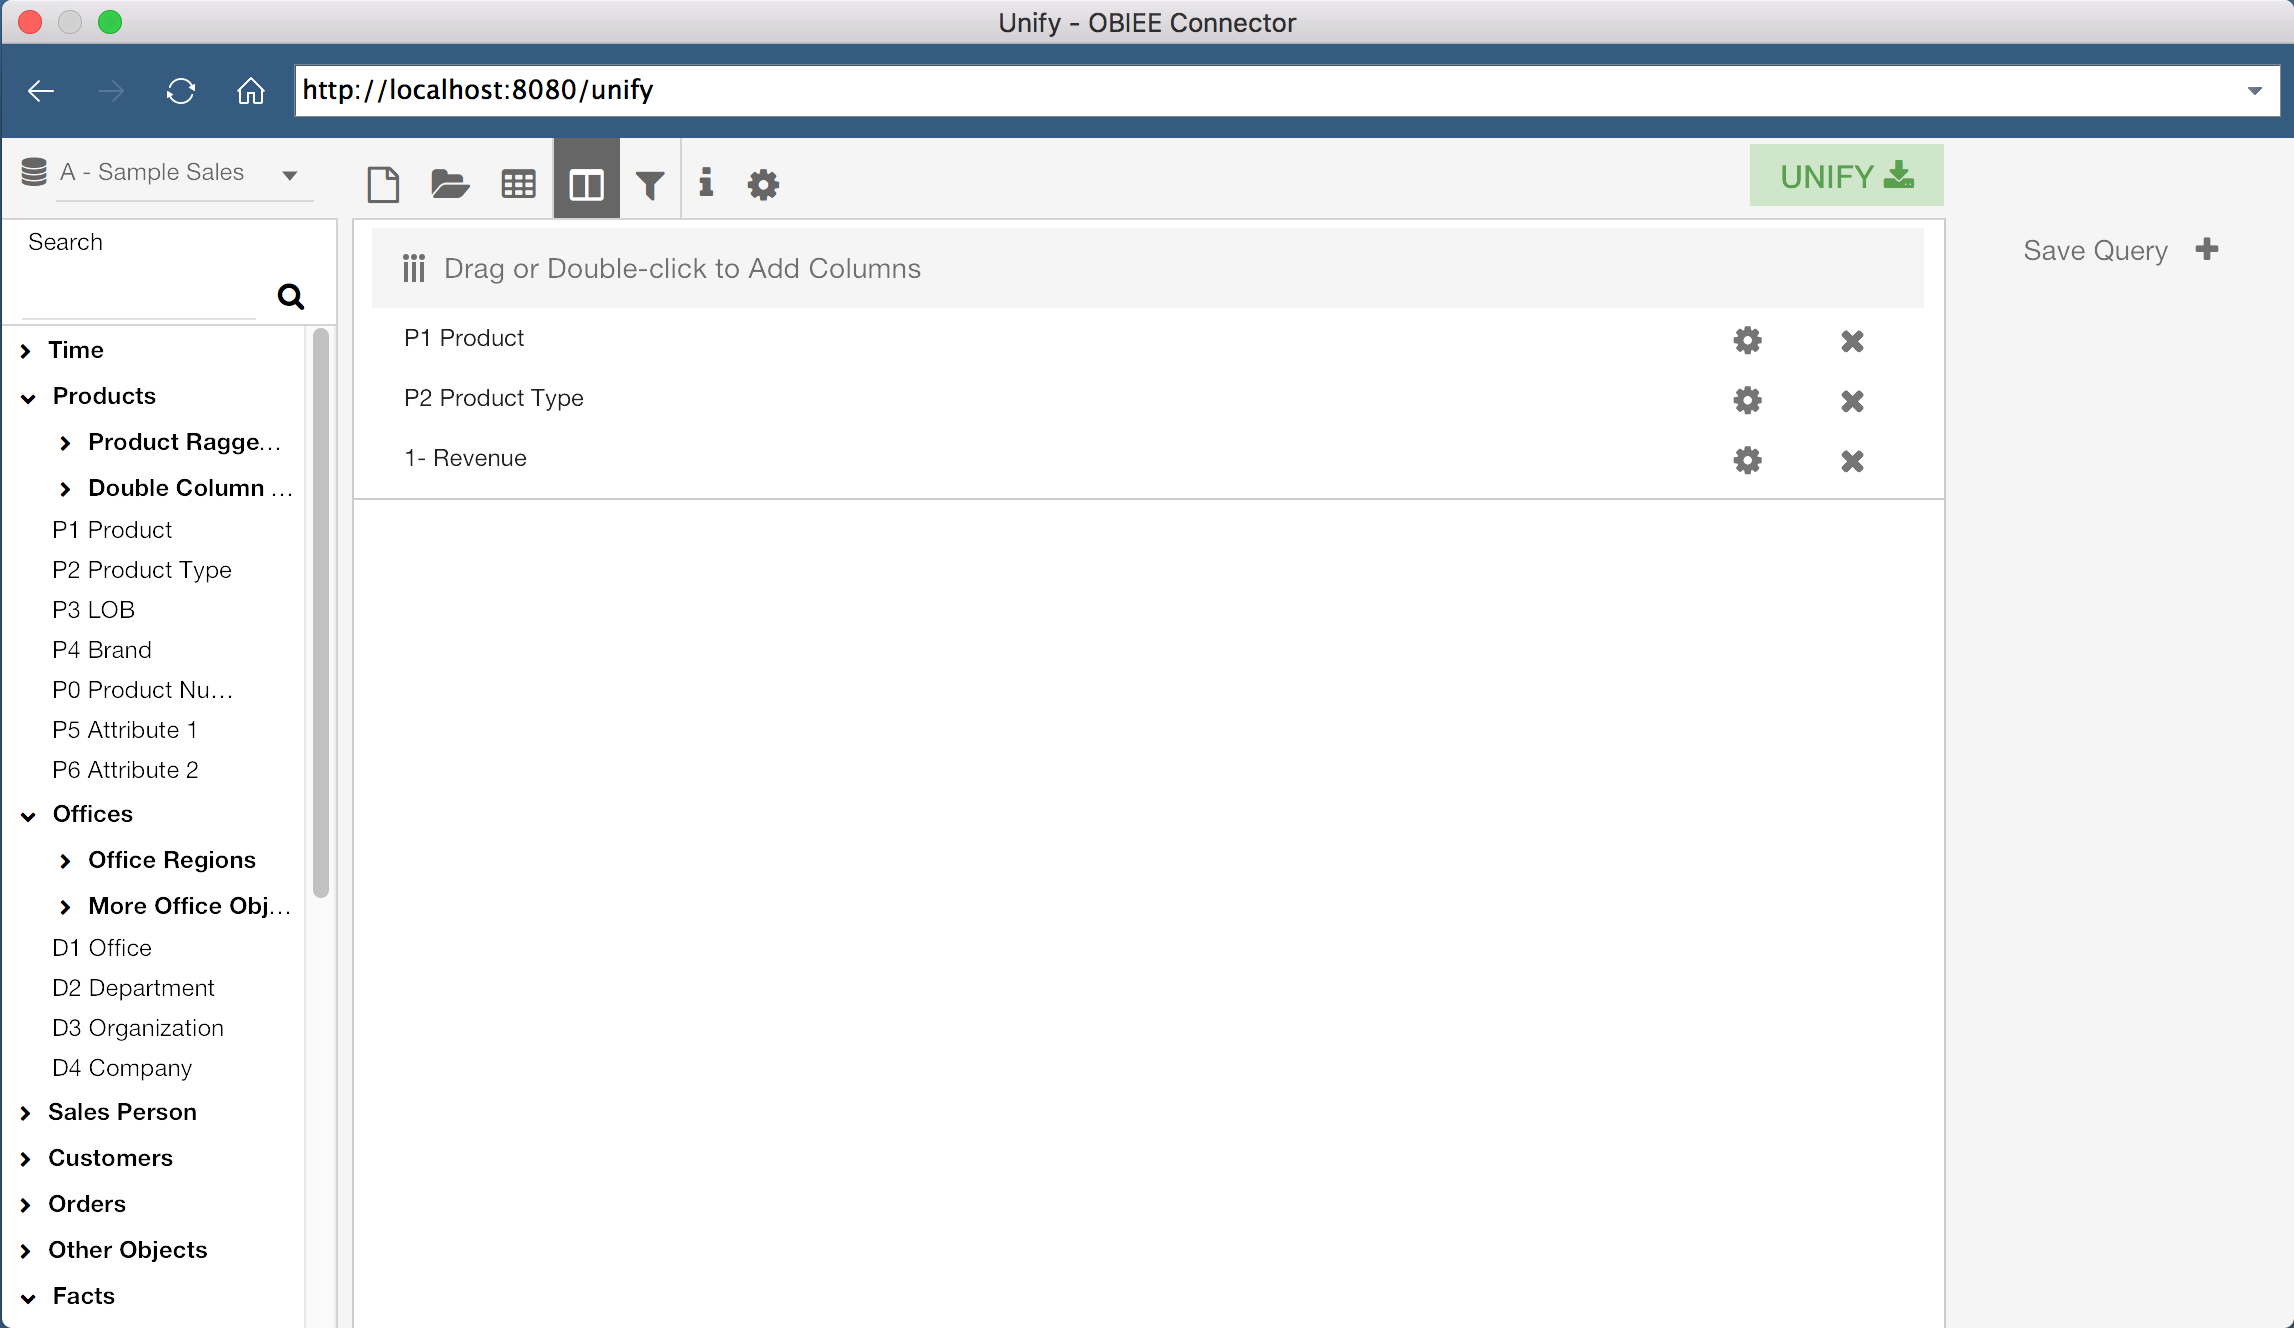
Unify allows us to either build a new query from scratch, or select an existing OBIEE report. First, let’s build our own query. The lefthand side of the screen displays the Subject Areas and Columns which I have access to in OBIEE. With a Subject Area selected, I can drag columns, or double click them, to add them to the current query. In the screenshot above, I have added three columns to my current query, “P1 Product”, “P2 Product Type”, and “1 - Revenue”.
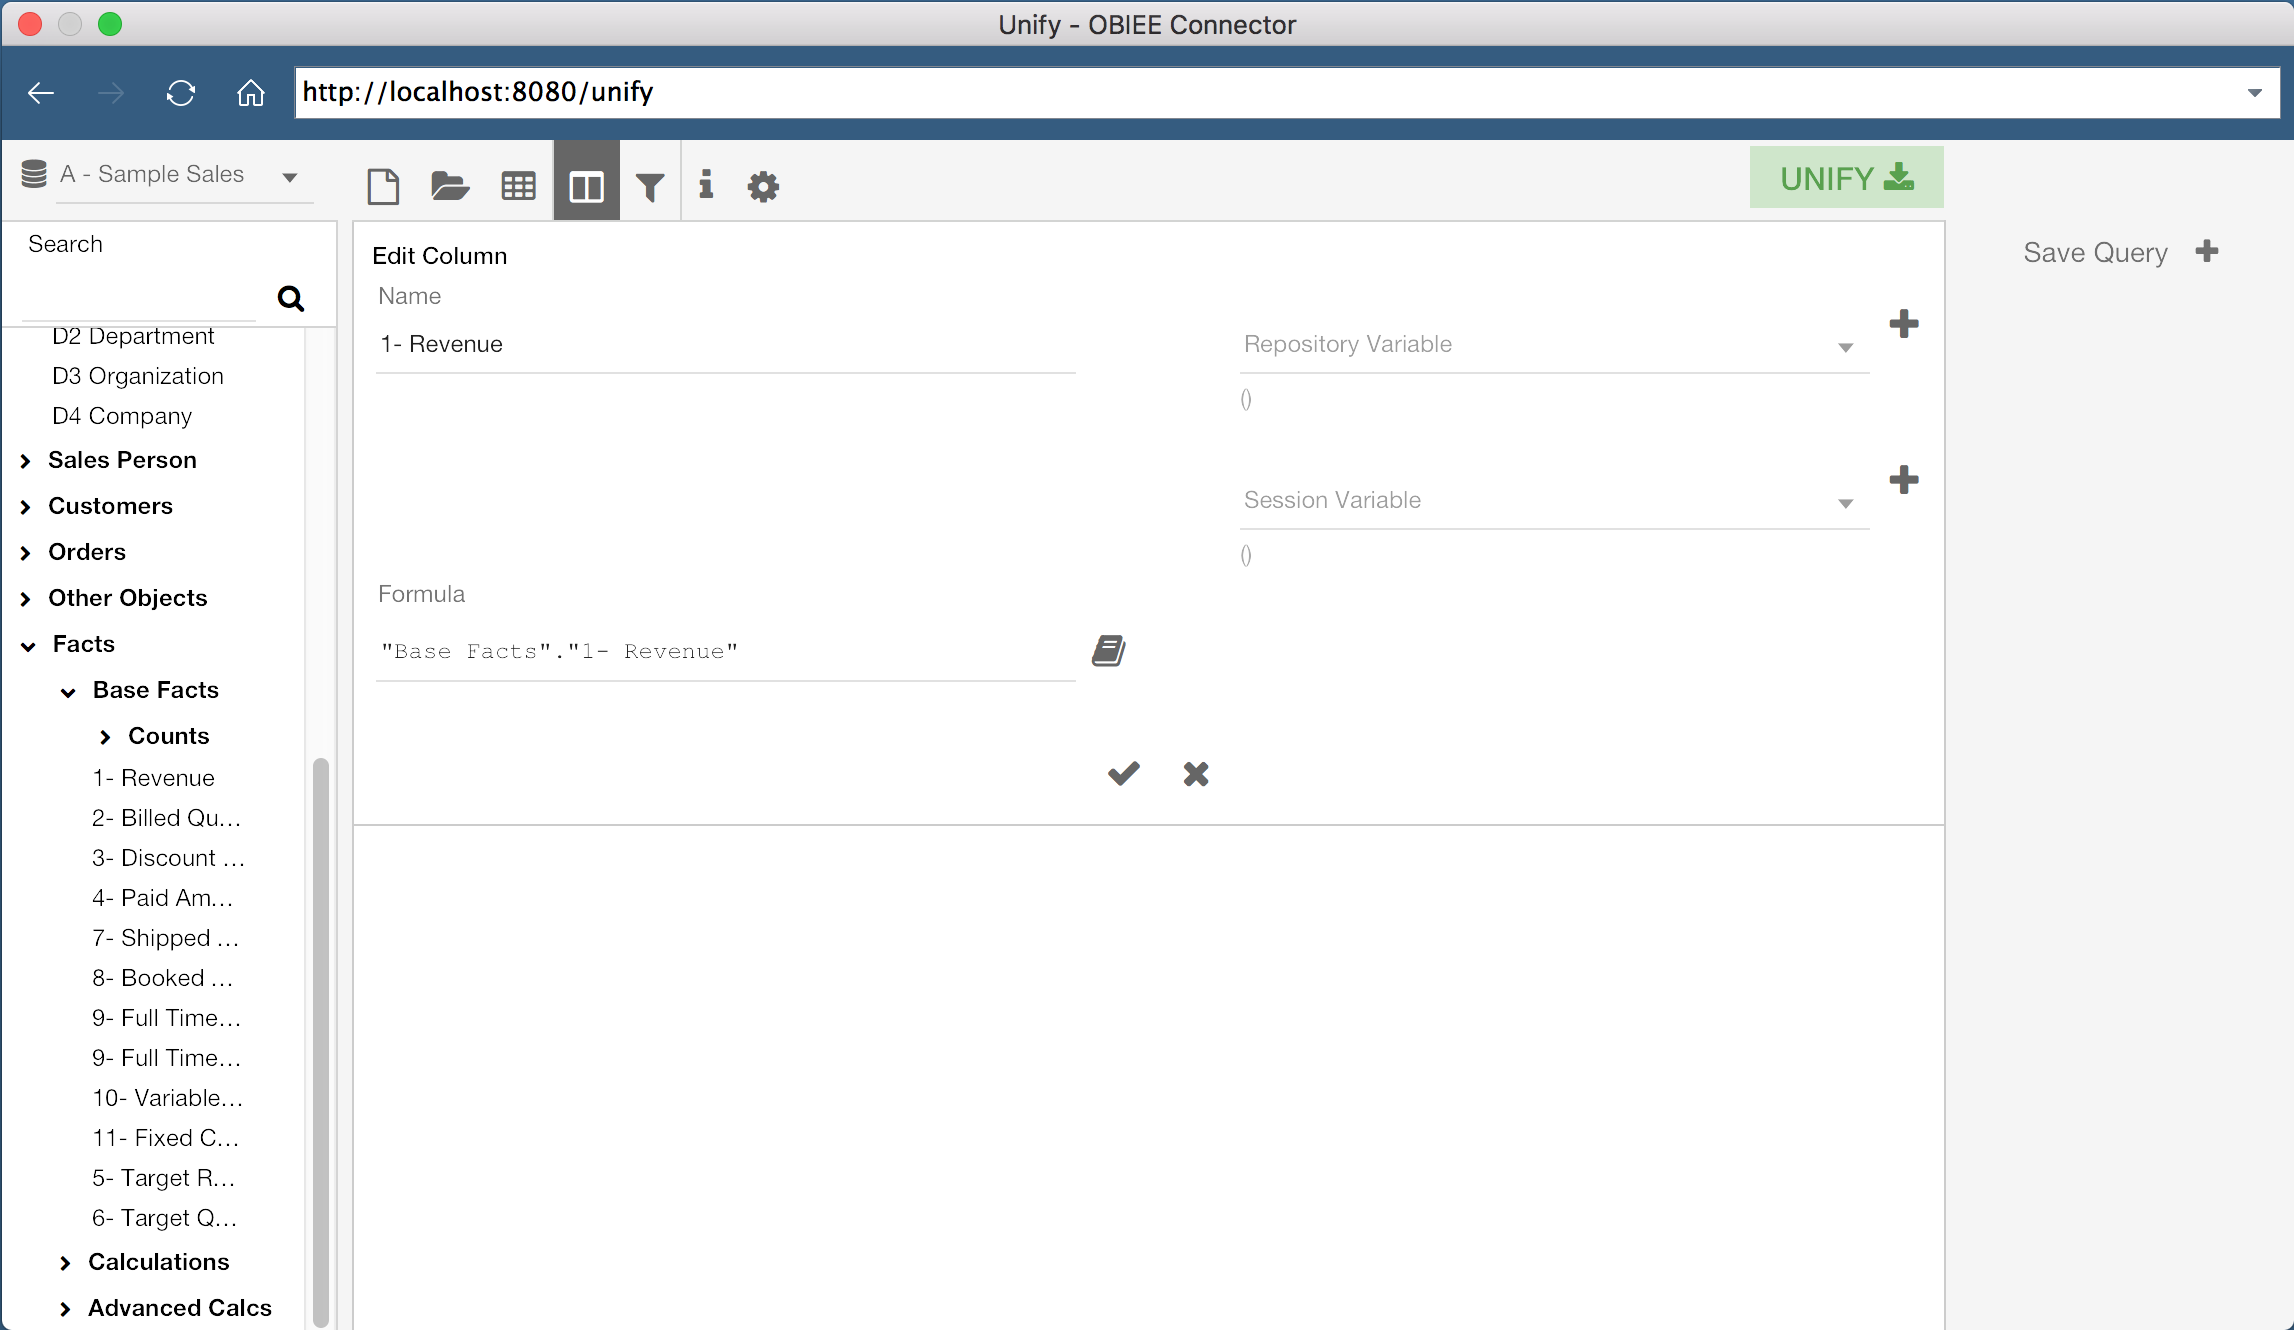
If we wanted to, we could also create new columns by defining a Column Name and Column Formula. We even have the ability to modify existing column formulas for our query. We can do this by clicking the gear icon for a specific column, or by double-clicking the grey bar at the top of the query window.
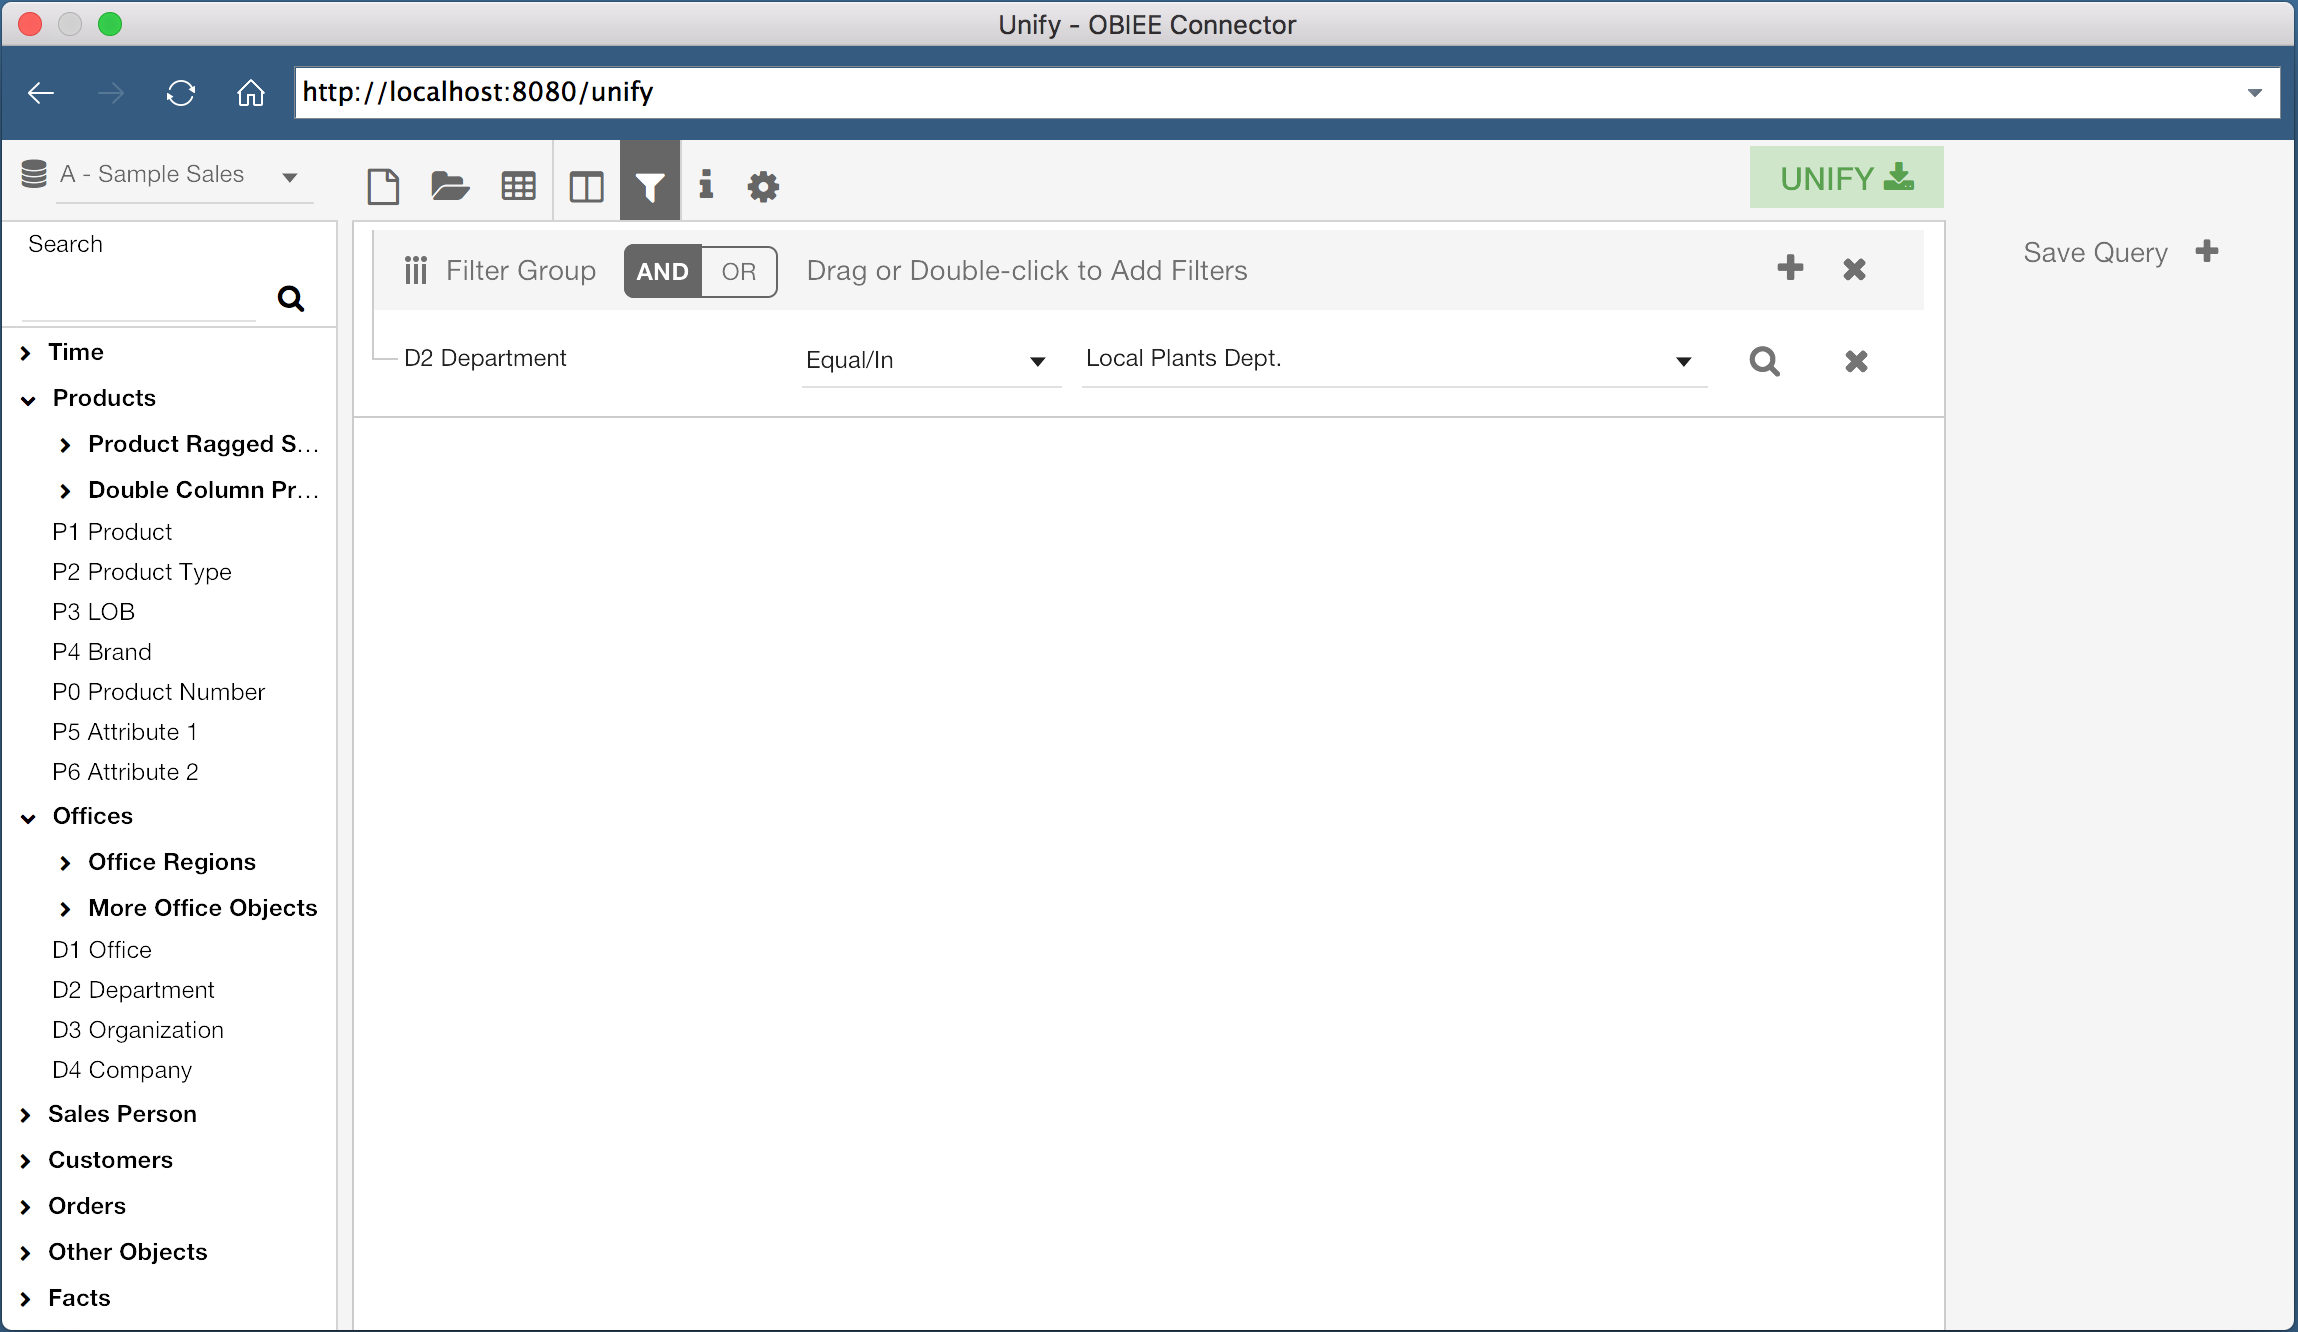
It’s also possible to add filters to our data set. By clicking the Filter icon at the top of the window, we can view the current filters for the query. We can then add filters the same way we would add columns, by double clicking or dragging the specific column. In the example shown, I have a query on the column “D2 Department” where the column value equals “Local Plants Dept.”.
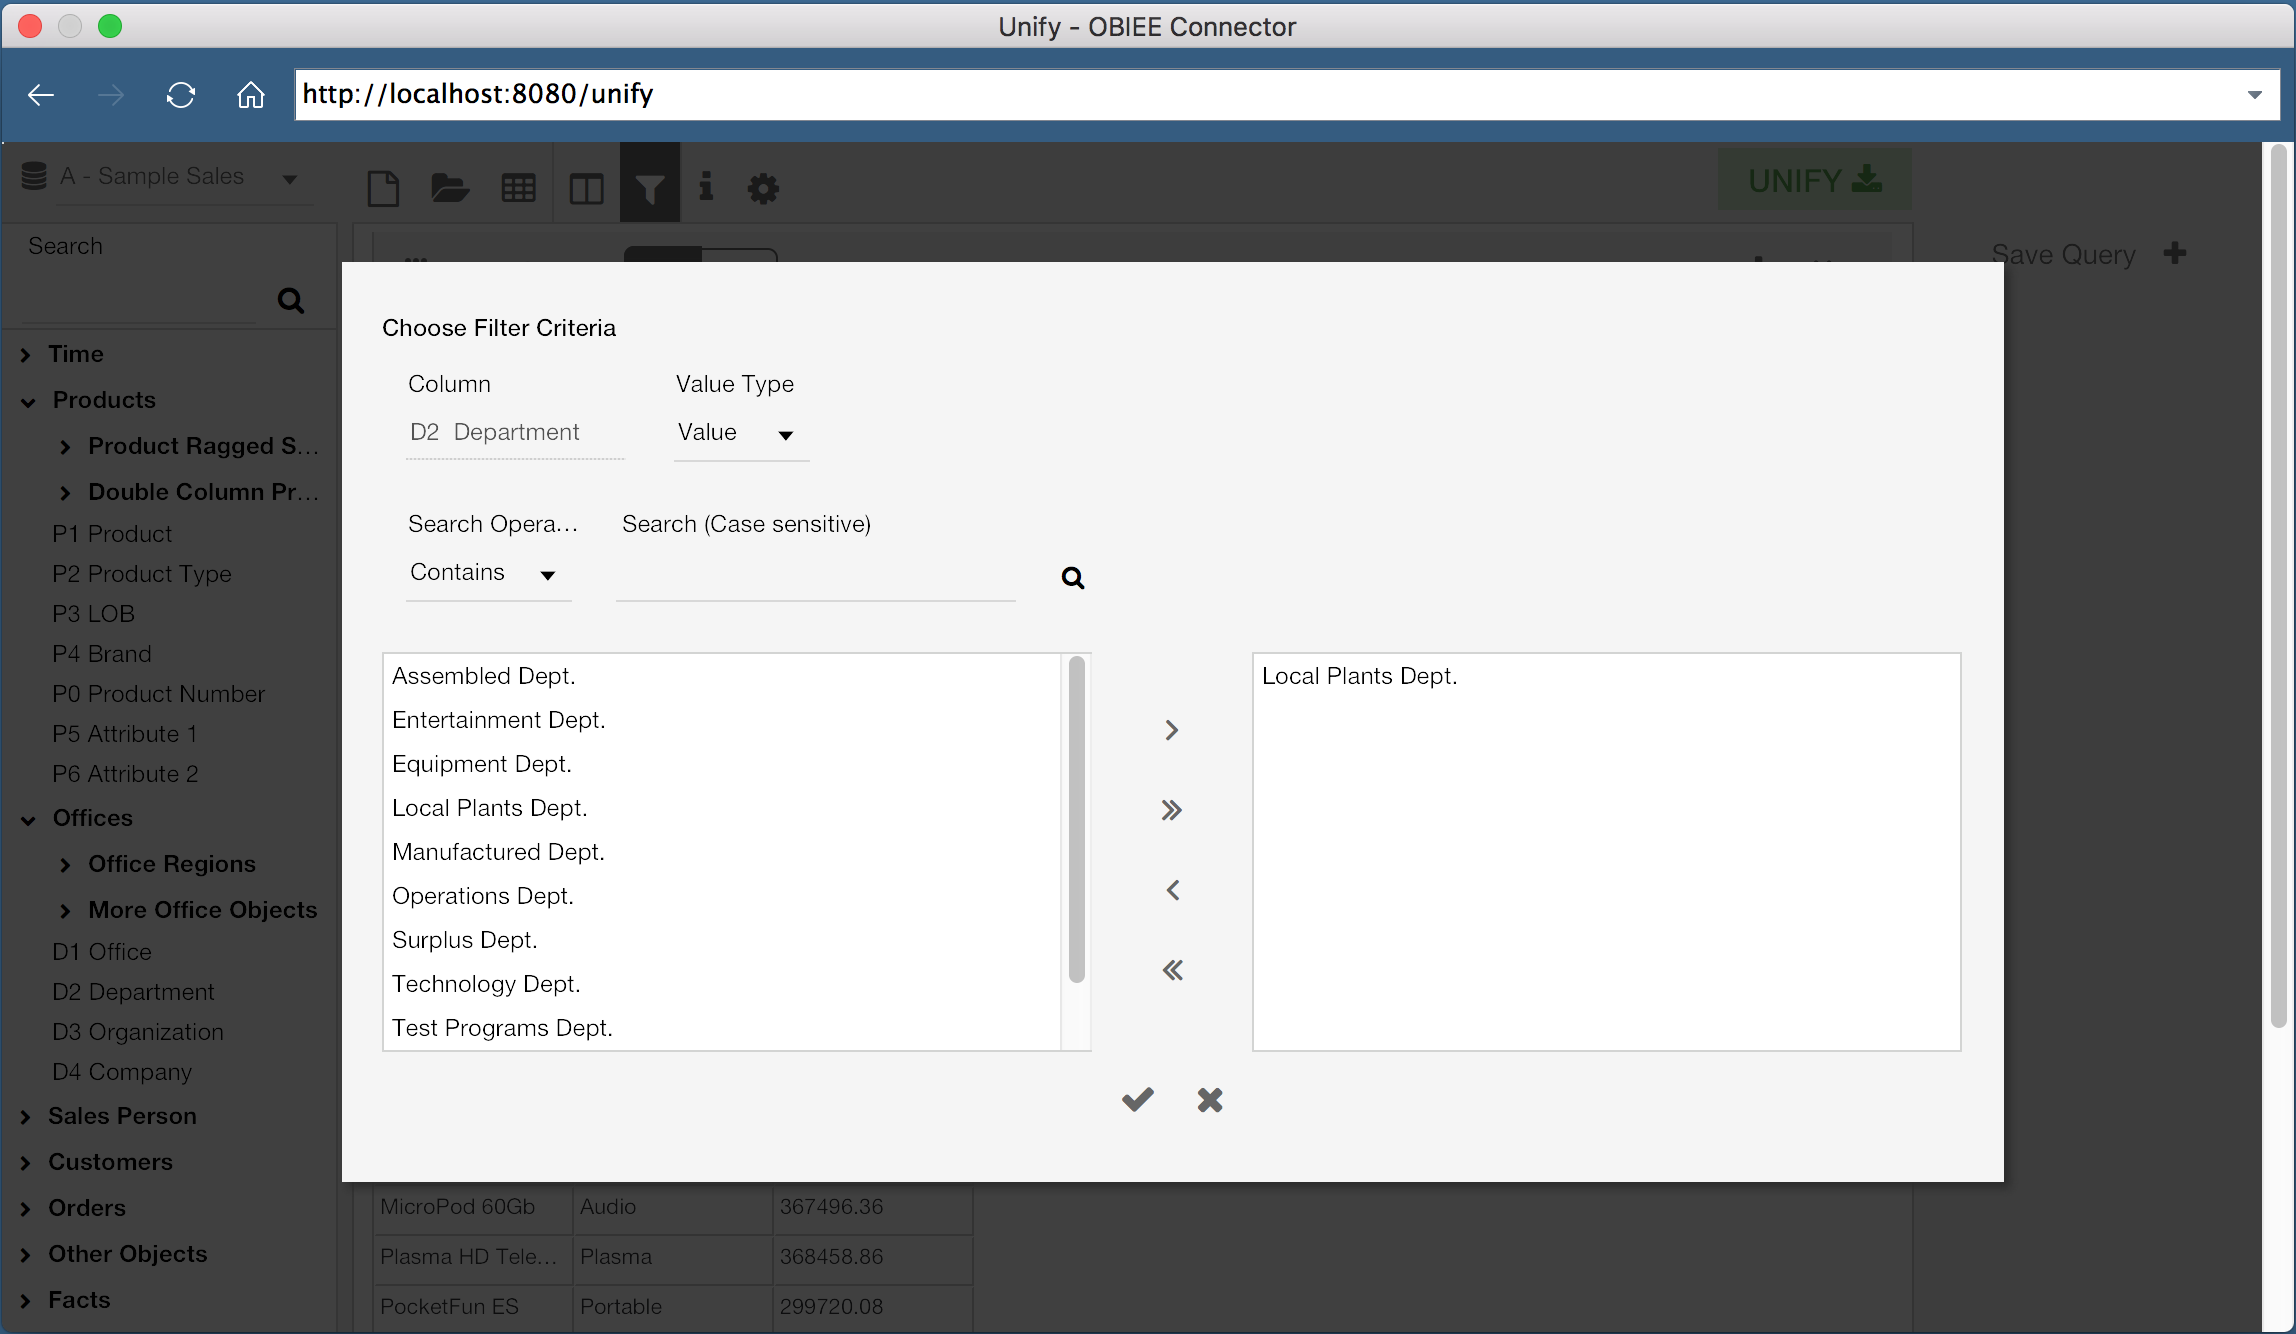
Filters can be configured using any of the familiar methods, such as checking if a value exists in a list of values, numerical comparisons, or even using repository or session variables.
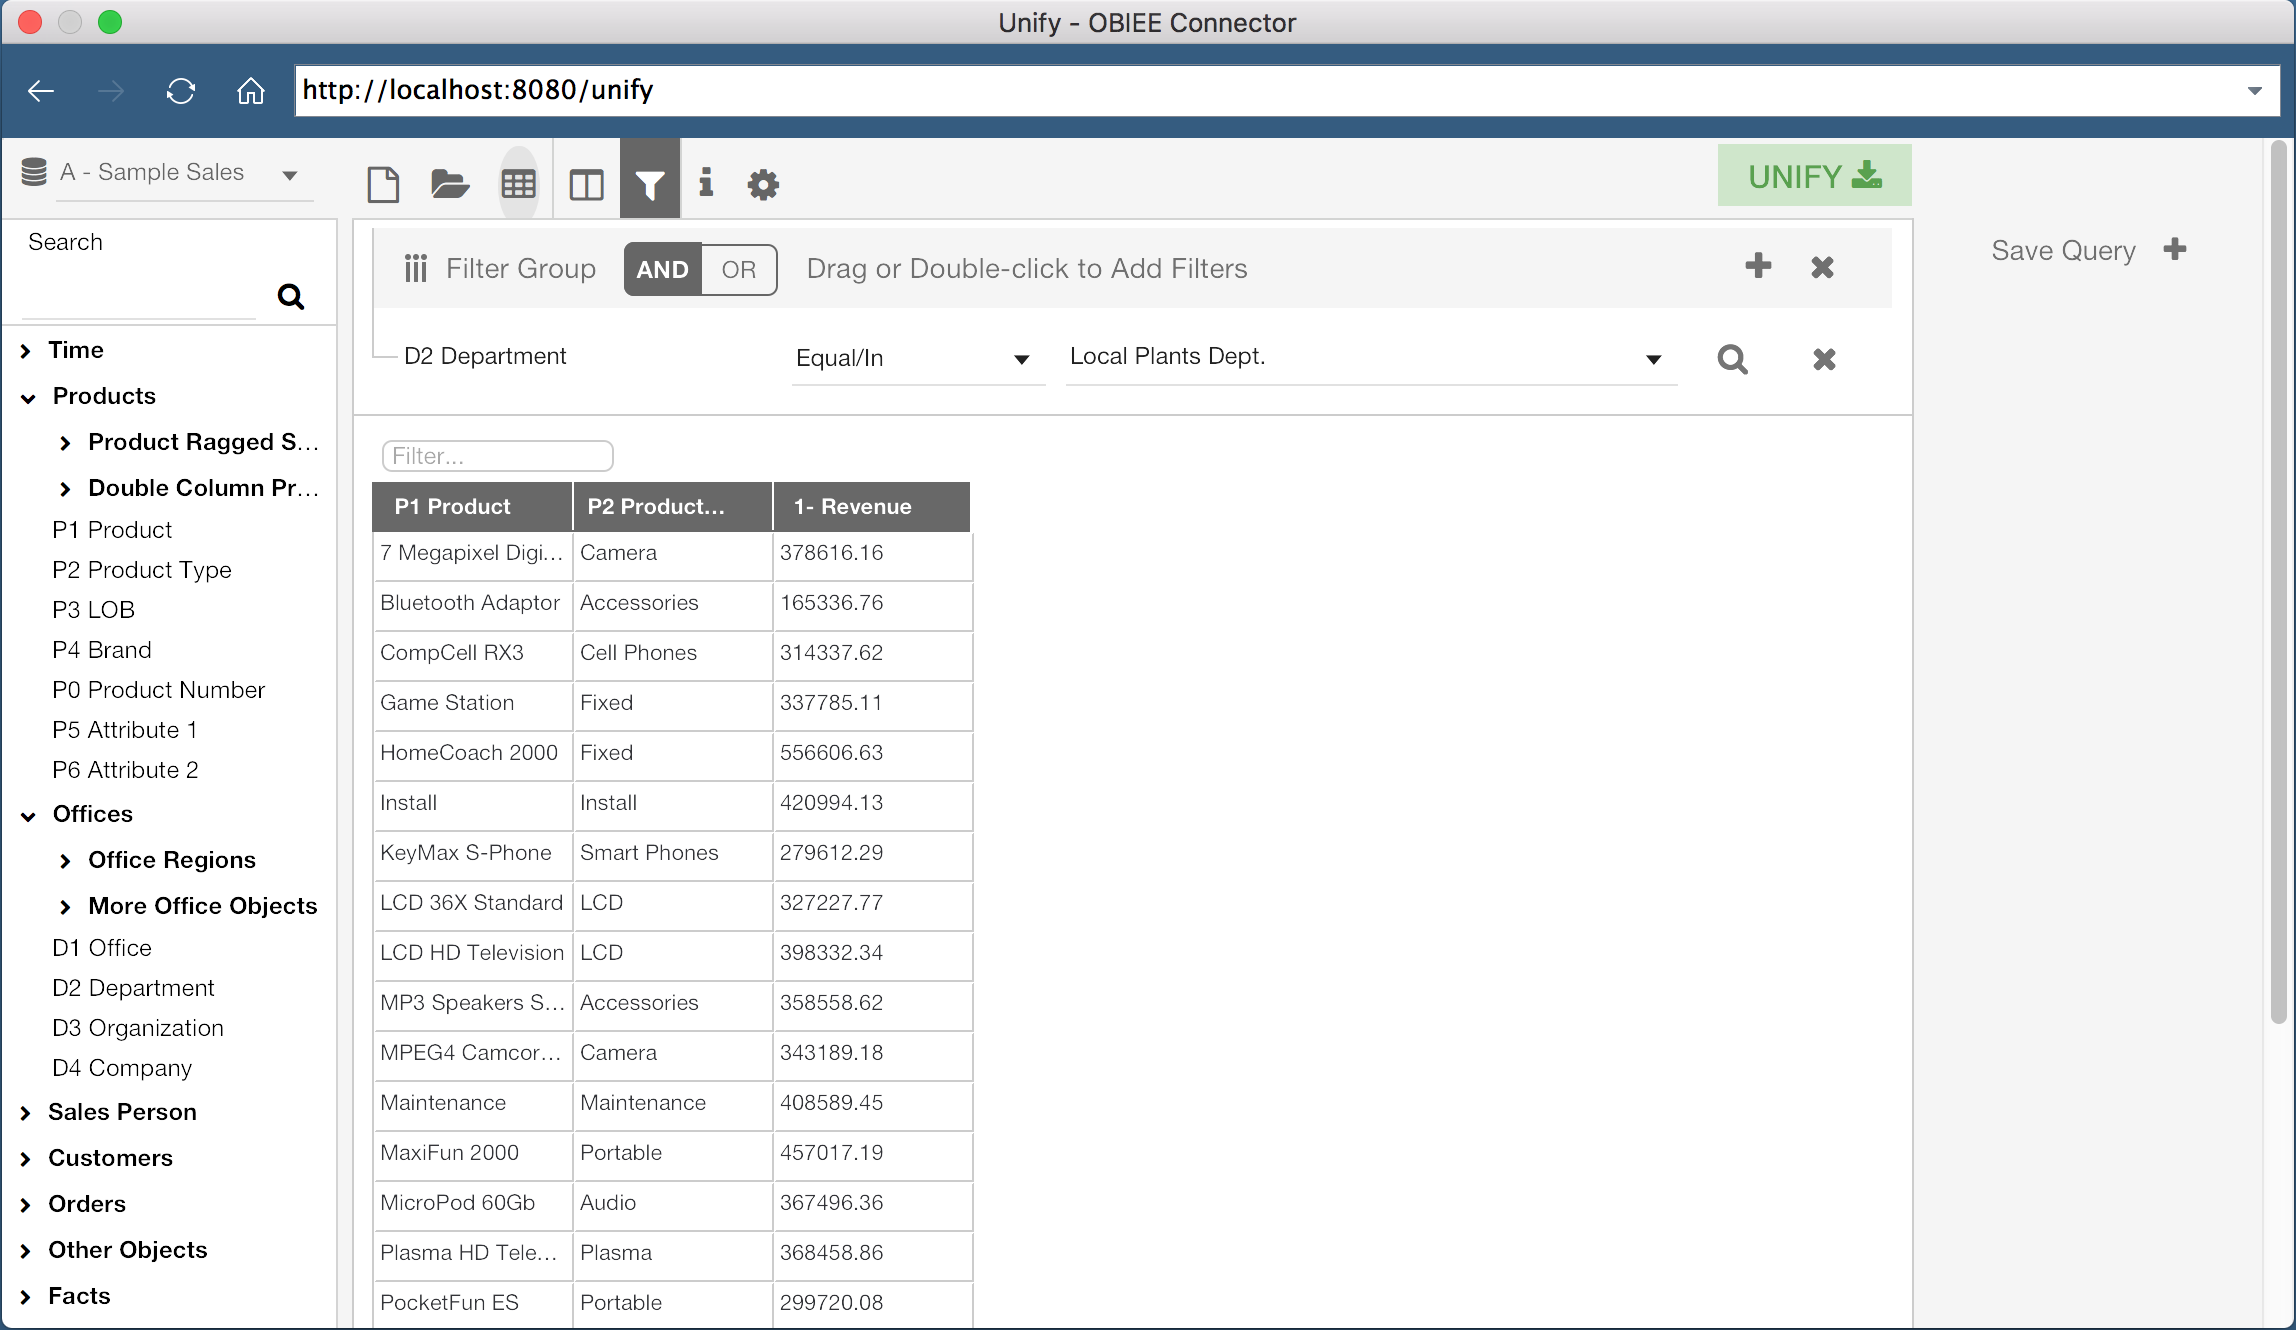
Now that we have our columns selected and our filters defined, we can execute this query and see a preview of the result set. By clicking the “Table” icon in the top header of the window, we can preview the result.
Once we are comfortable with the results of the query, we can export the results to Tableau. It is important to understand that the preview data is trimmed down to 500 rows by default, so don’t worry if you think something is missing! This value, and the export row limit, can be configured, but for now we can export the results using the green “Unify” button at the top right hand corner of the window.
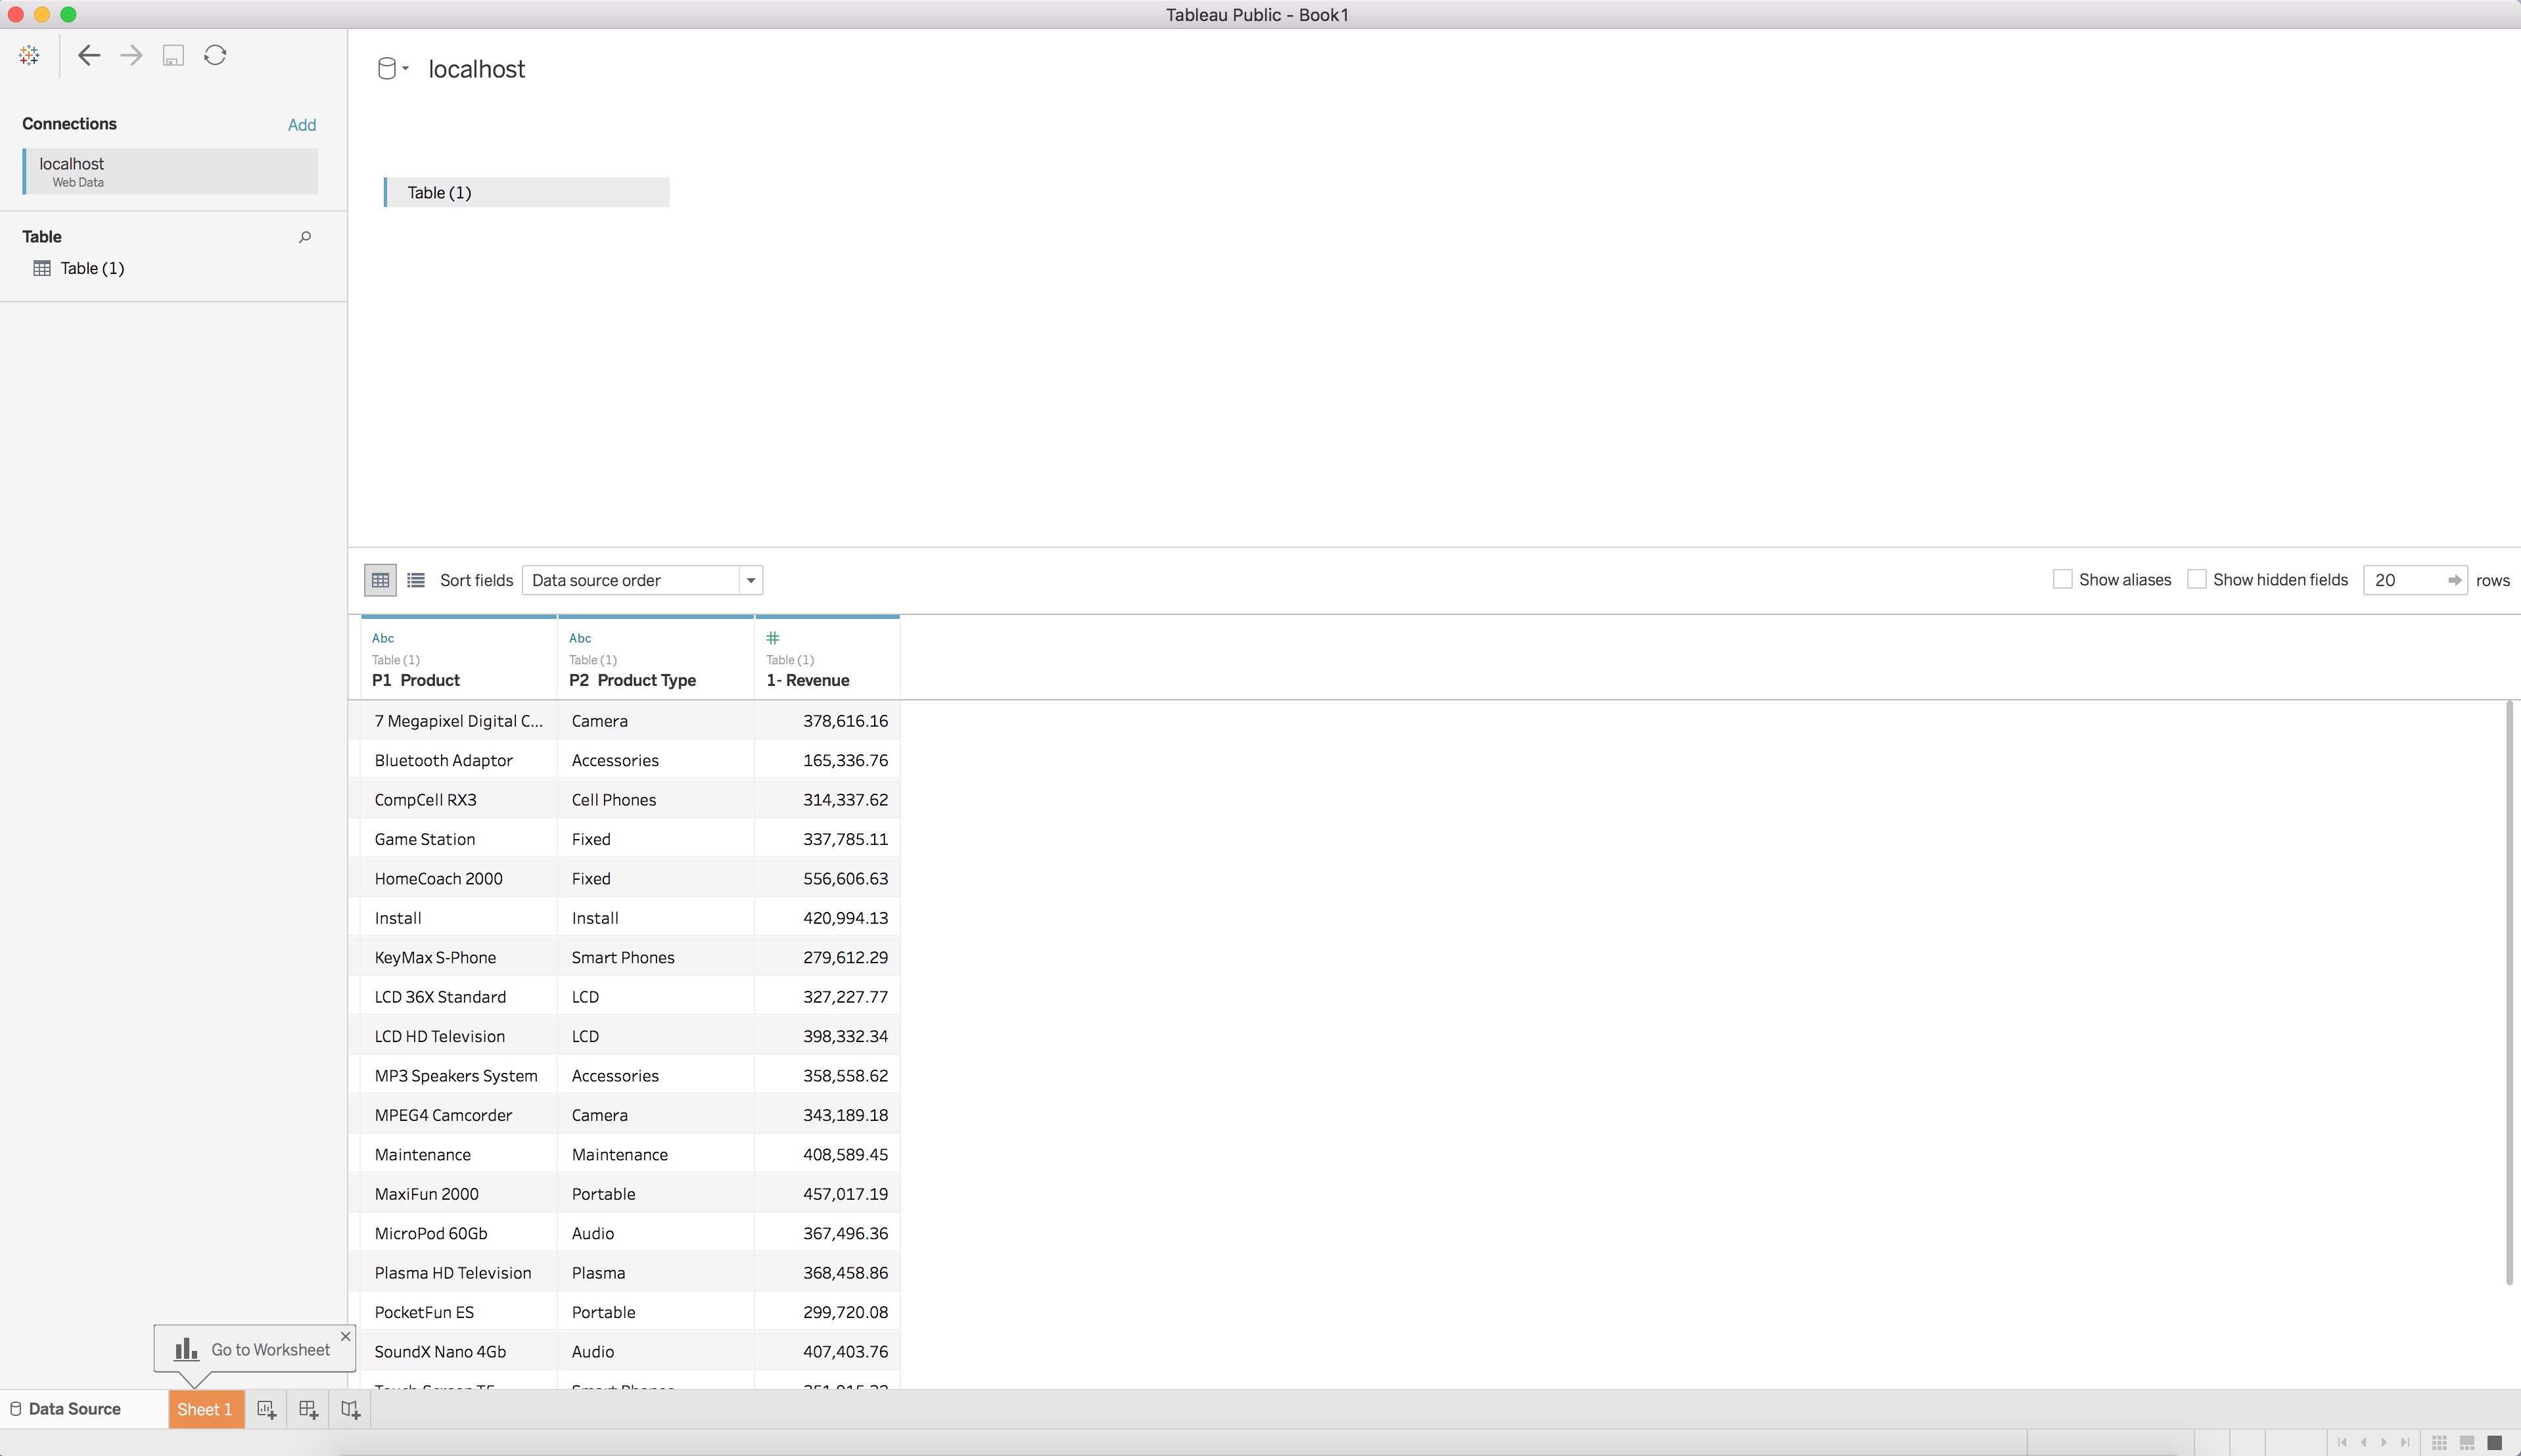
When this button is clicked, the Unify window will close and the query will execute. You will then be taken to a new Tableau Workbook with the results of the query as a Data Source. We can now use this query as a data source in Tableau, just as we would with any other data source.
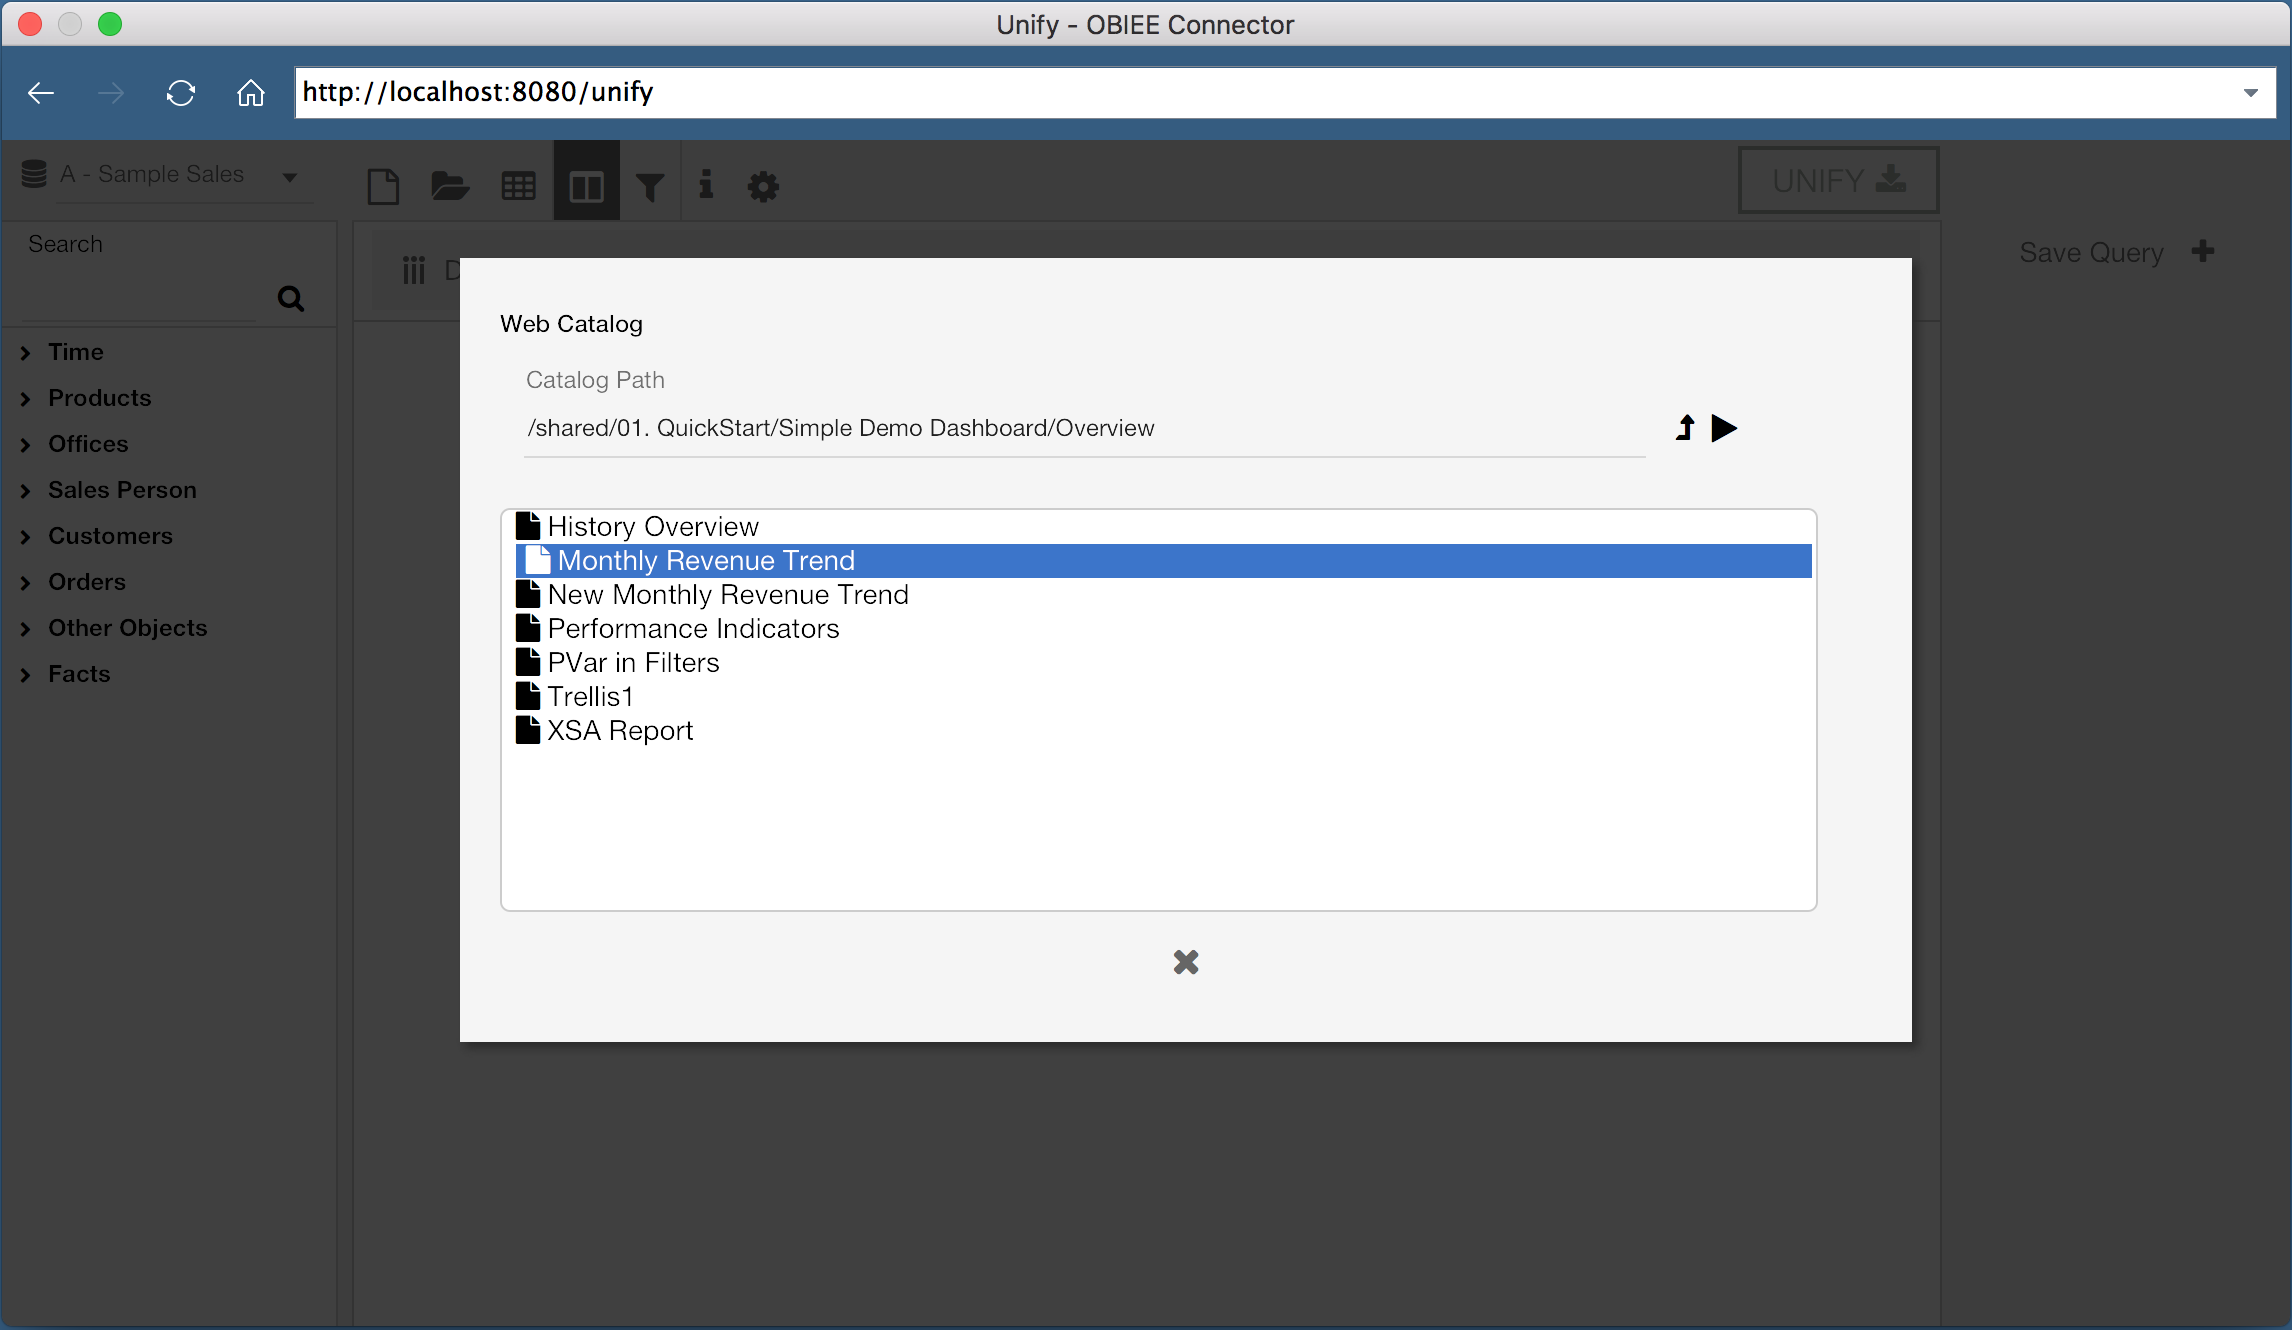
But what if we have existing reports we want to use? Do we have to rebuild the report from scratch in the web data connector? Of course not! With Unify, you can select existing reports and pull them directly into Tableau.
Instead of adding columns from the lefthand pane, we can instead select the “Open” icon, which will let us select an existing report. We can then export this report to Tableau, just as before.
Now let’s try to do something a little more complicated. OBIEE doesn’t have the capability to execute queries across Subject Areas without common tables in the business model, however Tableau can perform joins between two data sources (so long as we select the correct join conditions). We can use Unify to pull two queries from OBIEE from different Subject Areas, and perform a data mashup with the two Subject Areas in Tableau.
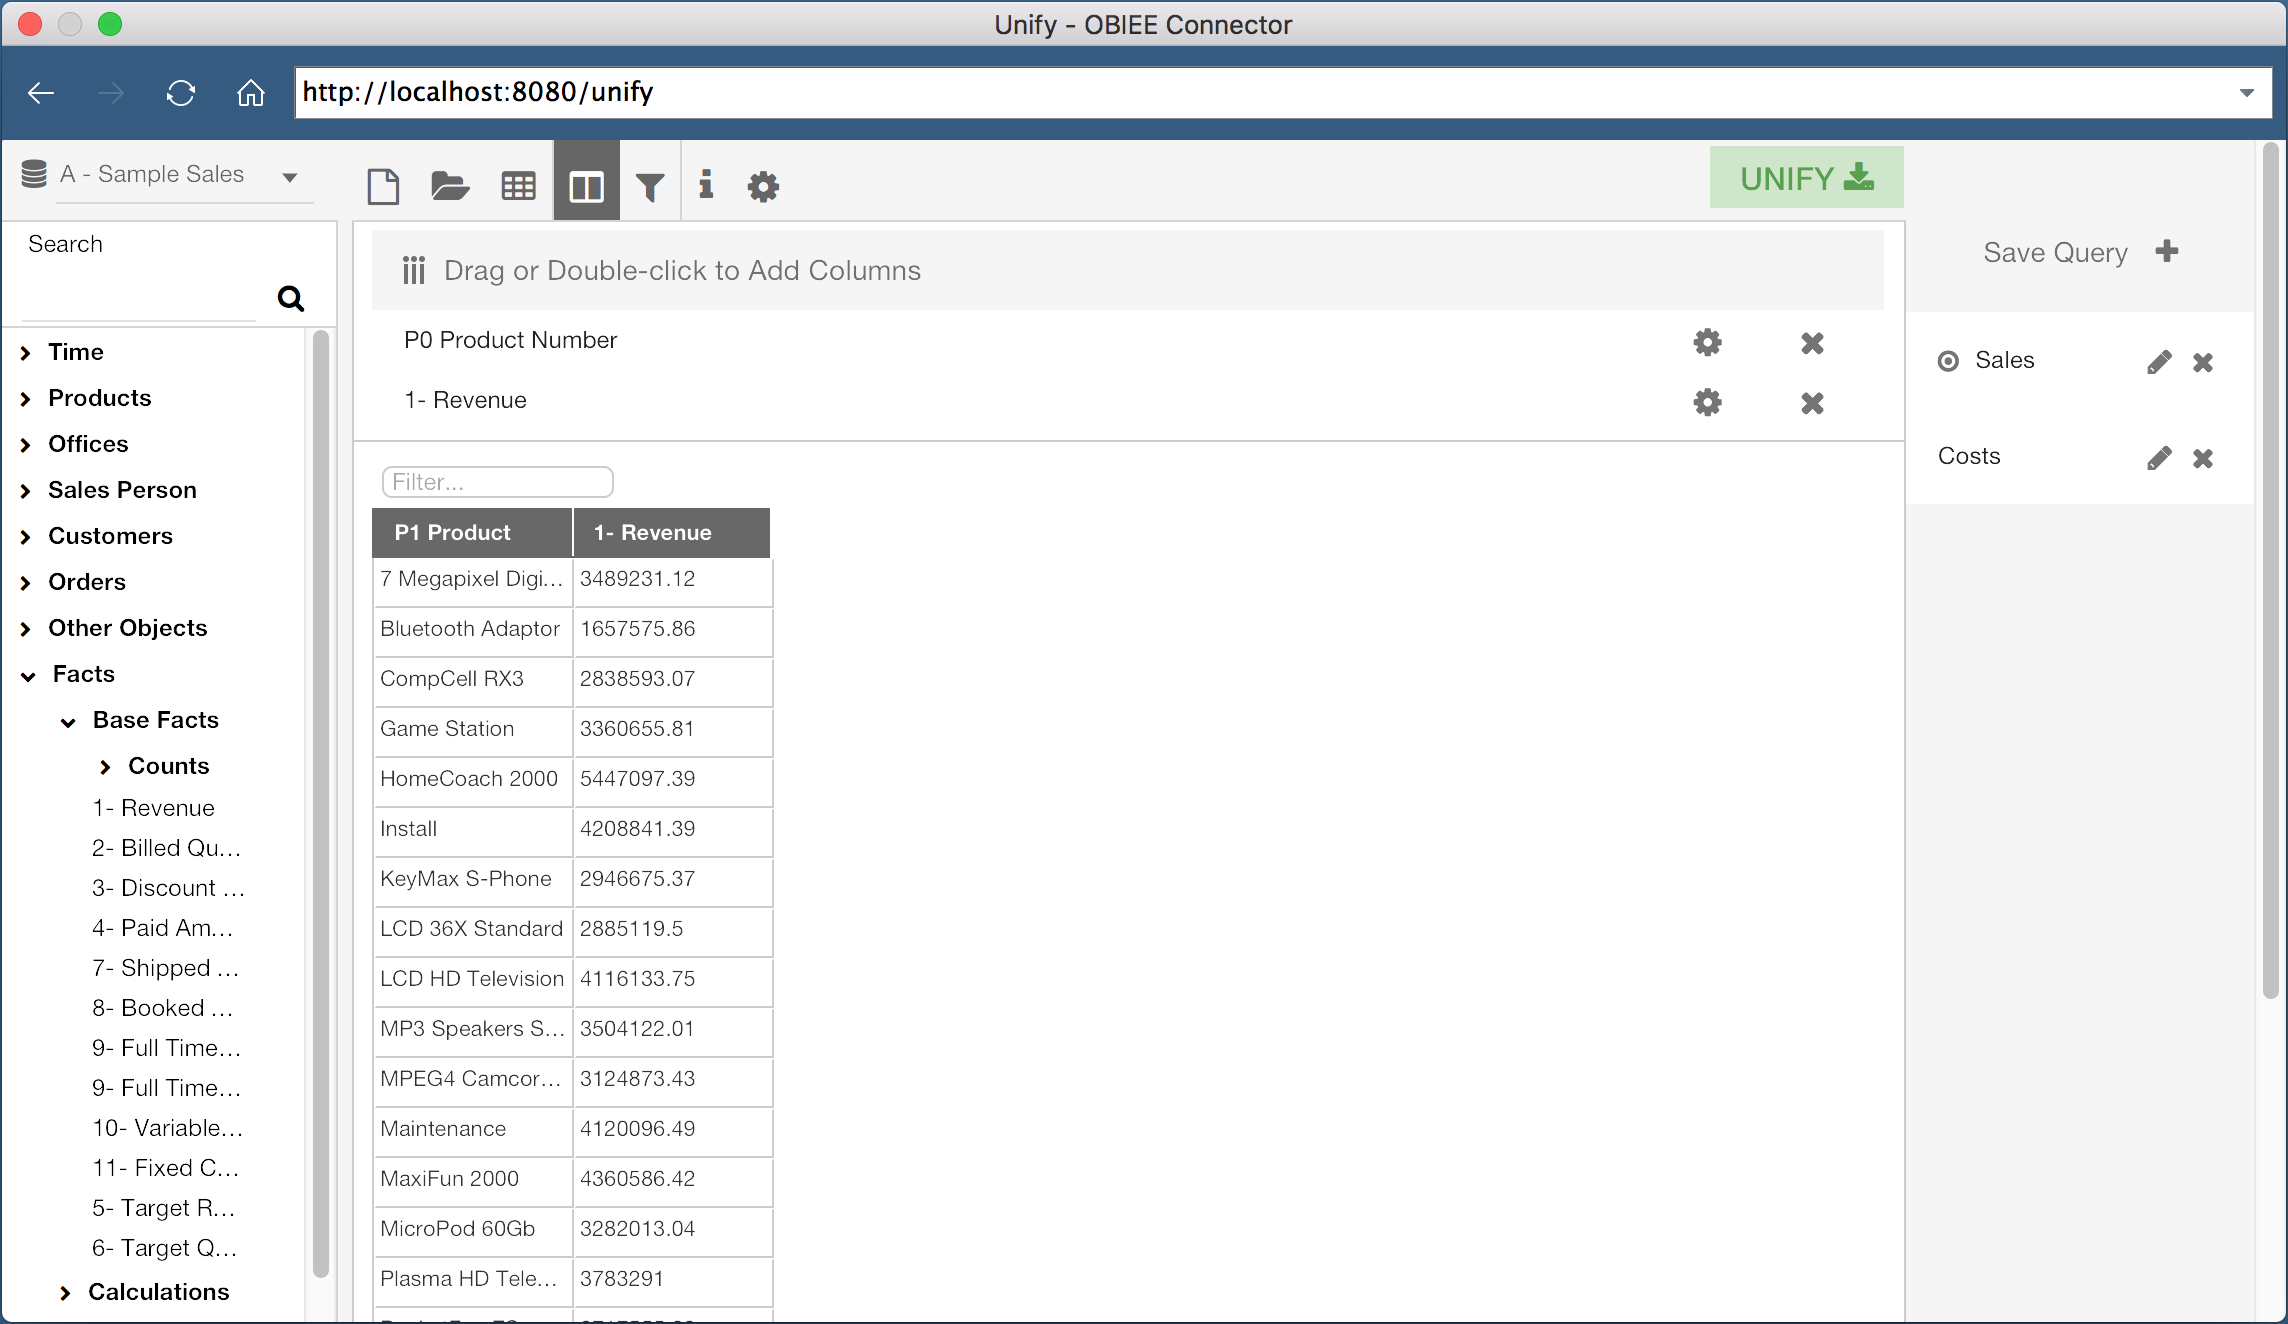
Here I’ve created a query with “Product Number” and “Revenue”, both from the Subject Area “A - Sample Sales”. I’ve saved this query as “Sales”. I can then click the “New” icon in the header to create a new query.
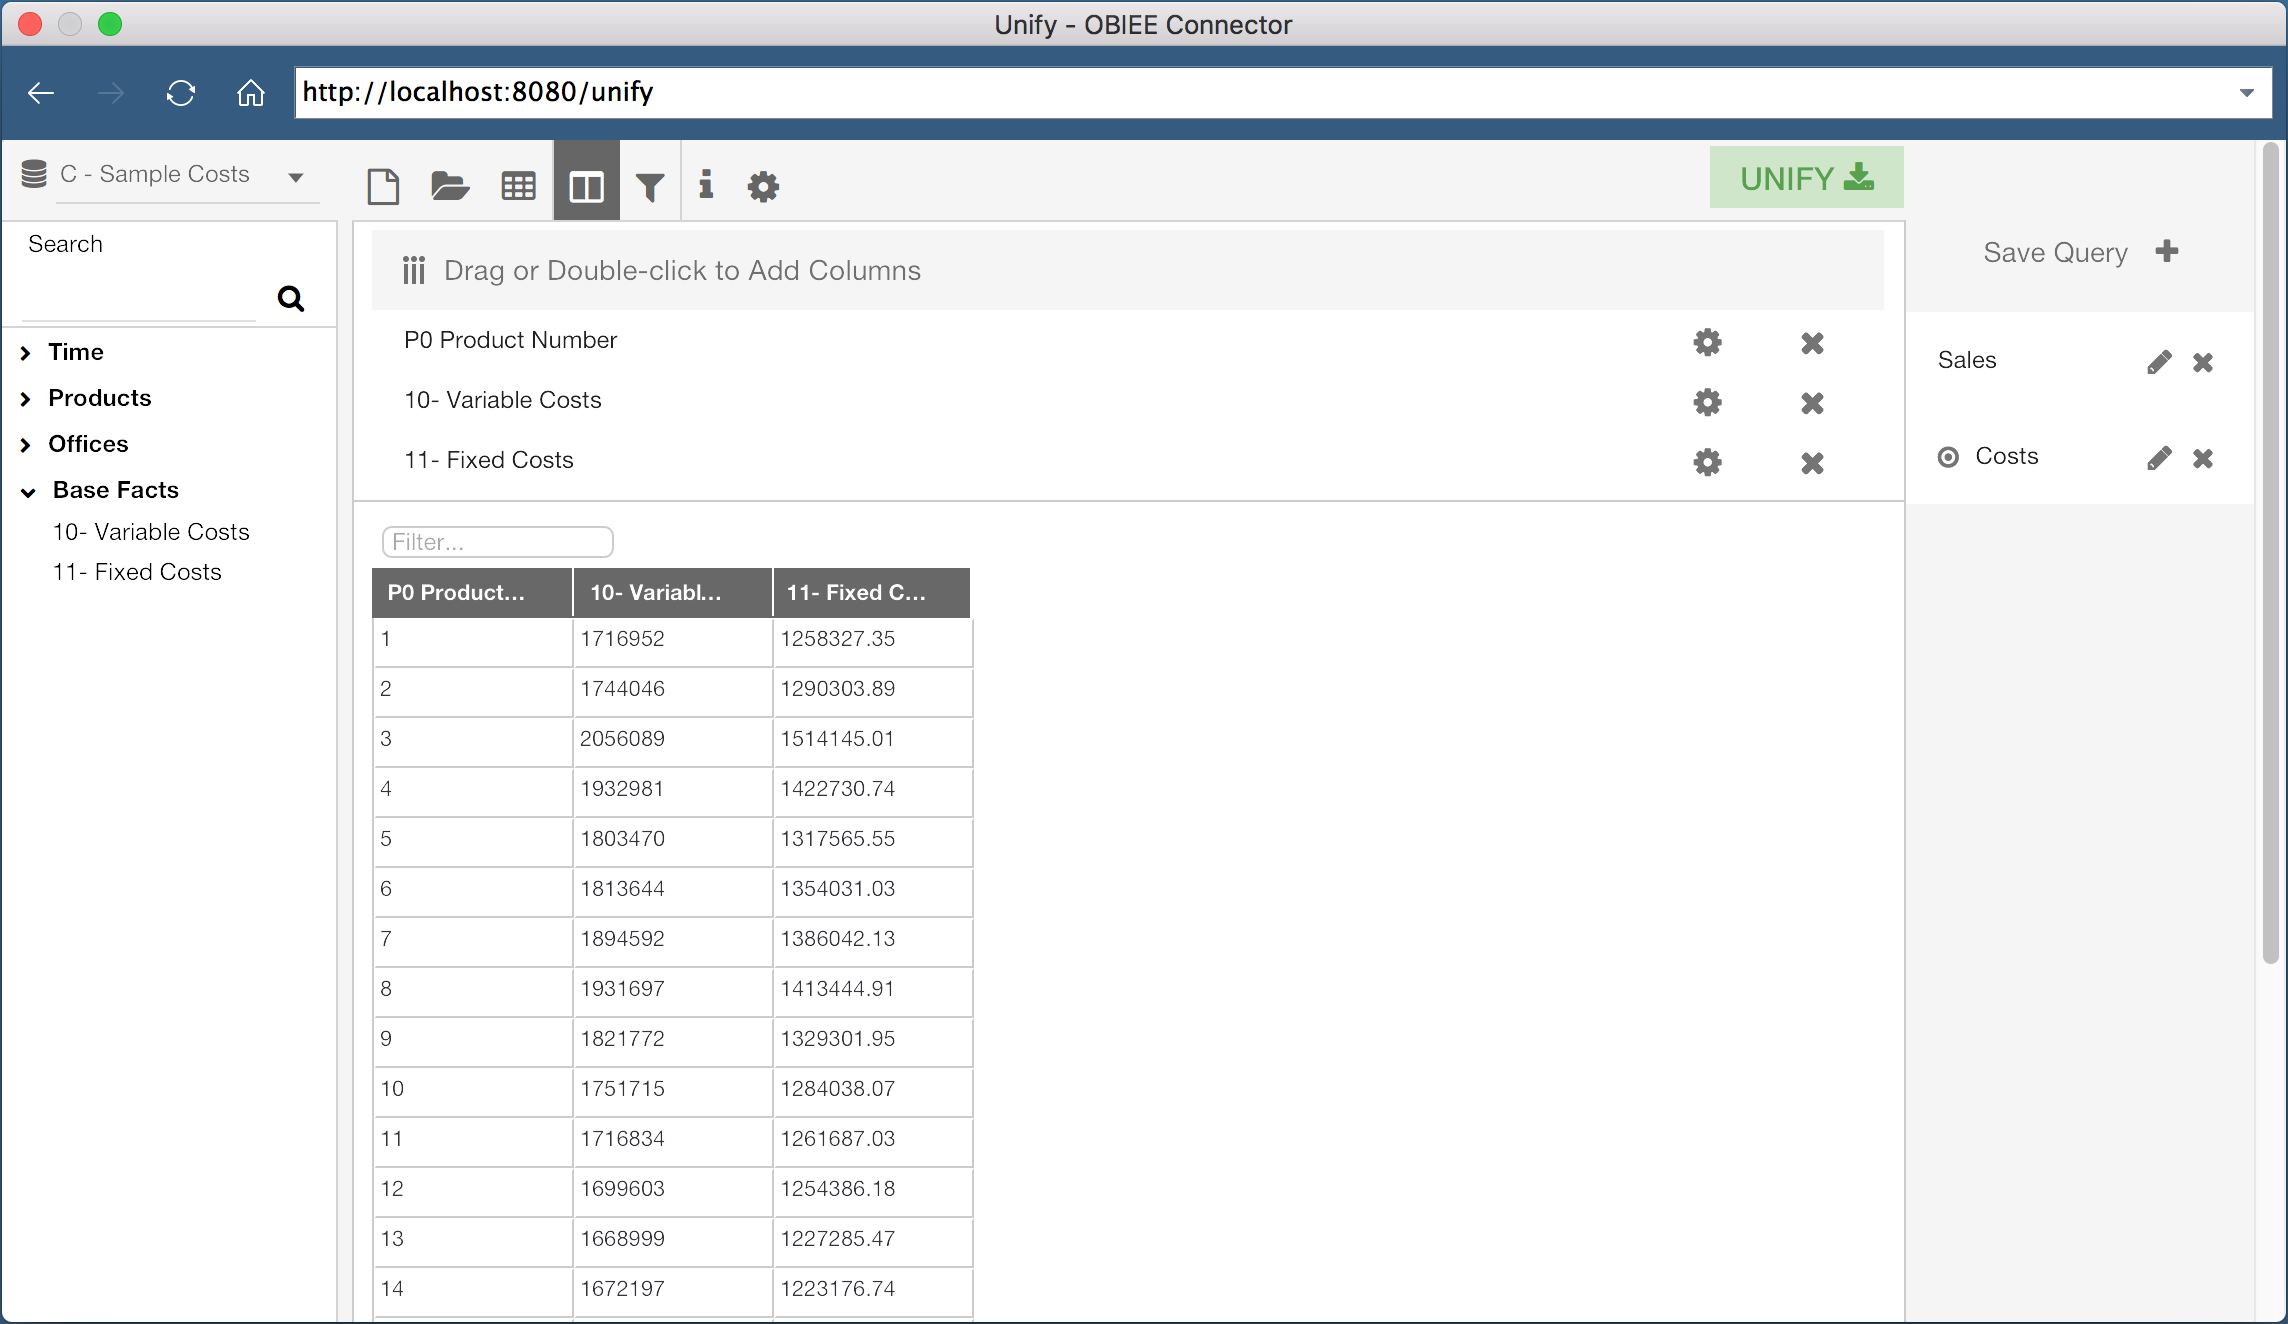
This second query is using the “C - Sample Costs” Subject Area, and is saved as “Costs”. This query contains the columns “Product Number”, “Variable Costs”, and “Fixed Costs”.
When I click the Unify button, both of these queries will be pulled into Tableau as two separate data sources. Since both of the queries contain the “Product Number” column, I can join these data sources on the “Product Number” column. In fact, Tableau is smart enough to do this for us:
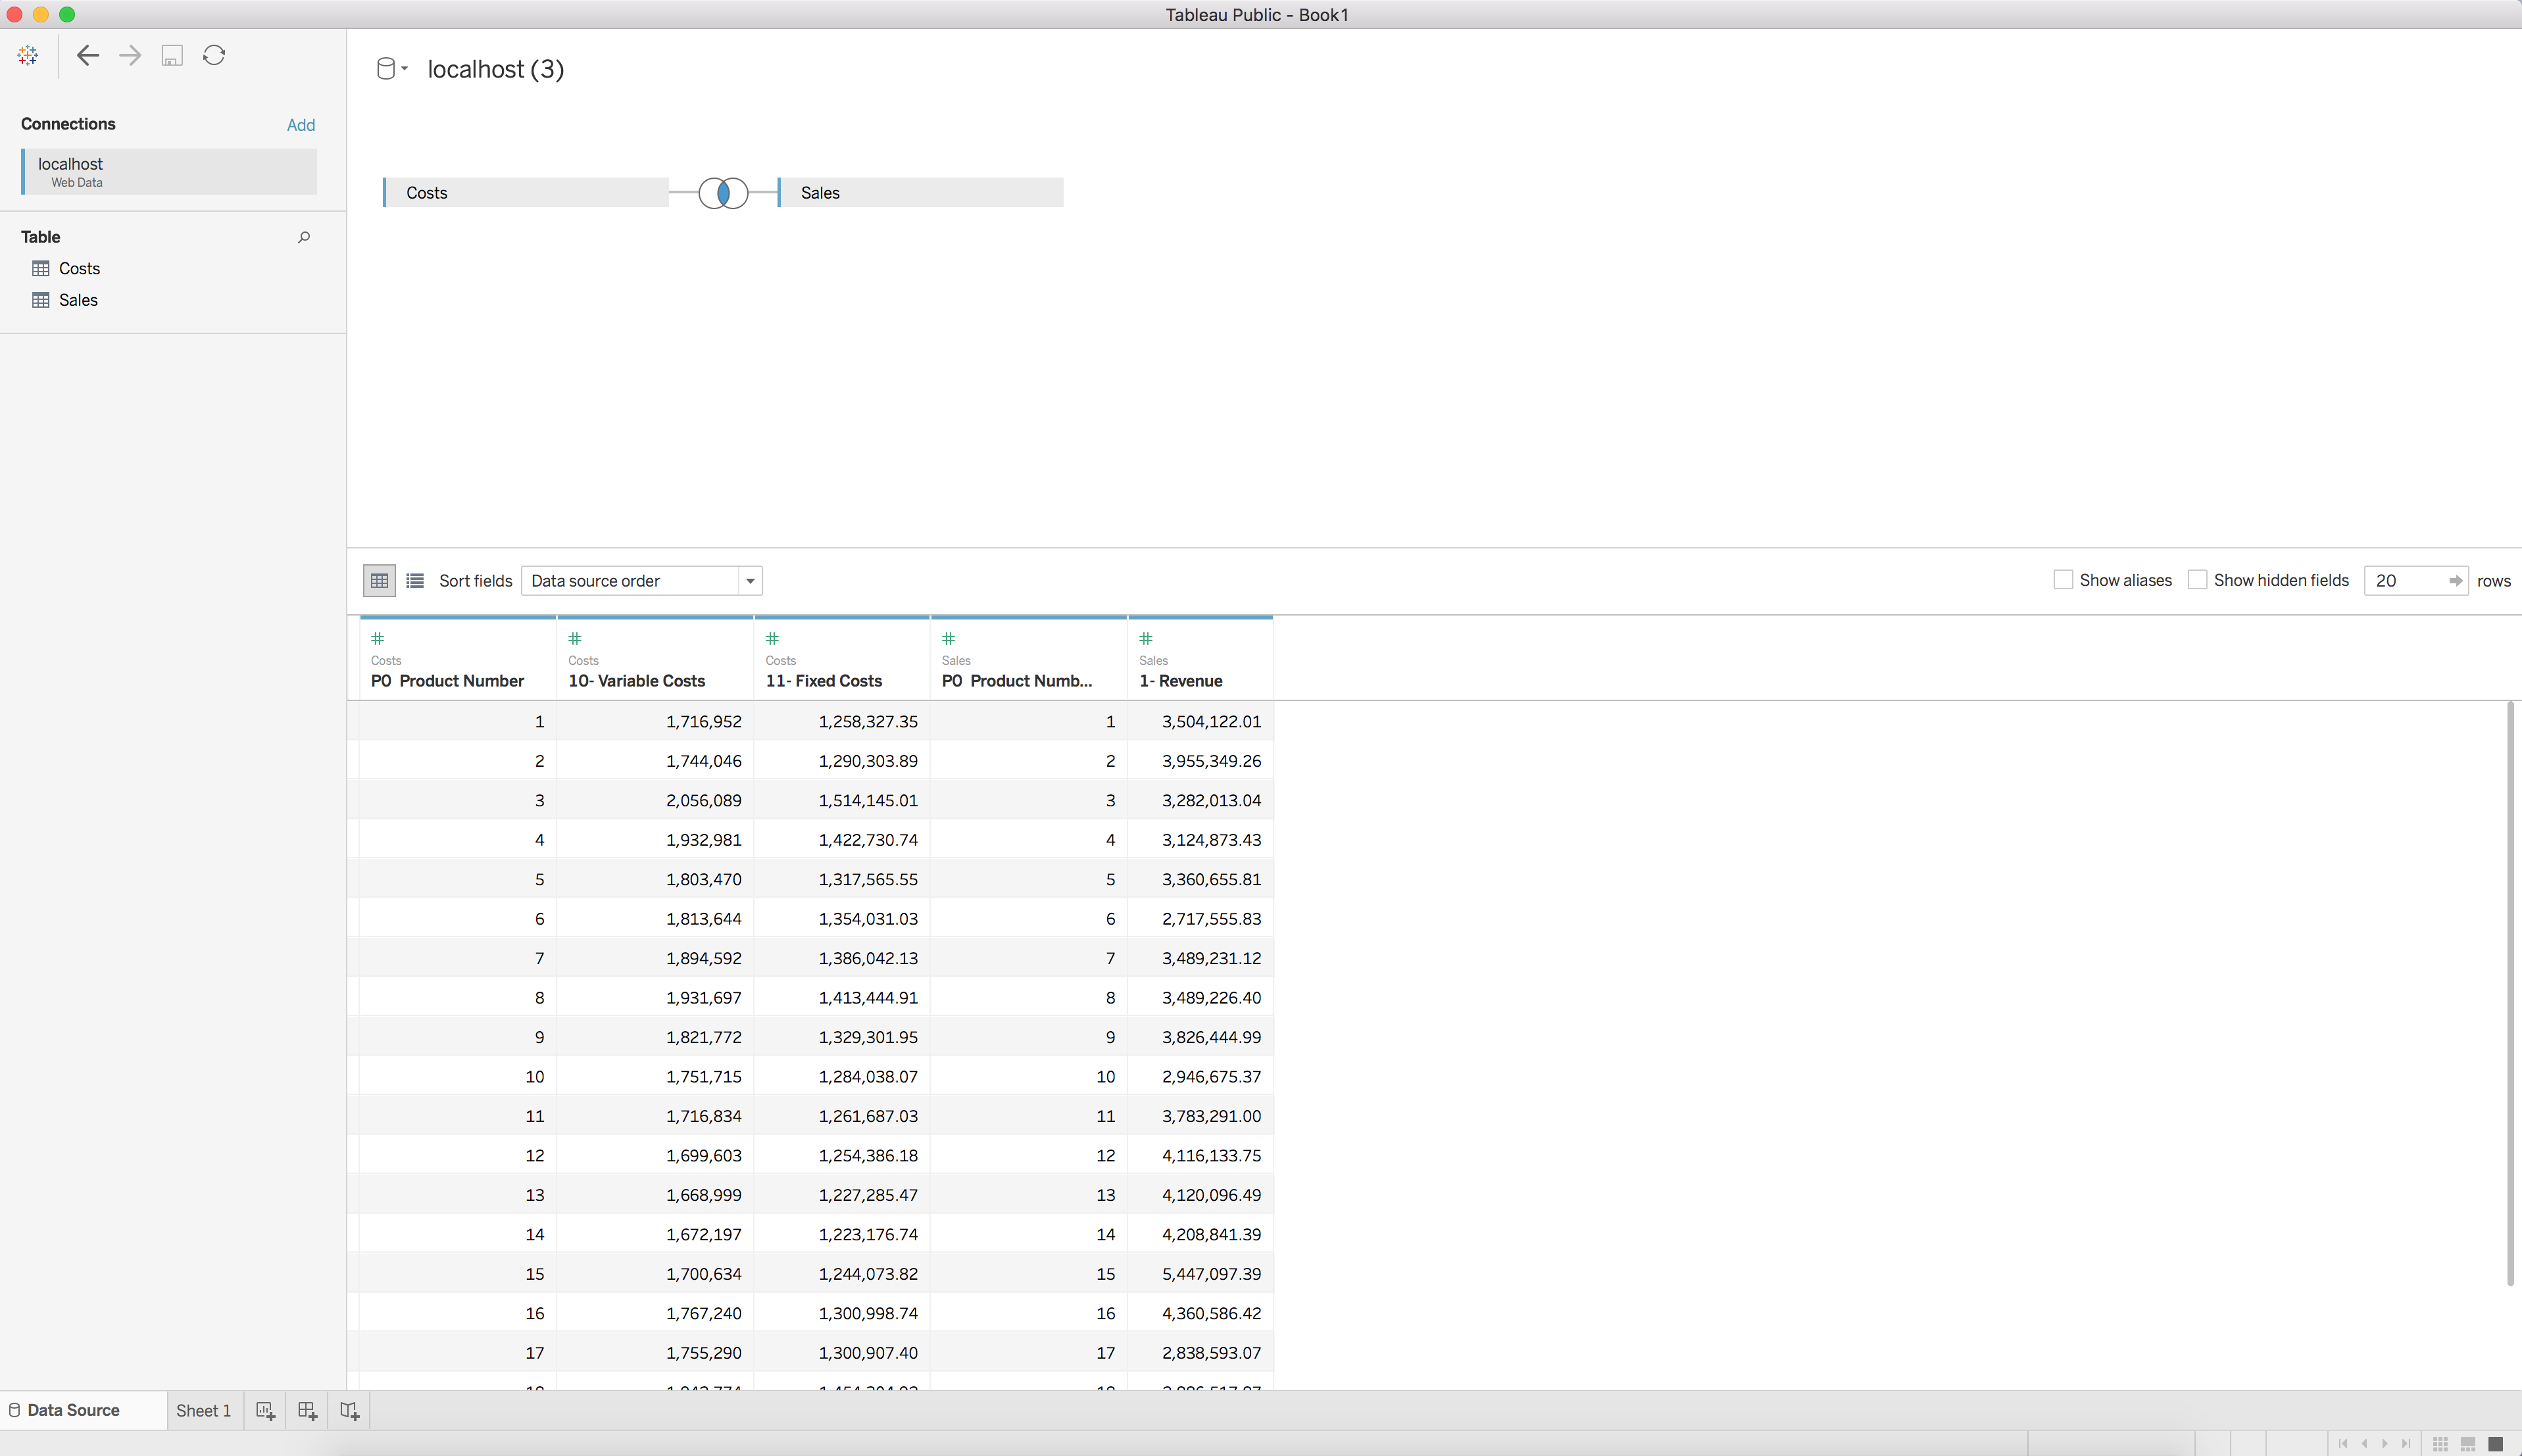
We now have two data sets, each from a different OBIEE subject area, joined and available for visualization in Tableau. Wow, that was easy!
What about refreshing the data? Good question! The exported data sources are published as data extracts, so all you need to do to refresh the data is select the data source and hit the refresh button. If you are not authenticated with OBIEE, or your session has expired, you will simply be prompted to re-authenticate.
Using Tableau to consume OBIEE data has never been easier. Rittman Mead’s Unify allows users to connect to OBIEE as a data source within a Tableau environment in an intuitive and efficient method. If only everything was this easy!
Interested in getting OBIEE data into Tableau? Contact us to see how we can help, or head over to https://unify.ritt.md to get a free Unify trial version.