Analyzing Brand Reputation with Oracle Analytics
This post illustrates how to use Oracle Analytics to perform brand reputation analysis without machine learning or marketing experience.

When Italy used to qualify for the FIFA World Cup, I was a big fan of Oracle Endeca Information Discovery and implemented several innovative projects with it. Endeca allowed users to upload and combine diverse data for agile discovery on structured and unstructured information, transform and enrich data with a powerful visual data integration environment, mine text in multiple languages, and identify sentiment through natural language processing within the same framework. Unfortunately, it was too ahead of its time and didn't achieve the success it deserved.
Two World Cup qualifying failures and one Euro Cup triumph later, the time is ripe and several features seen in Endeca have been included in Oracle Analytics. In this post, I'm going to illustrate how to use Oracle Analytics to easily perform brand reputation analysis without machine learning or marketing experience.
Let's begin!
Identifying the Brand to Analyze
According to Marketing91:
Brand Reputation is the perception of the brand and how the particular brand of the company is viewed by customers, stakeholders, and the market as a whole. It is the culmination of ideas and emotions that a customer associated with the brand with the customer service experienced during the purchase of goods and services, whilst using them, and after-sales services provided by the company.
Since Italy can have a chance to win the 2022 FIFA World Cup only in videogames, I'm going to pick eFootball 2022 - a free-to-play football game - to conduct my brand reputation analysis.
At launch, the game was panned by critics and players, who criticized the atrocious graphics, lack of content, laggy engine and finicky controls. With 92% negative reviews, it became the worst-rated game on Steam a day after launch, and the lowest-rate game of 2021 on the review aggregator Metacritic.
Konami - the publisher - apologised for the game's many issues and said they would work on improving it. A major update was released on the 14th of April 2022 on PC and consoles: would it be sufficient to raise the reputation of the game?
Gathering the Data
People love to share their thoughts and opinions online. Due to this fact and the rise of social media, consumers have the greatest say in how a brand is perceived nowadays. Online discussions, reviews, posts, and articles about a brand can make it or break it.
I'm going to focus on a single social network - Twitter - to start my analysis and understand what people think about eFootball 2022. Unfortunately, Oracle Analytics does not (yet) allow users to gather data directly from social networks, so I decide to use the Twitter API v2 and search-tweets - a Python library for the v2 search endpoints - because I'm familiar with them. I don't cover the details here, but you can trust me when I say that the most difficult thing is to get the developer account application approved by Twitter!
In order to have a set of data suitable for analysis, I'm going to consider only tweets in English, and ignore retweets and quotes. I'm also going to exclude tweets with links because I noticed that most of them were actually spam. I can then retrieve all tweets posted over the last week related to eFootball 2022, and its official Twitter account @play_eFootball, with the following query:
(to:play_eFootball OR @play_eFootball OR #eFootball OR #eFootball2022 OR eFootball OR eFootball2022) -from:play_eFootball -is:retweet -is:quote -has:links lang:en
The response is in JSON format, which is not directly supported by Oracle Analytics, and contains a mix of tweets and users information, so I'm going to convert it in a couple of Excel files - Tweets.xlsx and Users.xlsx - using a simple custom Python script.
Tweets.xlsx contains the following fields:
id- The unique identifier of the requested tweettext- The Actual UTF-8 text of the tweetauthor_id- The unique identifier of the user who posted the tweetcreated_at- Creation time of the tweet- Public engagement metrics for the tweet at the time of the request, such as
retweet_count,reply_count,like_countandquote_count
Users.xlsx contains the following fields:
id- The unique identifier of the username- The name of the user, as they've defined it on their profile (subject to change)username- The Twitter screen name, handle, or alias that the user identifies themselves withlocation- The location specified in the user's profile (freeform value)- Public metrics about activity for the user, such as
followers_count,following_count,tweet_countandlisted_count
Enriching the Data
With the gathered data in Excel format, I'm finally able to upload it to Oracle Analytics and use the data preparation features to enrich the datasets before visualizing the data.
Focusing solely on the numbers is a big mistake in brand reputation analysis. The high number of mentions does not automatically mean the brand is doing great, in particular when the vast majority of those mentions are terrible reviews. Understanding the general attitude towards the brand it's a crucial activity, but it could be really tedious if you have to do it manually.
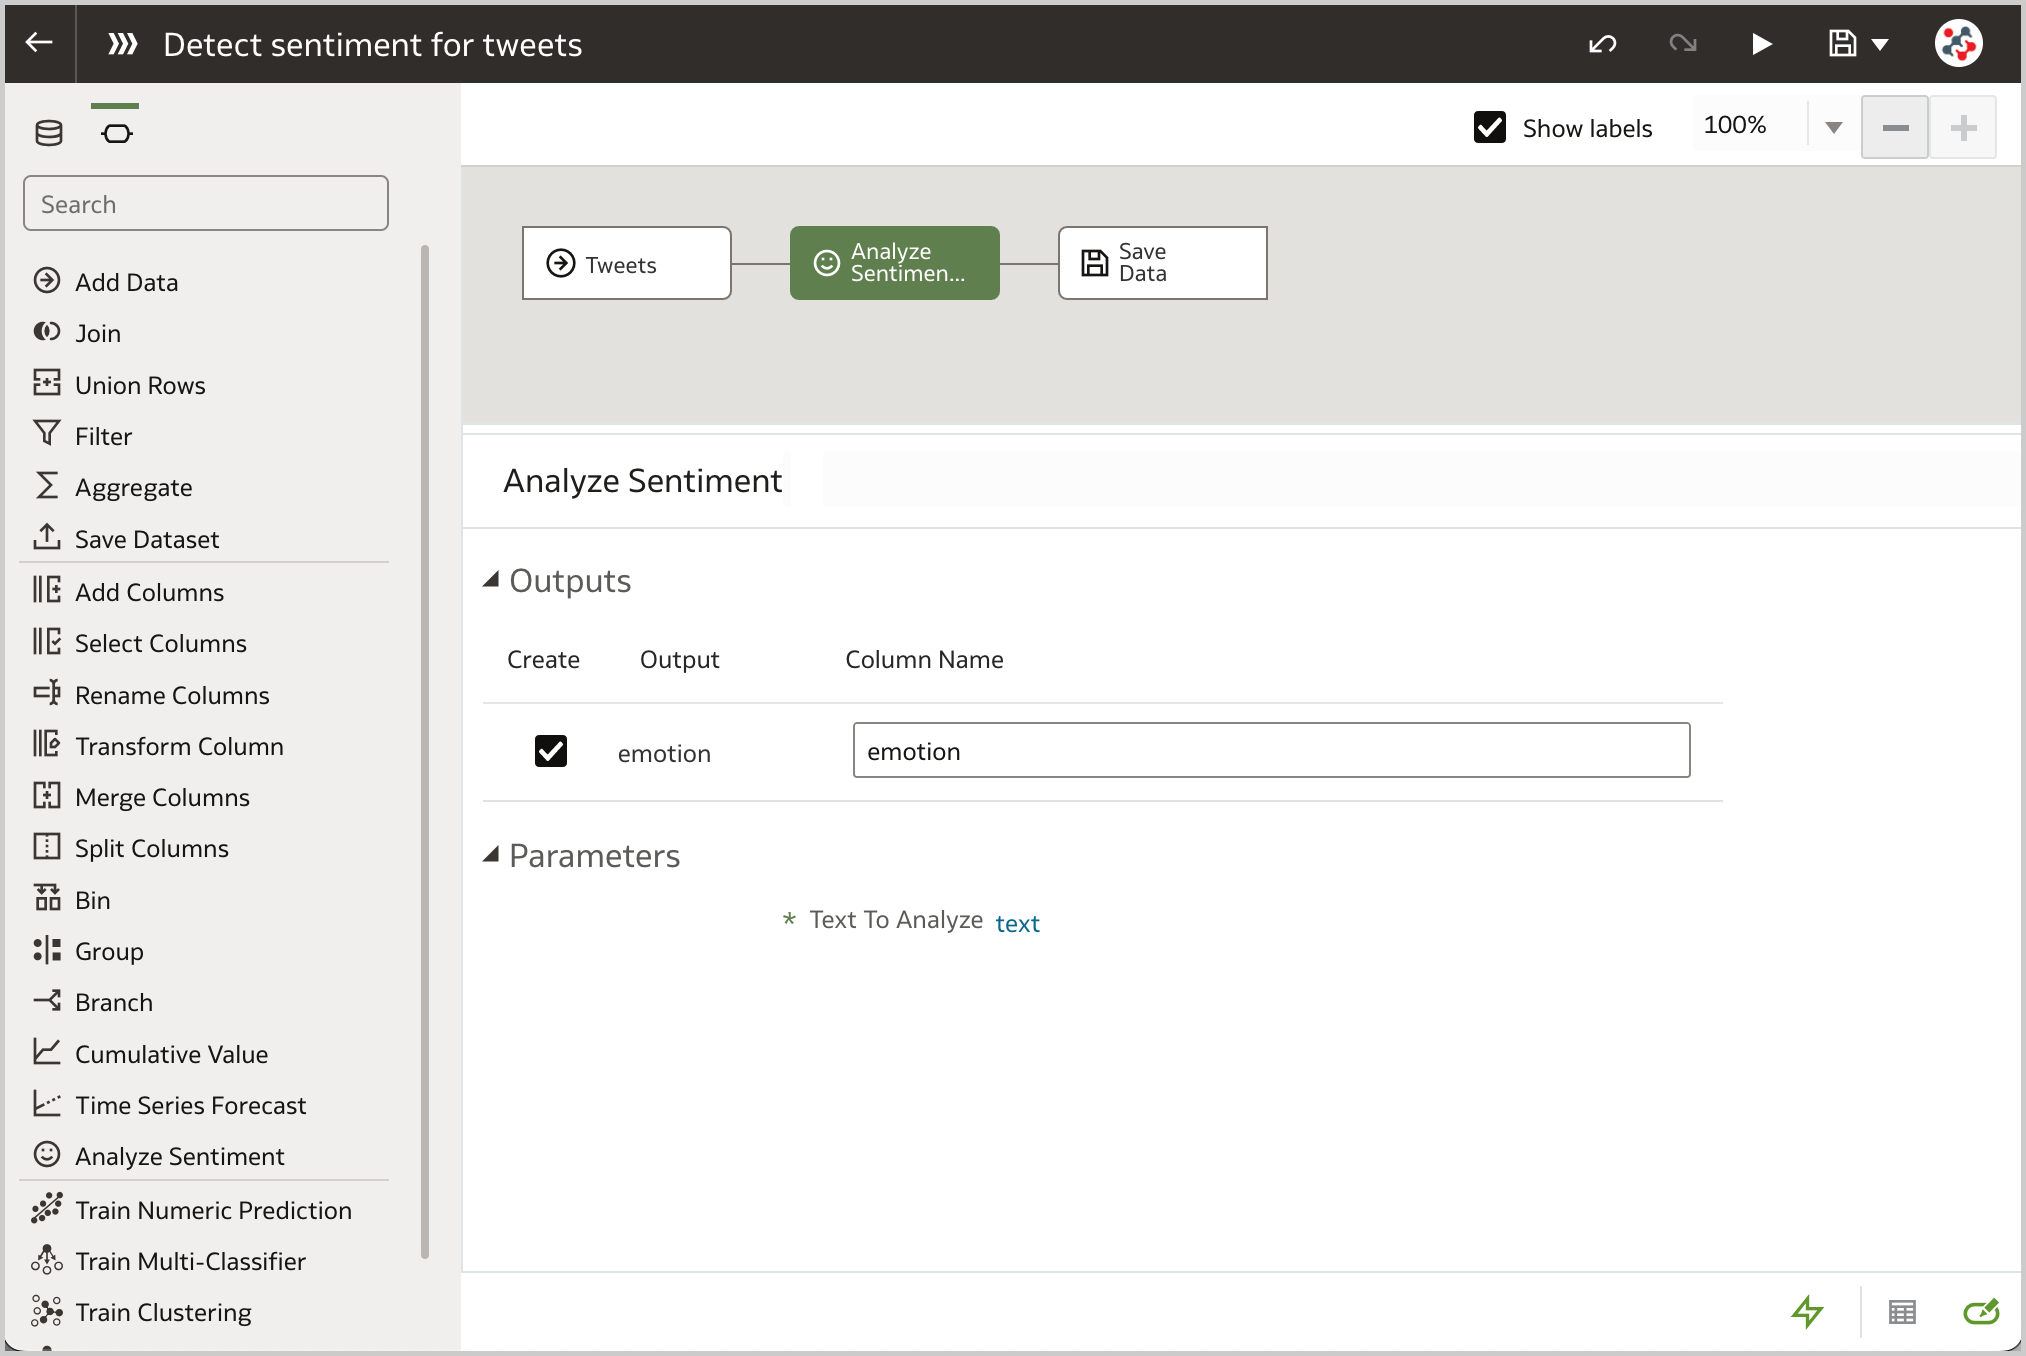
Luckily, the Analyze Sentiment step comes in handy: in Oracle Analytics, it can be added to a data flow to automatically detect the sentiment (Positive, Neutral or Negative) for a given text column. Figure 1 shows how easy is to configure this step. All I have to do is to select the column to analyze (text ) and provide a name for the new column that will contain the calculated sentiment (the default is emotion).
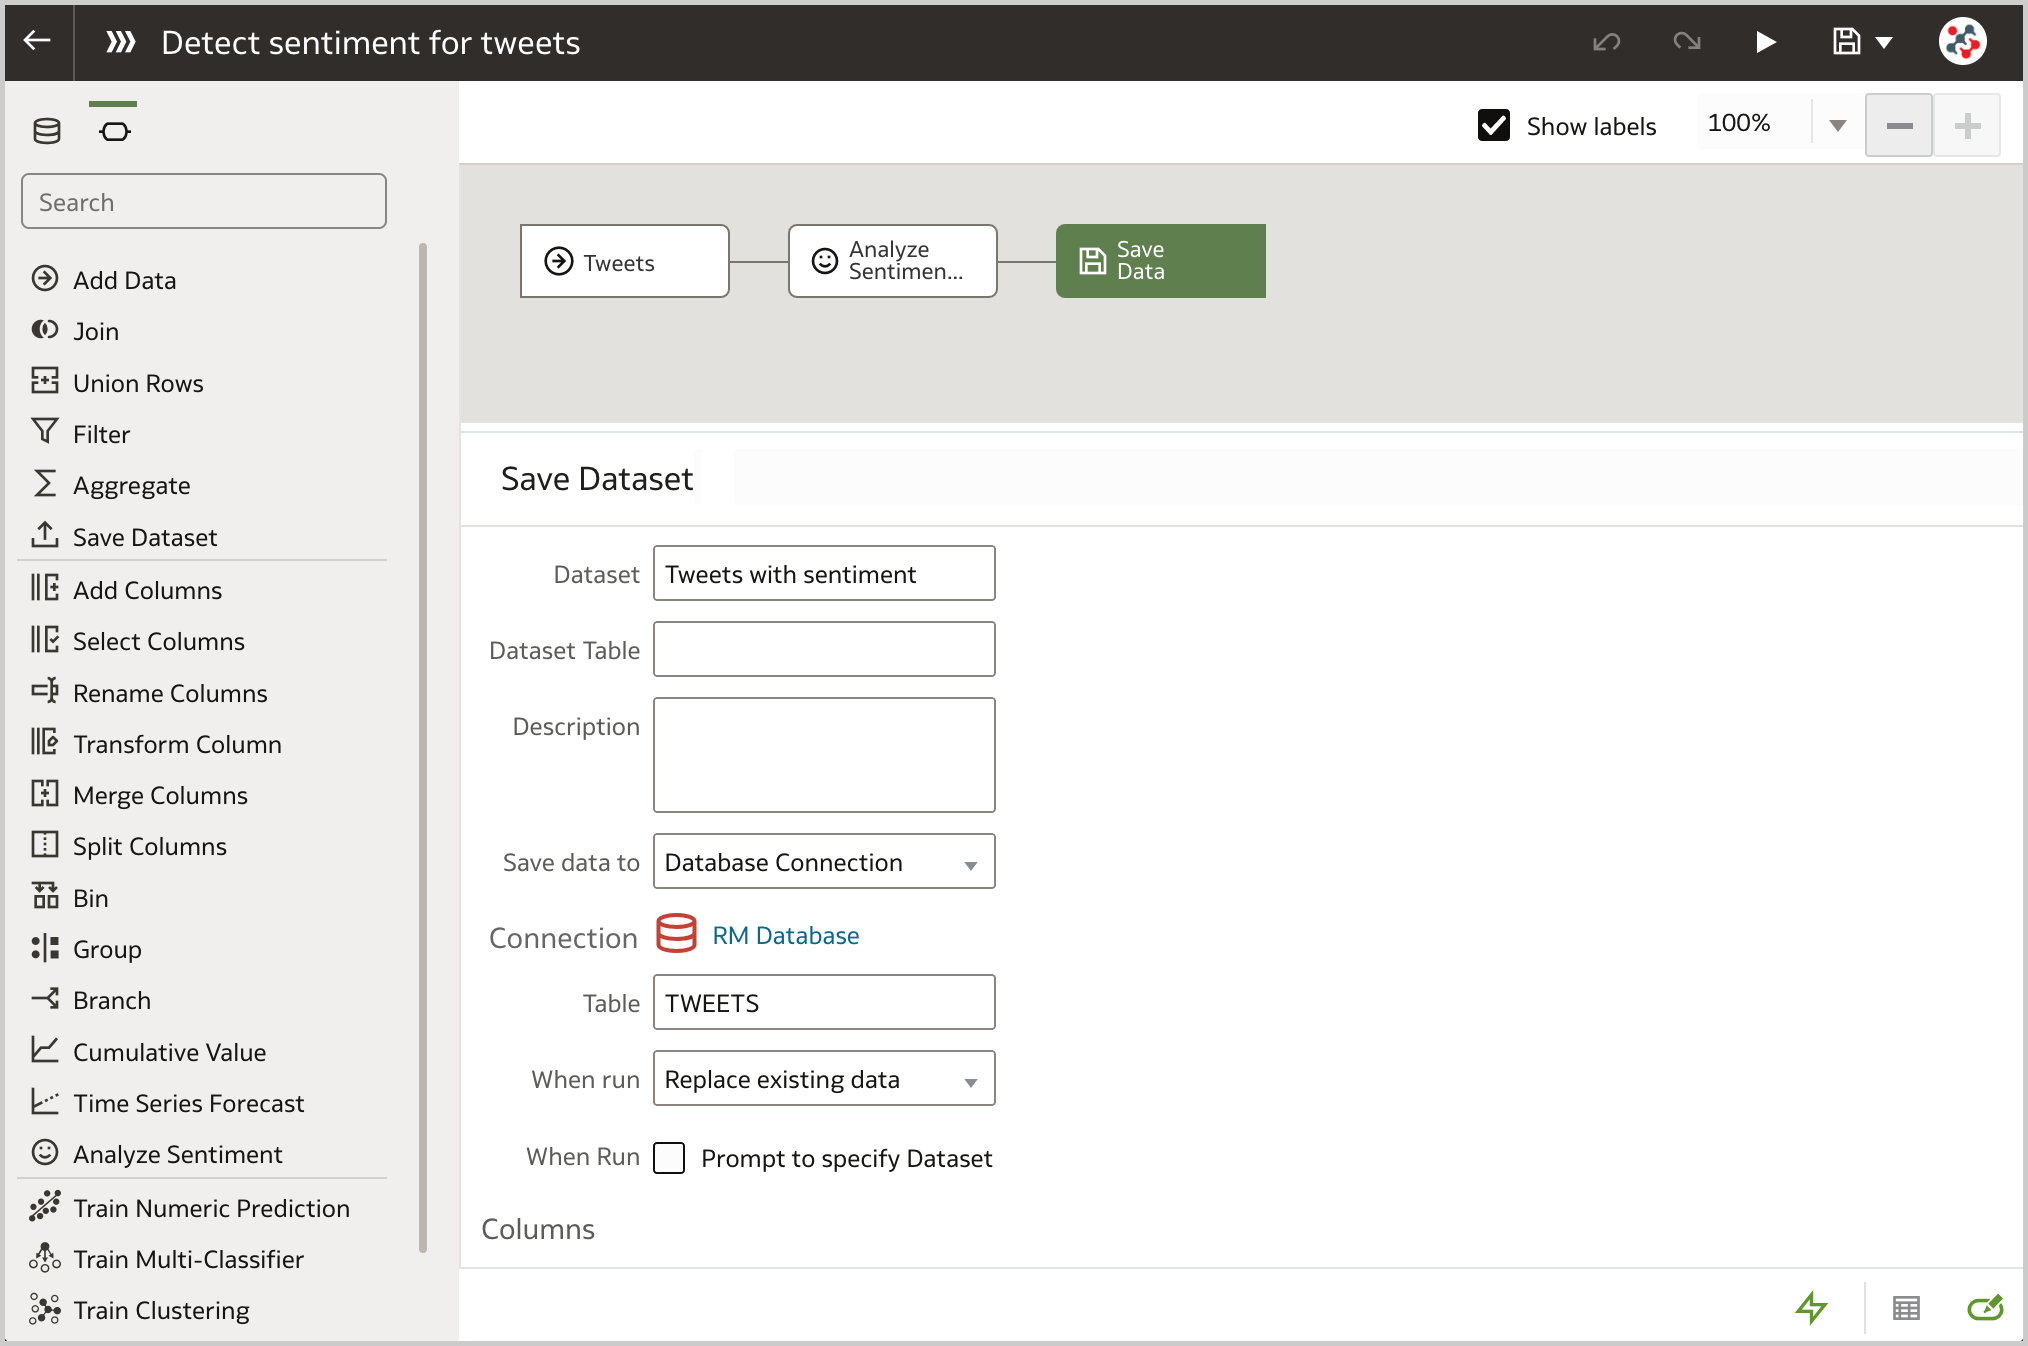
The next step requires to save the data in an Oracle Database or Oracle Autonomous Data Warehouse, for instance by adding a Save Data step to the data flow and setting the Save data to property to an existing database connection (Figure 2).
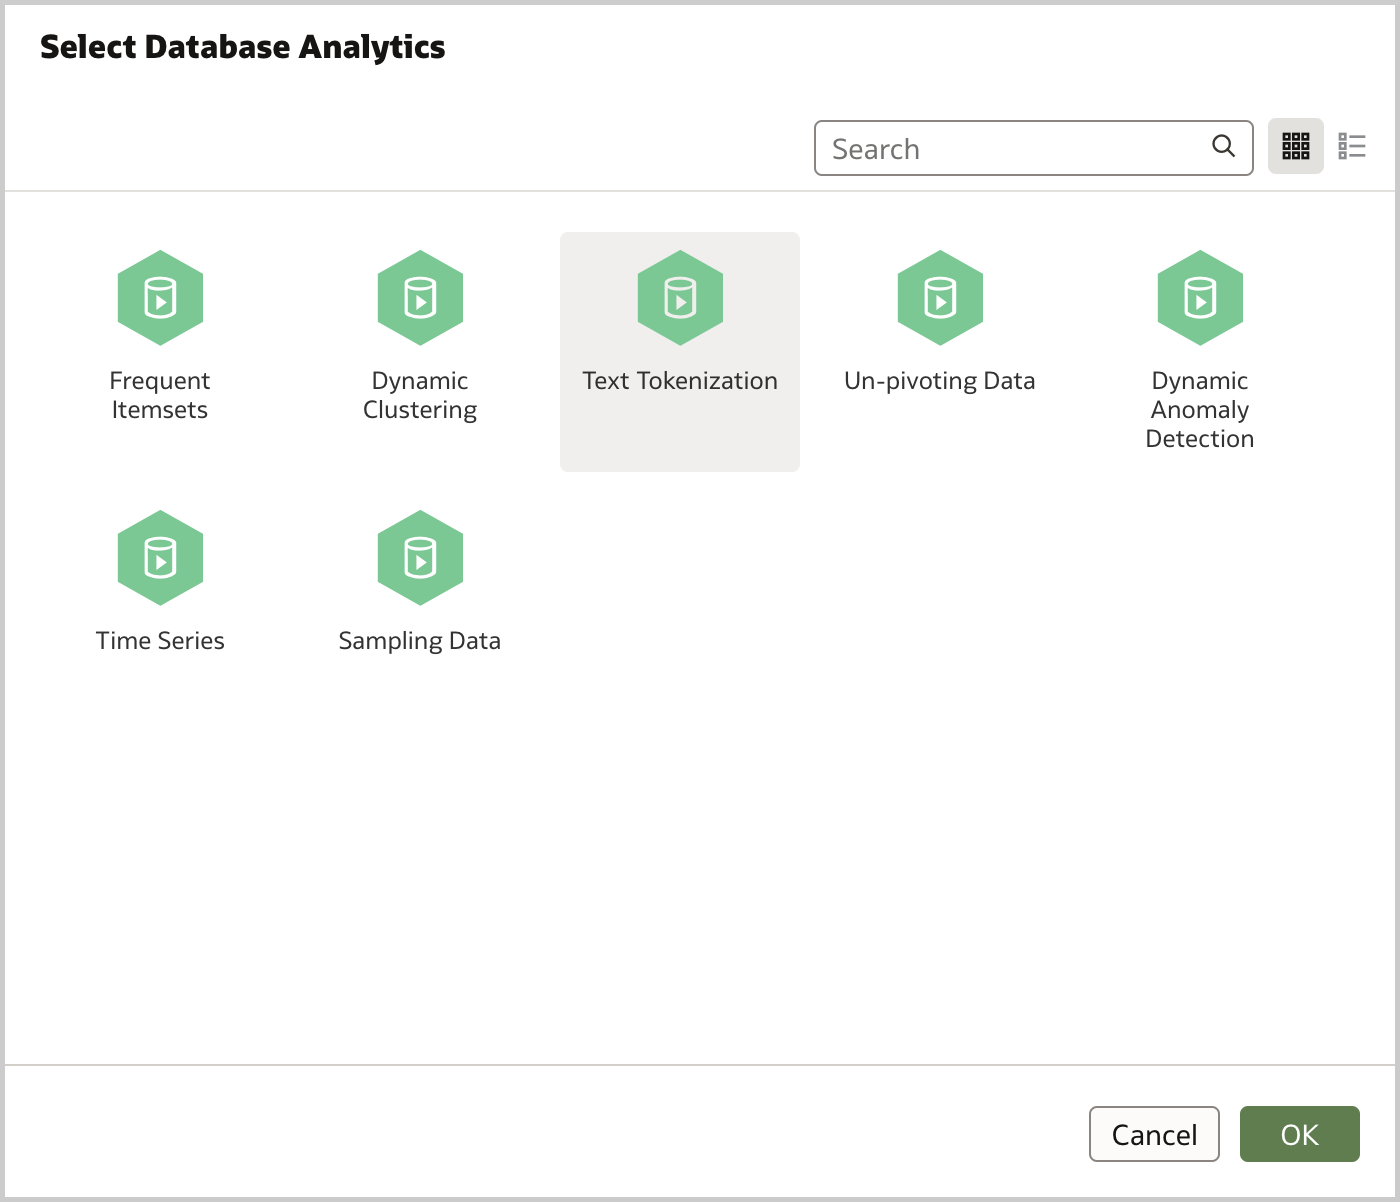
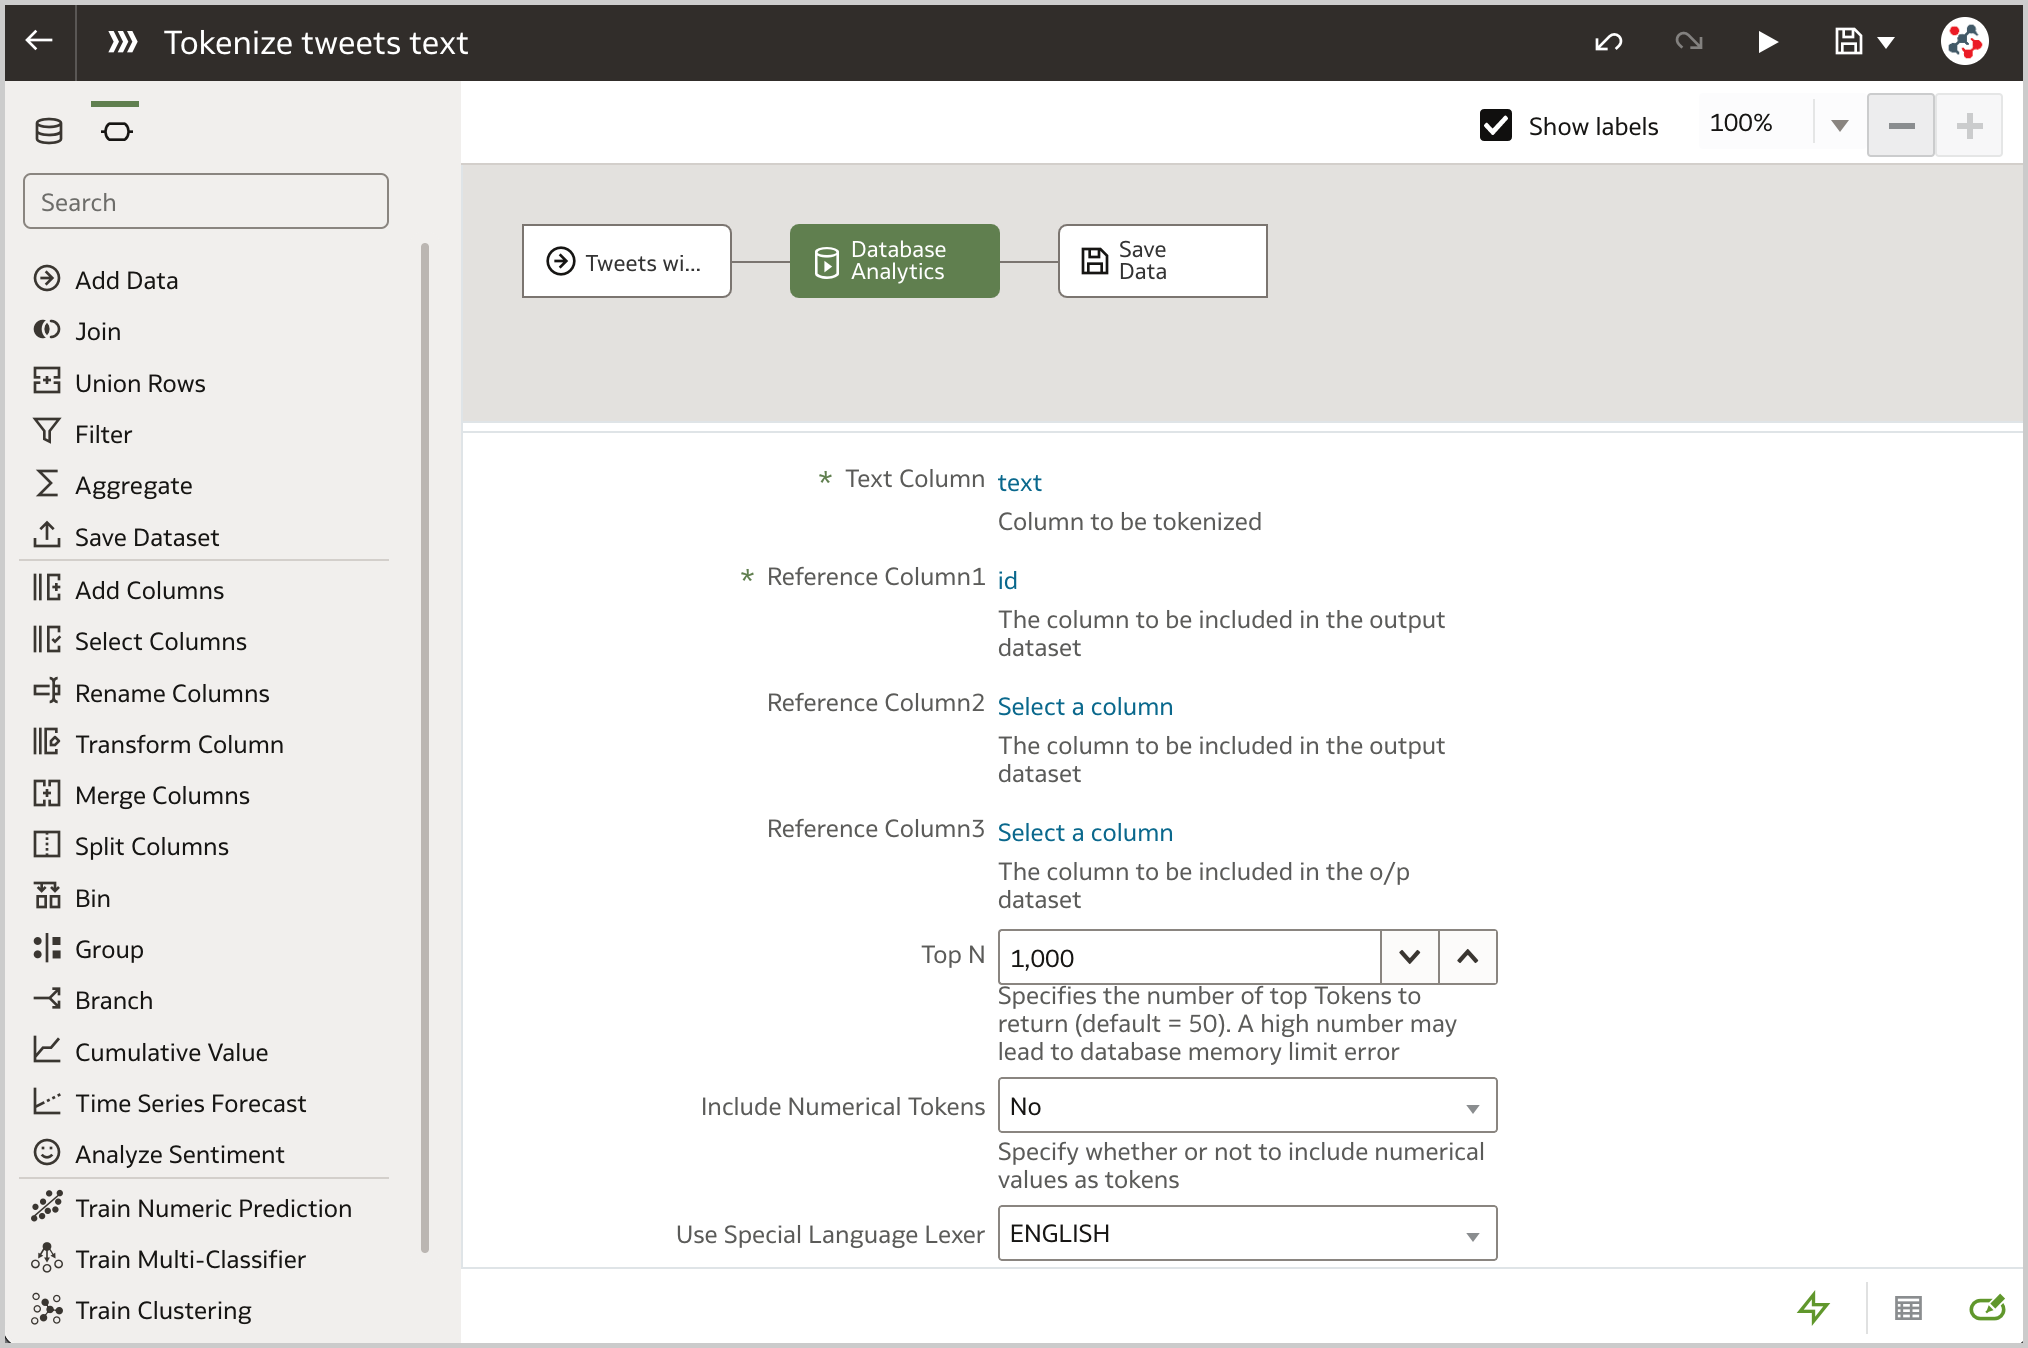
Having the data in the database allows to display the Database Analytics step in the data flow editor and perform advanced analysis and data mining analysis. In particular, I'm going to use it to break tweets text down into distinct words, count their occurrences and save the results in a new database table. Once again it's very easy to configure this step. All I have to do is to select the Text Tokenization analytics operation (Figure 3), specify the column to be tokenized (text), the reference column(s) to be included in the output dataset (id), the number of top tokens to return and wheter to use a special language lexer (Figure 4).
Tokens and occurrences will be fundamental when I analyze the data to display Tag Cloud visualizations. It is a great visualization of the things people usually associate with the brand, and it can be an indicator of the brand reputation in general.
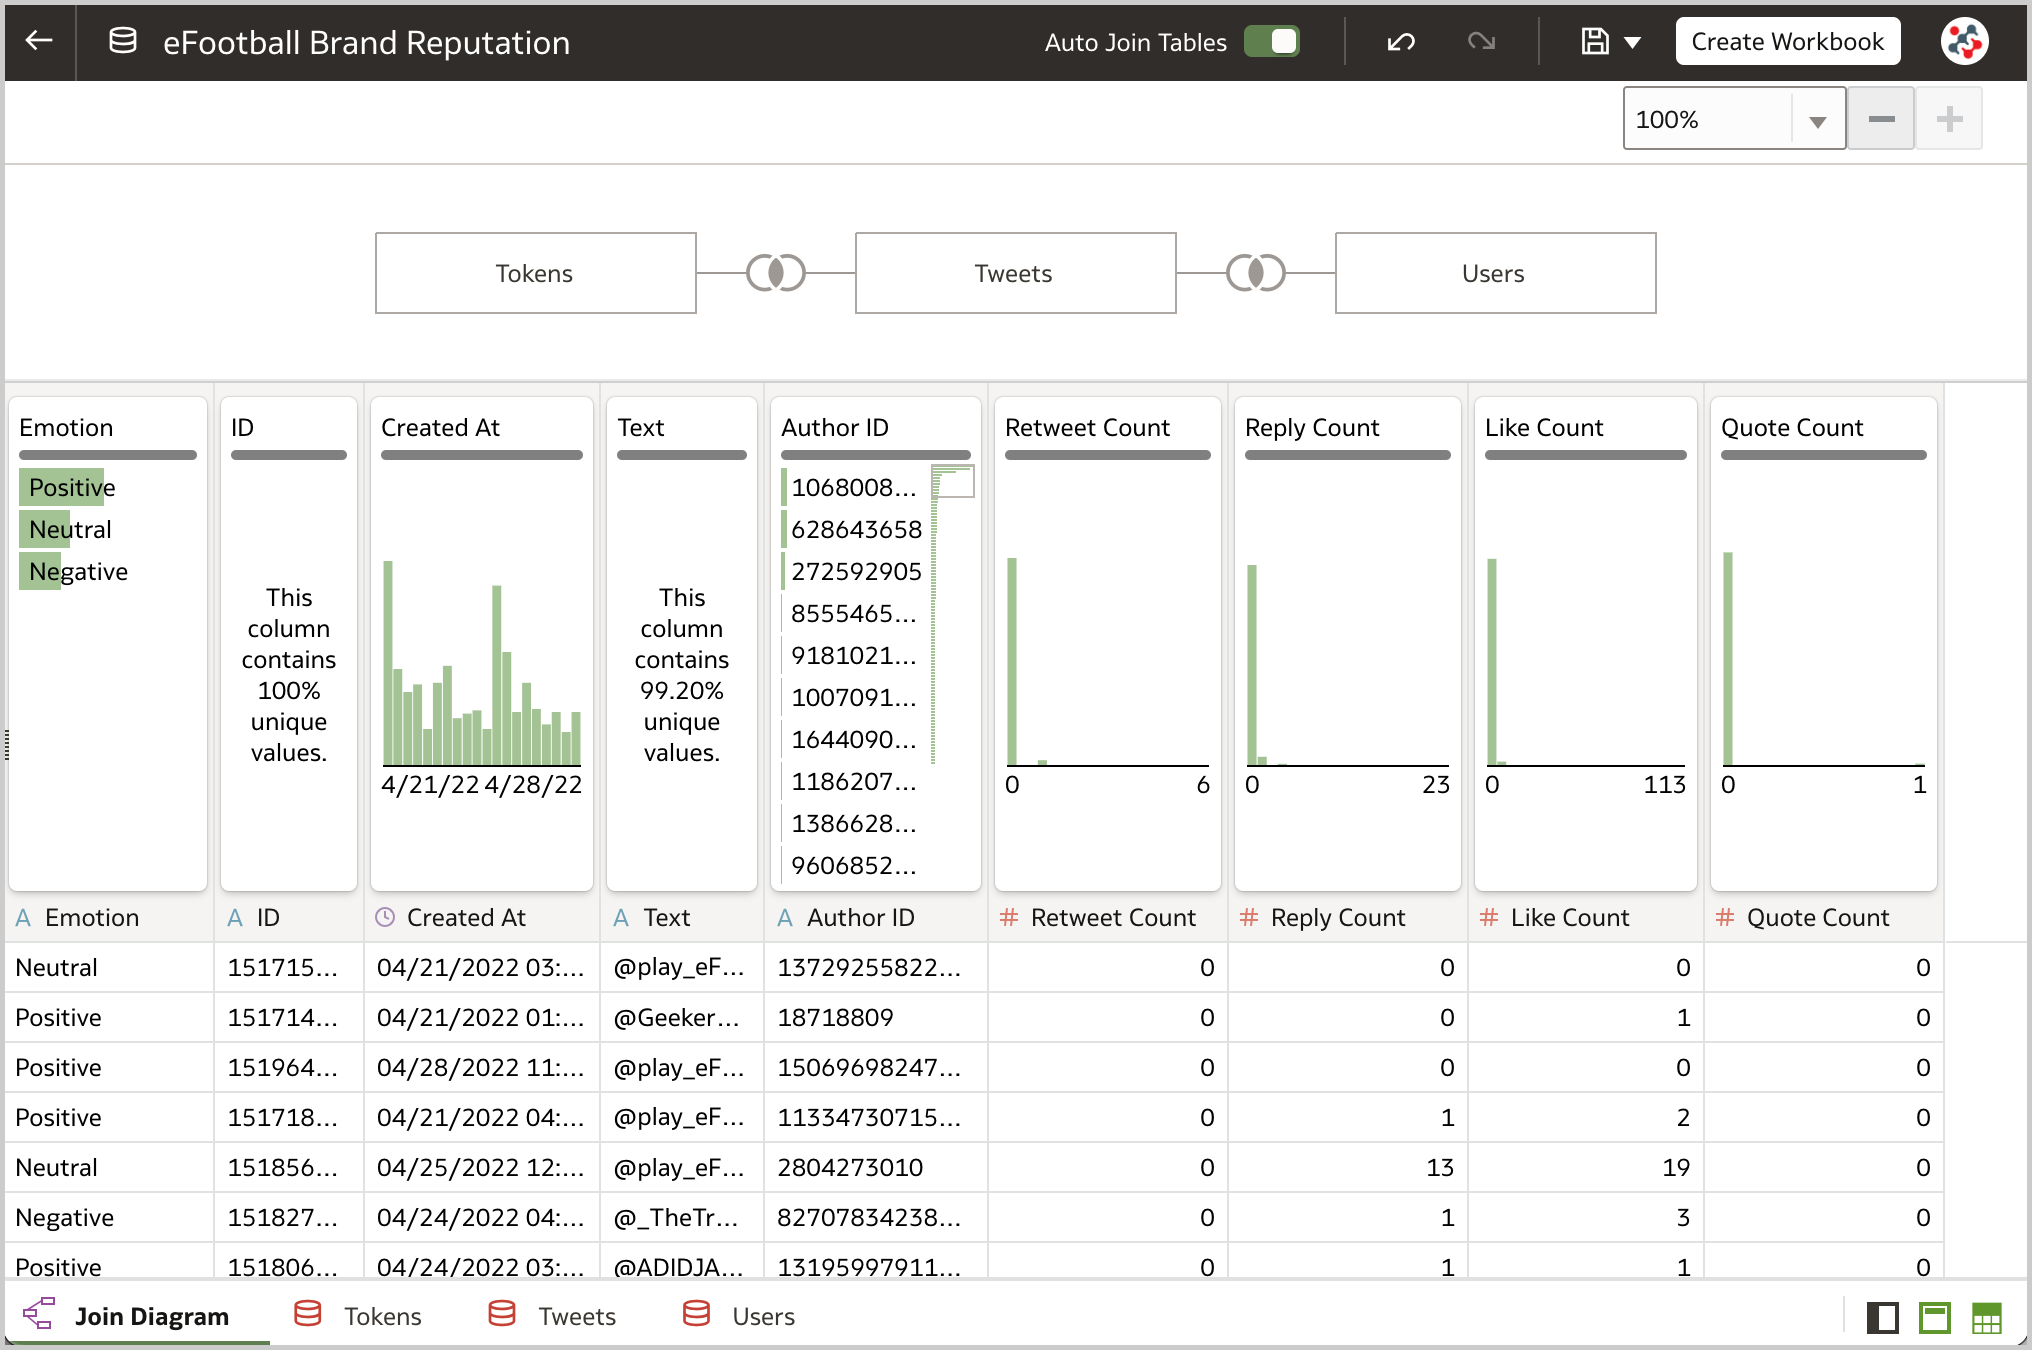
Since all tweets, users and tokens data is in the database, it's a good idea to create a dataset with multiple tables to analyze the data (Figure 5). This solution allows me to achieve better performance because all the joins will be executed at the database level and only the tables needed to satisfy a visualization are used in the query.
Analyzing the Data
Now that data is set up, it's time to conduct a brand reputation analysis to identify what works and what does not, and optimize the brand strategy accordingly.
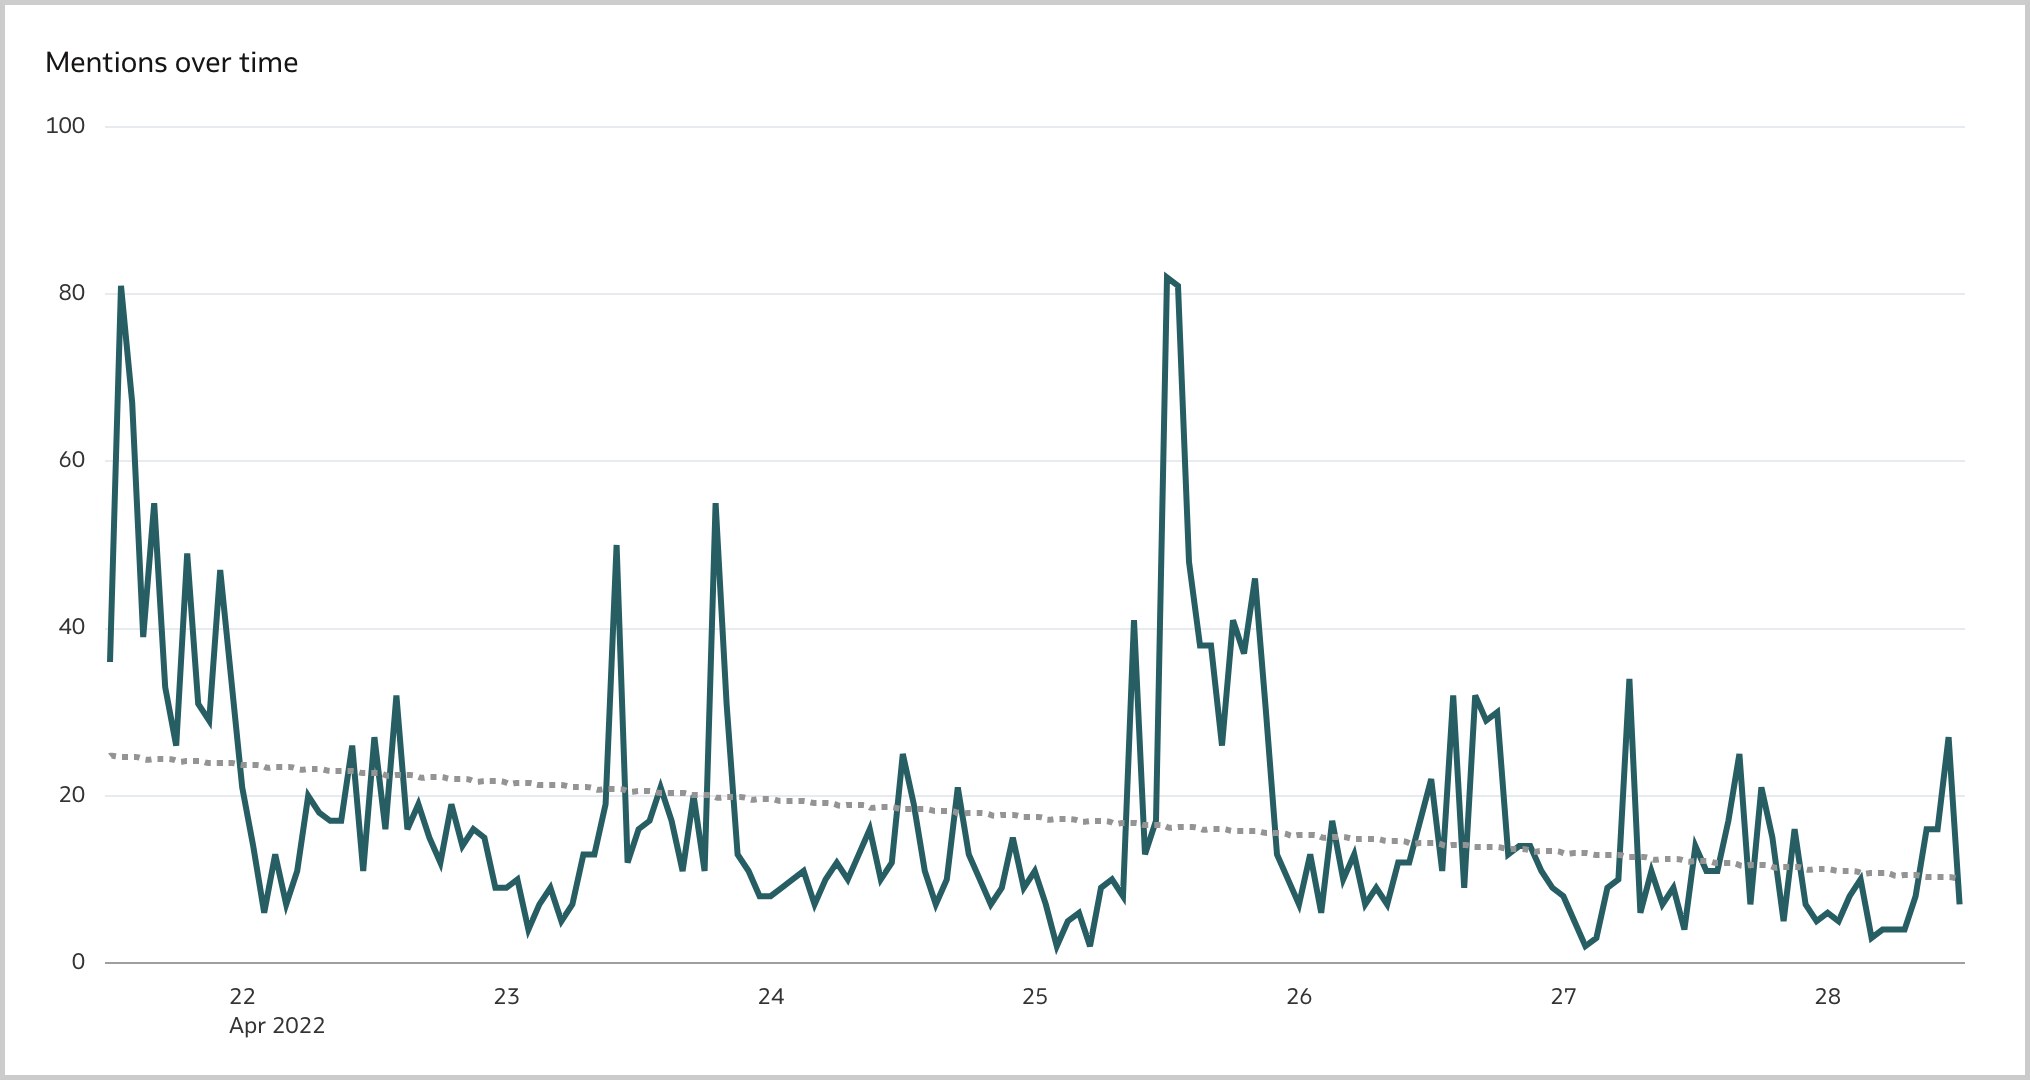
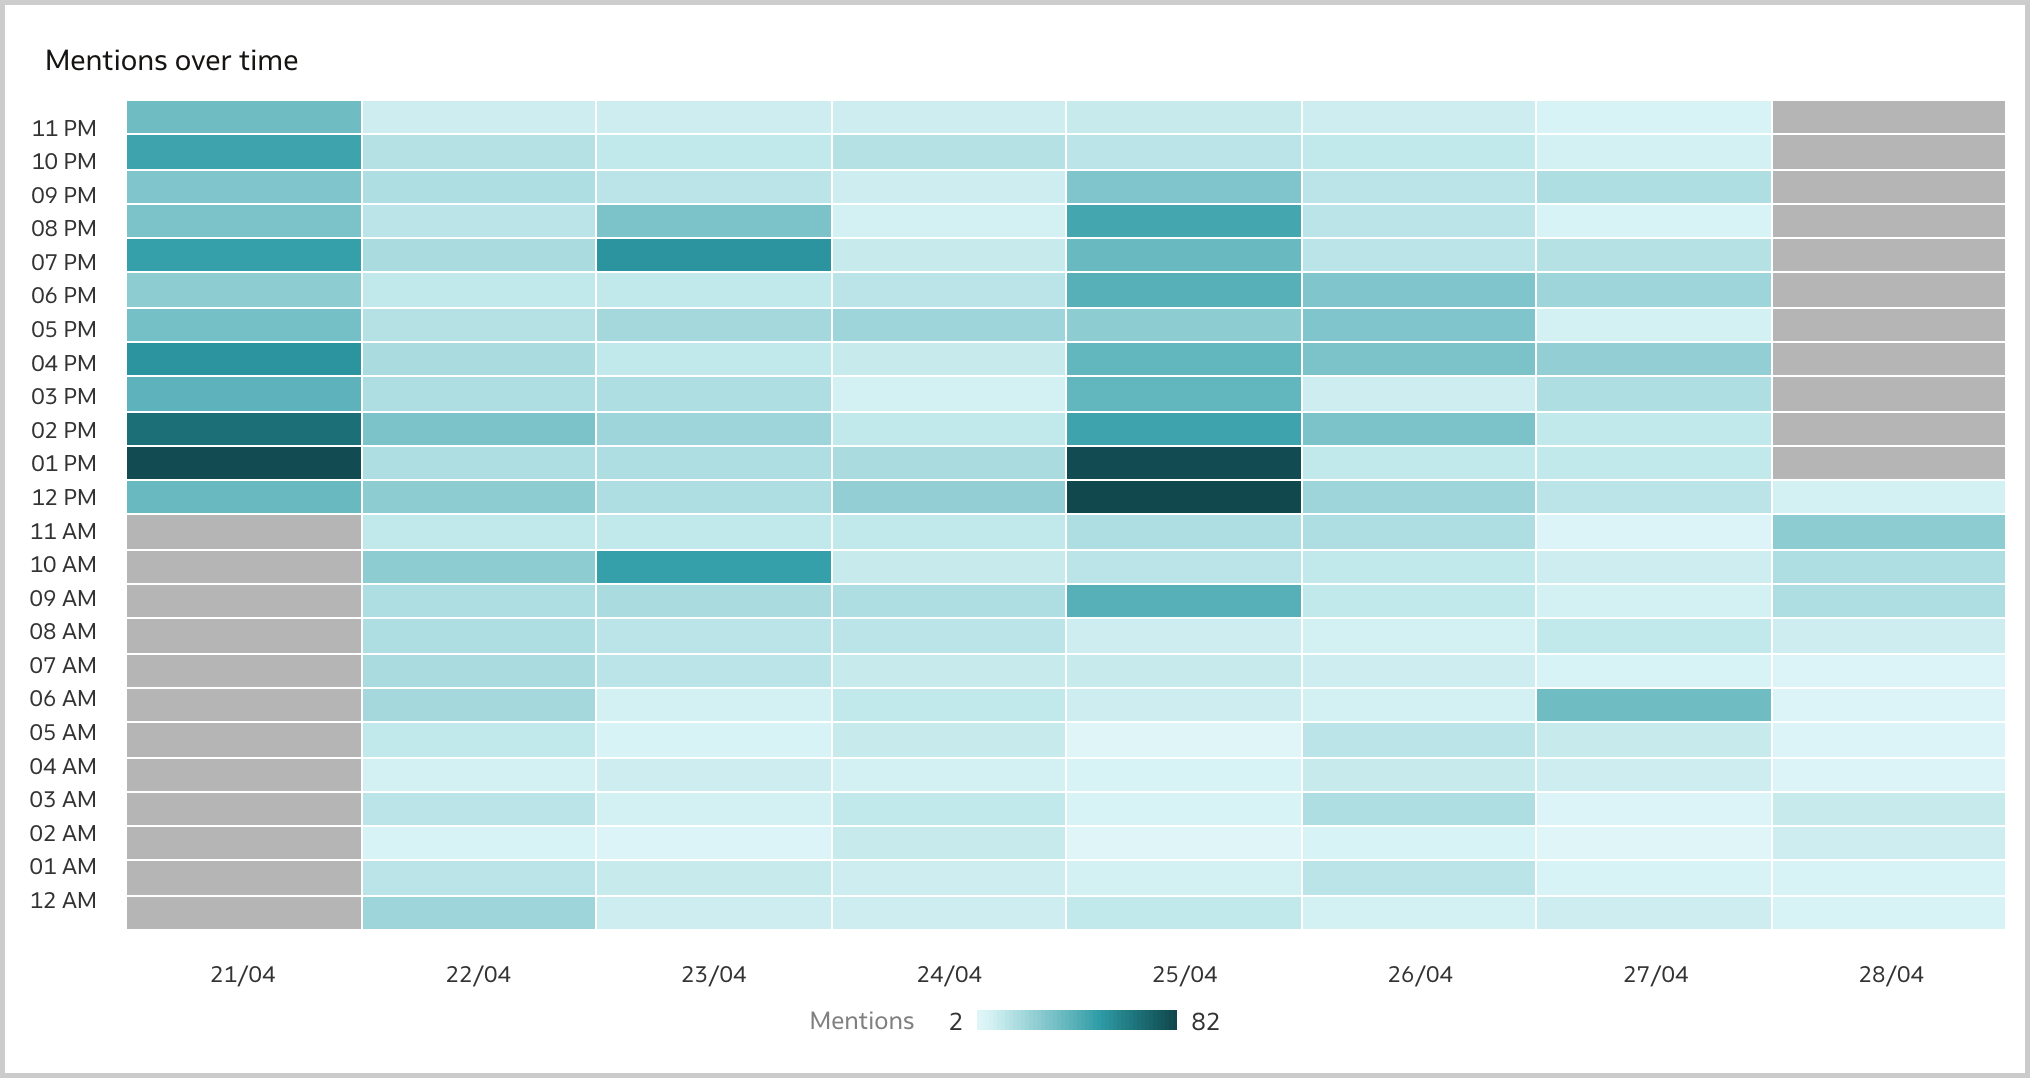
The Line visualization is the ideal way to display brand mentions (i.e., the number of tweets) over time (Figure 6). The number of mentions fluctuate with the higher peaks on the 21st of April, when eFootball 2022 Season 1 started, and on the 25th of April, when Konami made important announcements related to the game. The decreasing trend of mentions should not be cause for concern: most of the tweets are created in the afternoon/evenining while I gathered the data on the 28th of April during my lunch break (Figure 7).
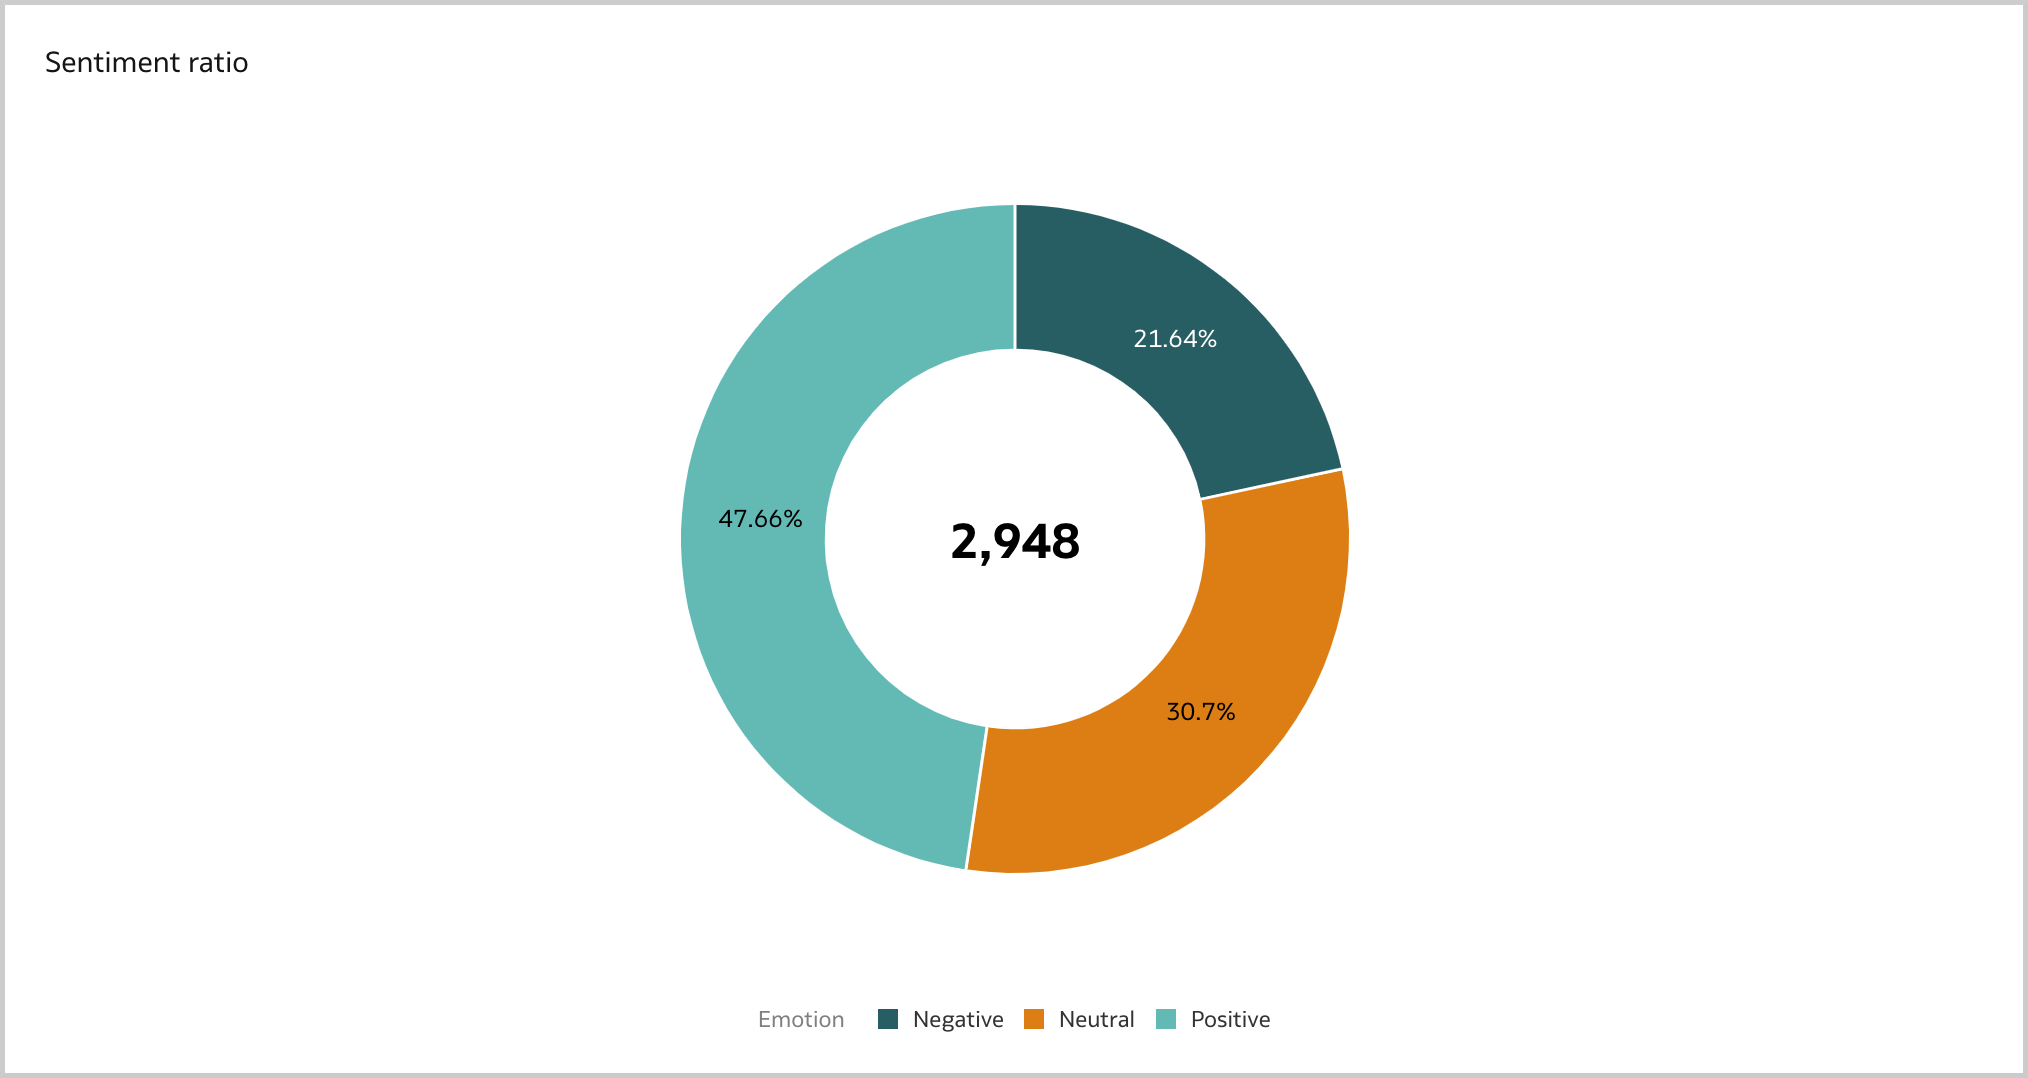
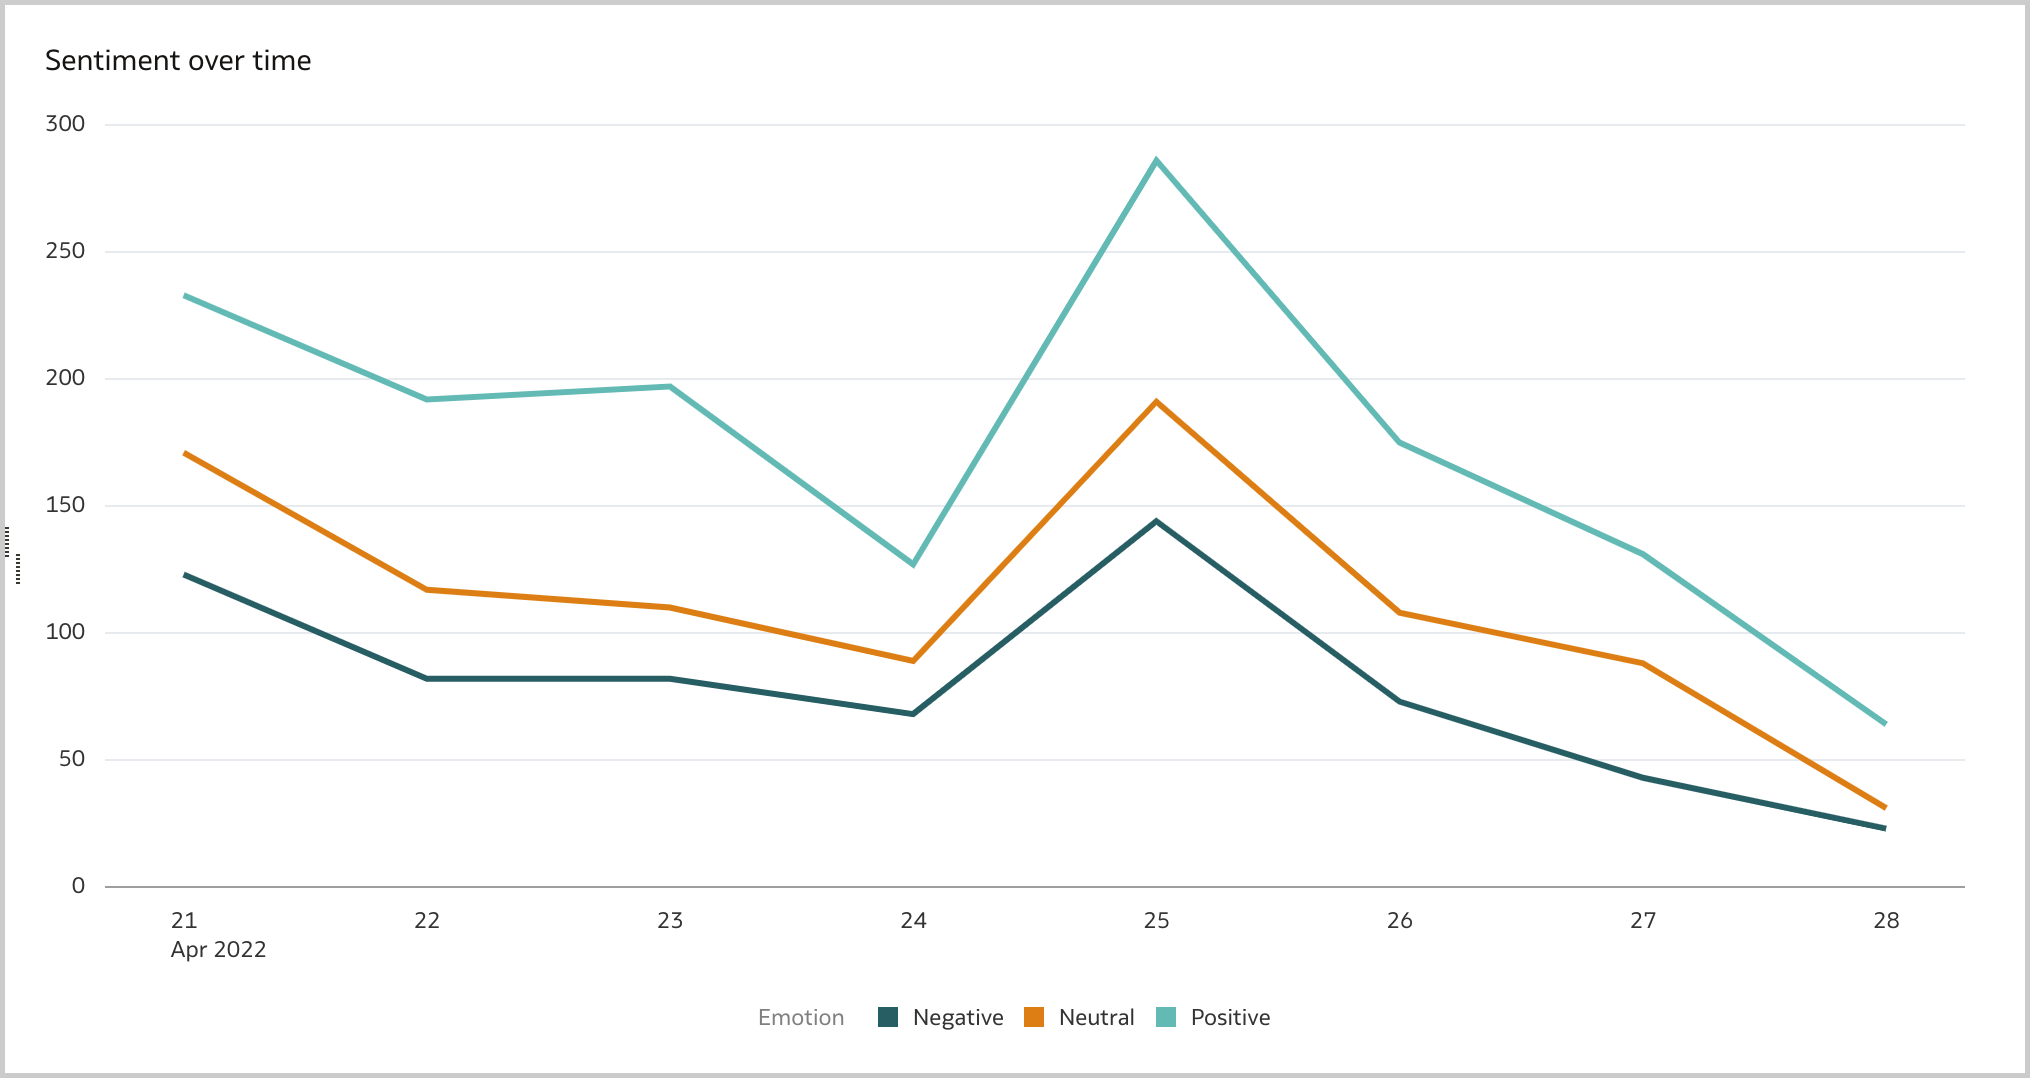
As stated previously, the sentiment analysis is crucial for a successfull brand reputation analysis. I like to analyze it either at aggregated level with a Donut visualization (Figure 8) and over time with a Line visualization (Figure 9). According to the Analyze Sentiment step 47.66% are positive and only 21.64% are negative, a big step forward compared to when the game was originally published in 2021!
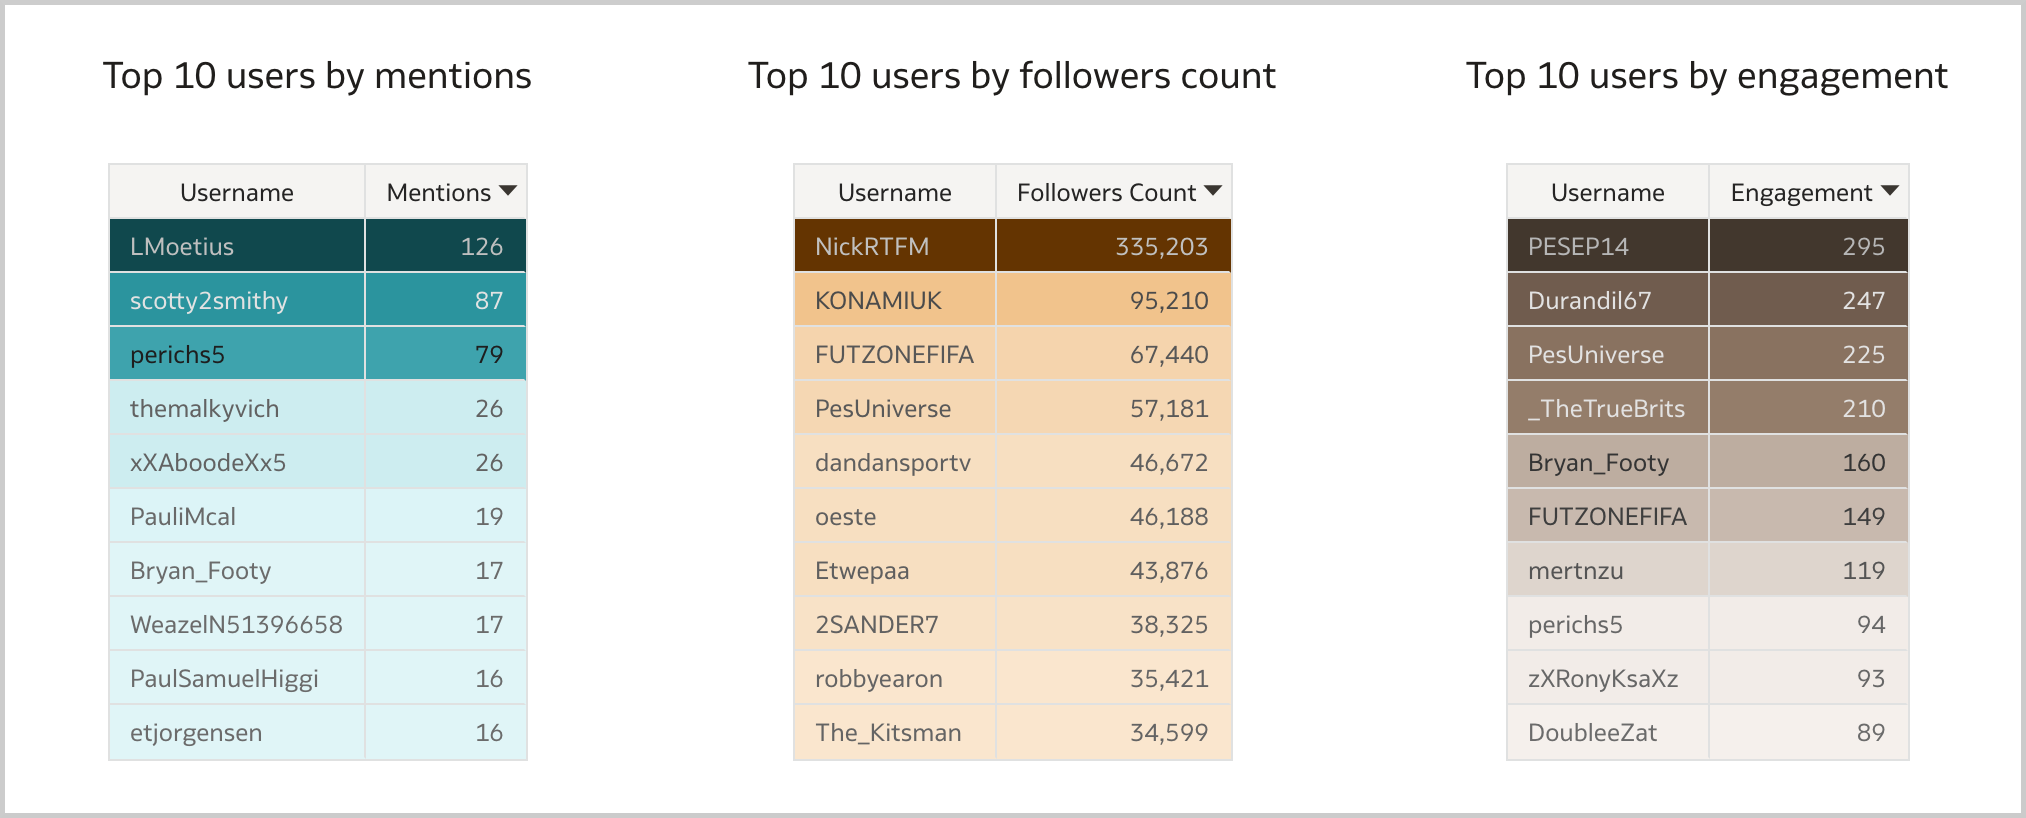
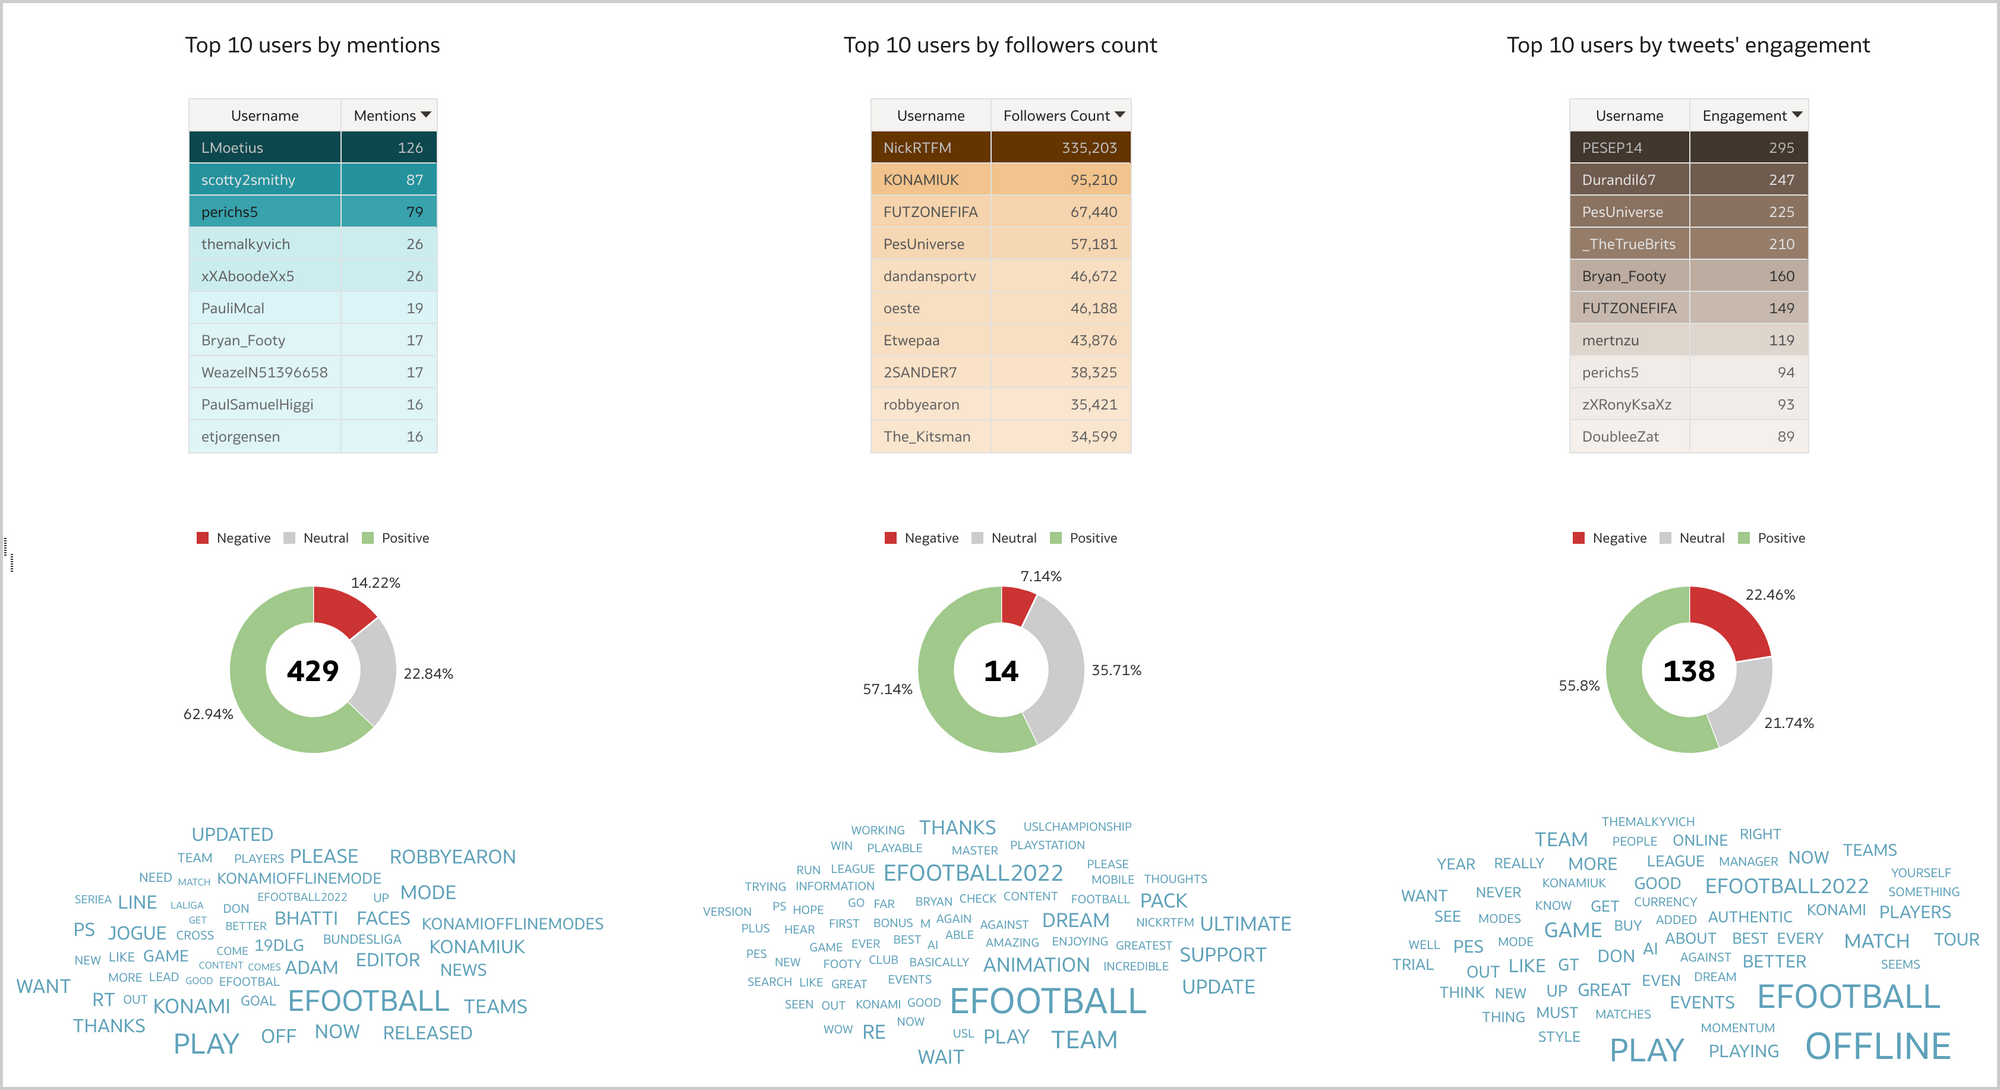
Users have a major impact on brand reputation and a good brand reputation analysis should take into account what the most relevant influencers are posting. I usually display a Table visualization of the top 10 users by mentions, by followers count and by engagement (i.e., the sum of mentions' retweets, replies, likes and quotes), and create a data action to a detailed canvas for inspecting the user's content (Figure 10).
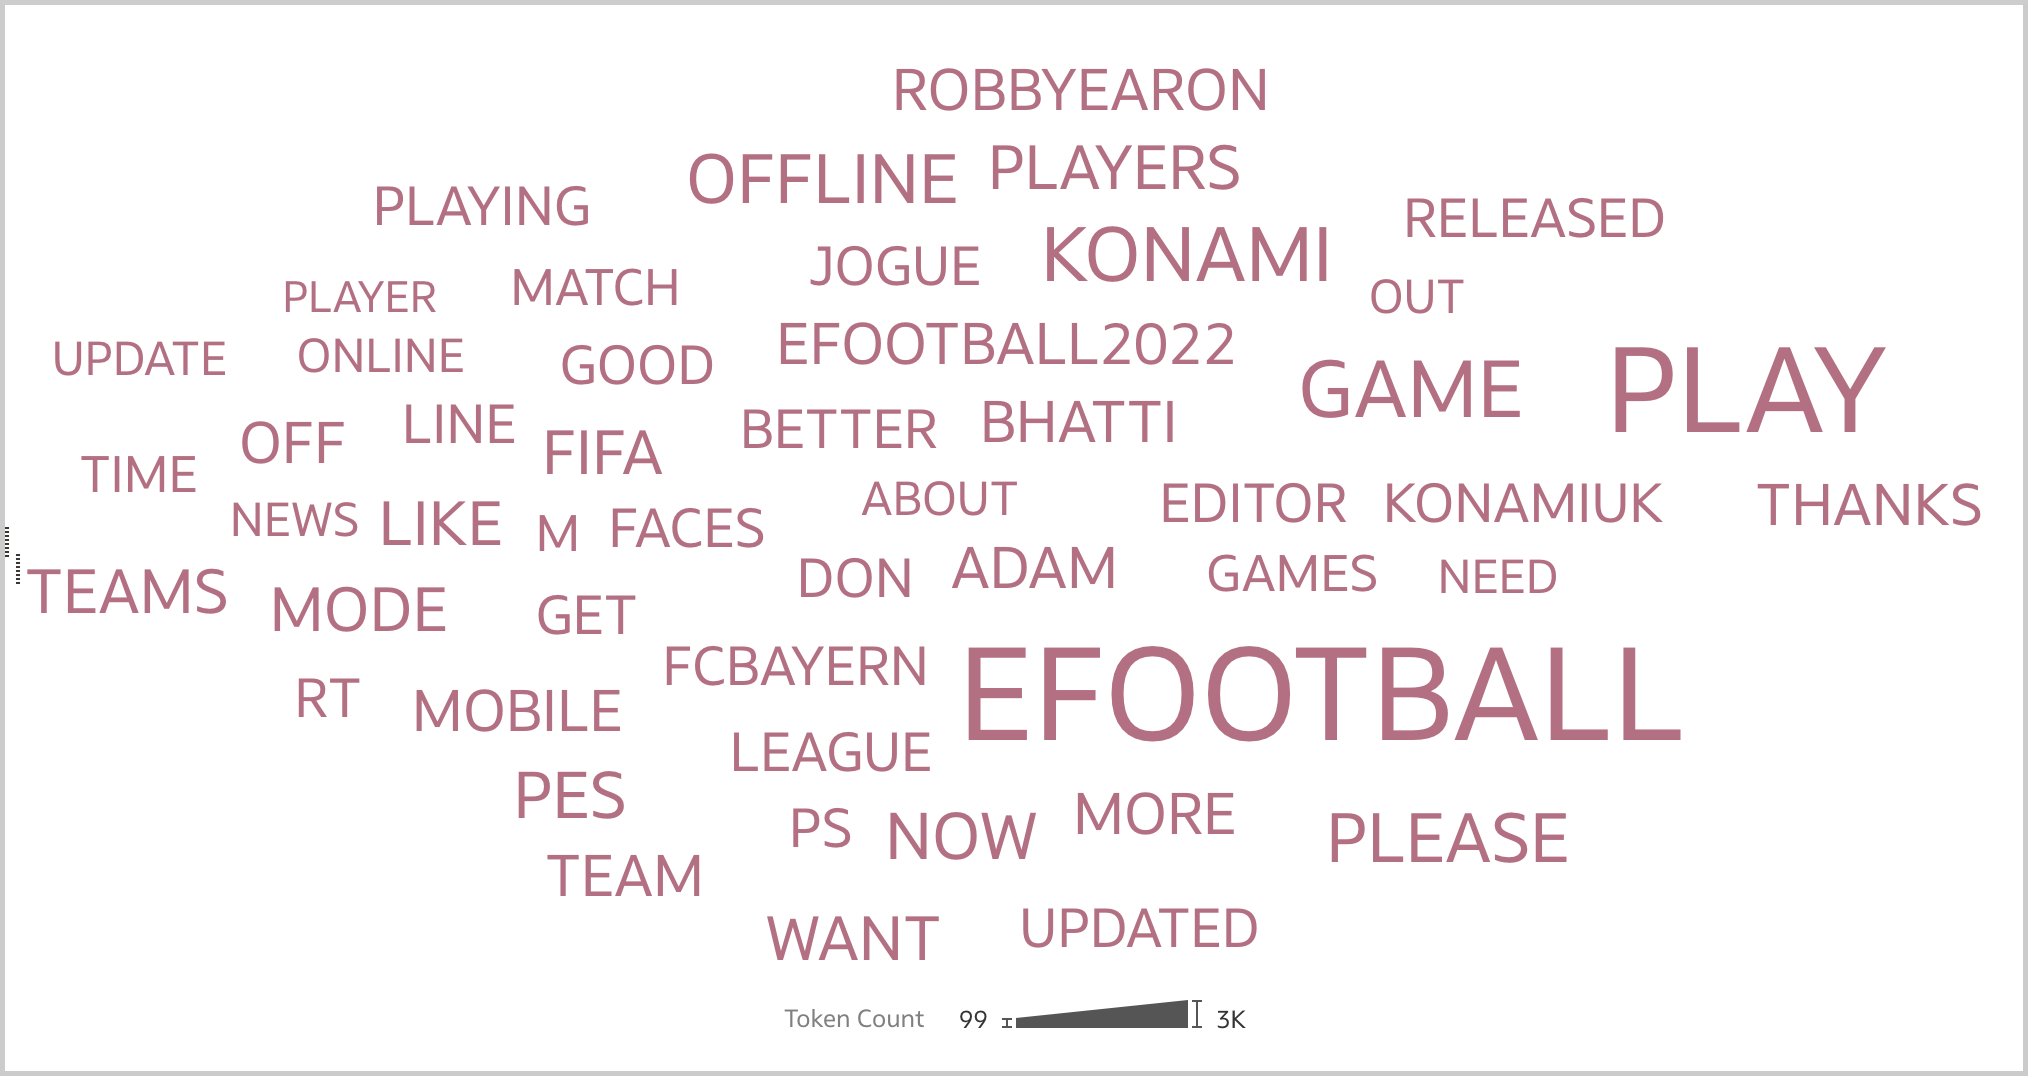
Finally, there is the Tag Cloud visualization which clearly shows what people are looking for when mentioning the brand (Figure 11).
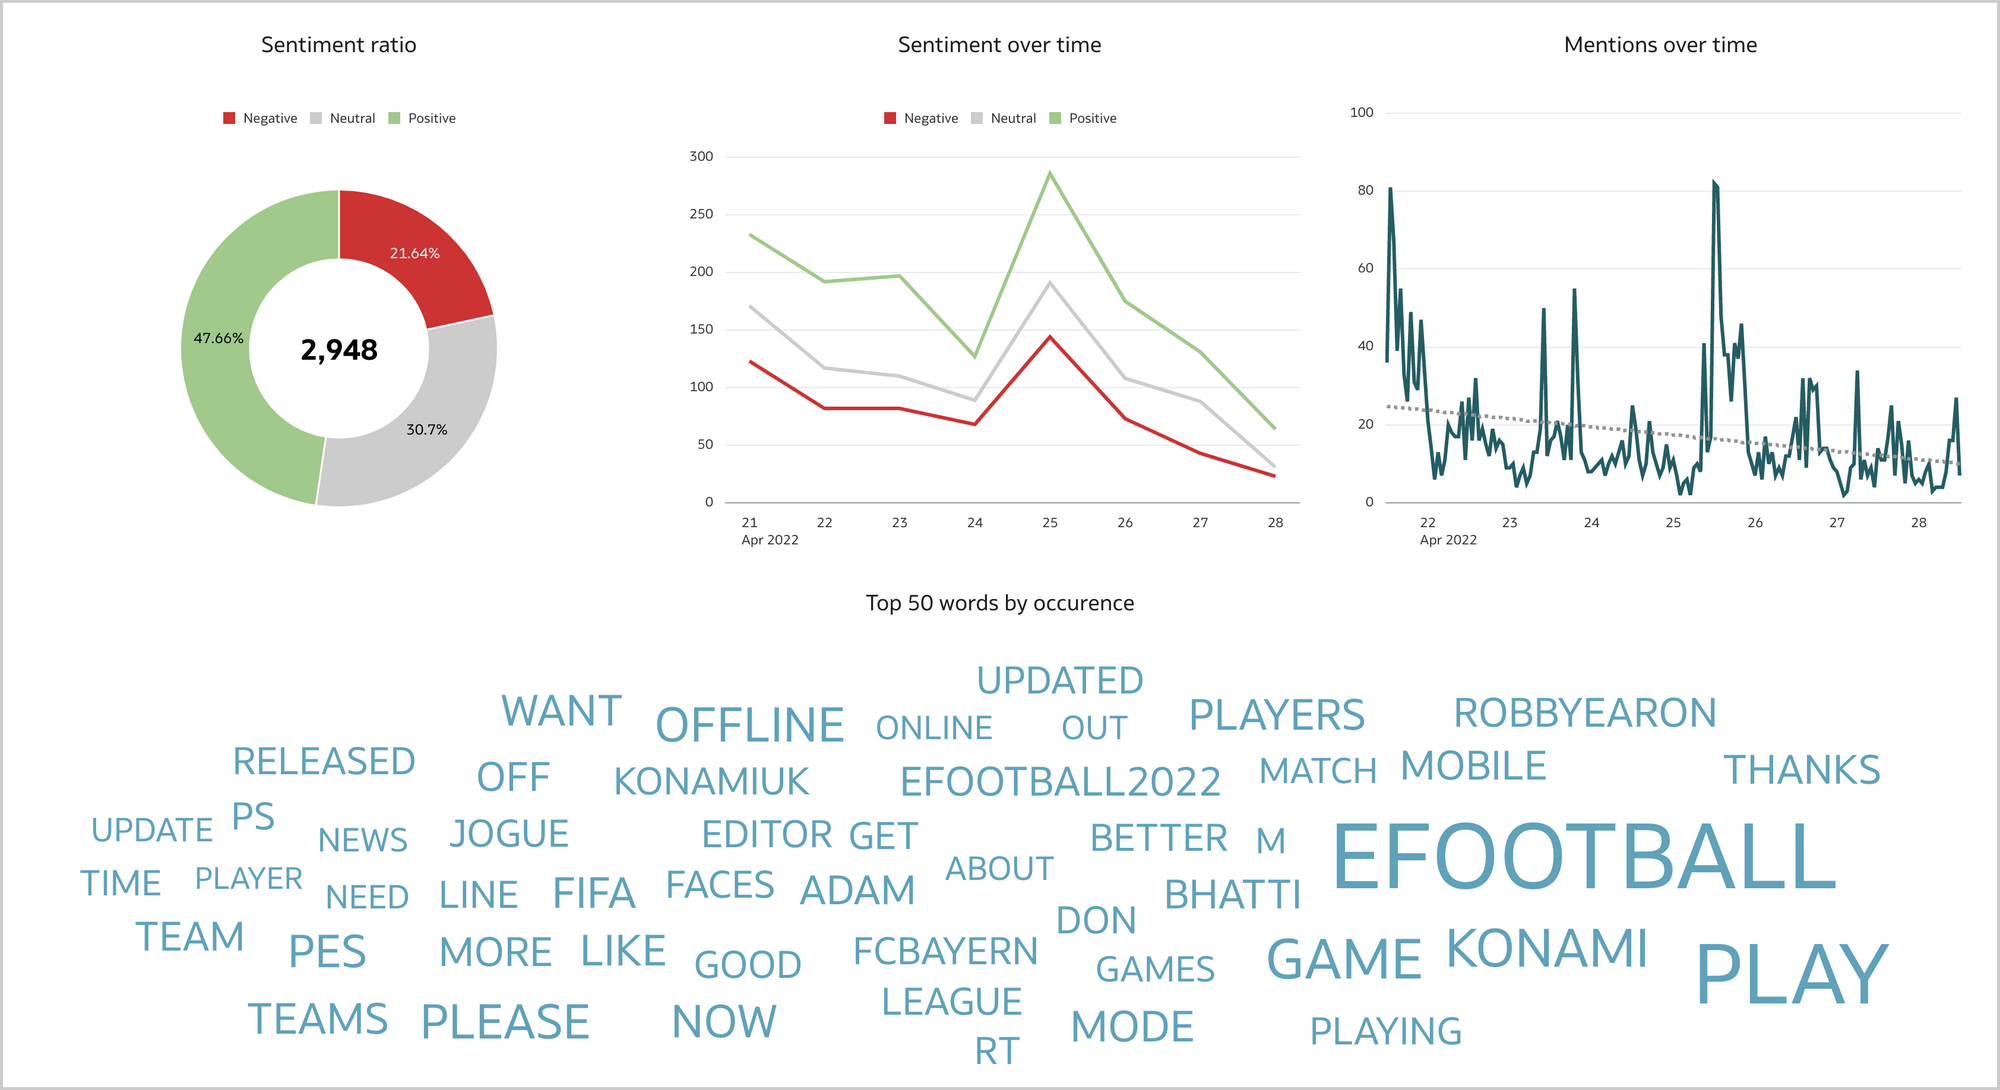
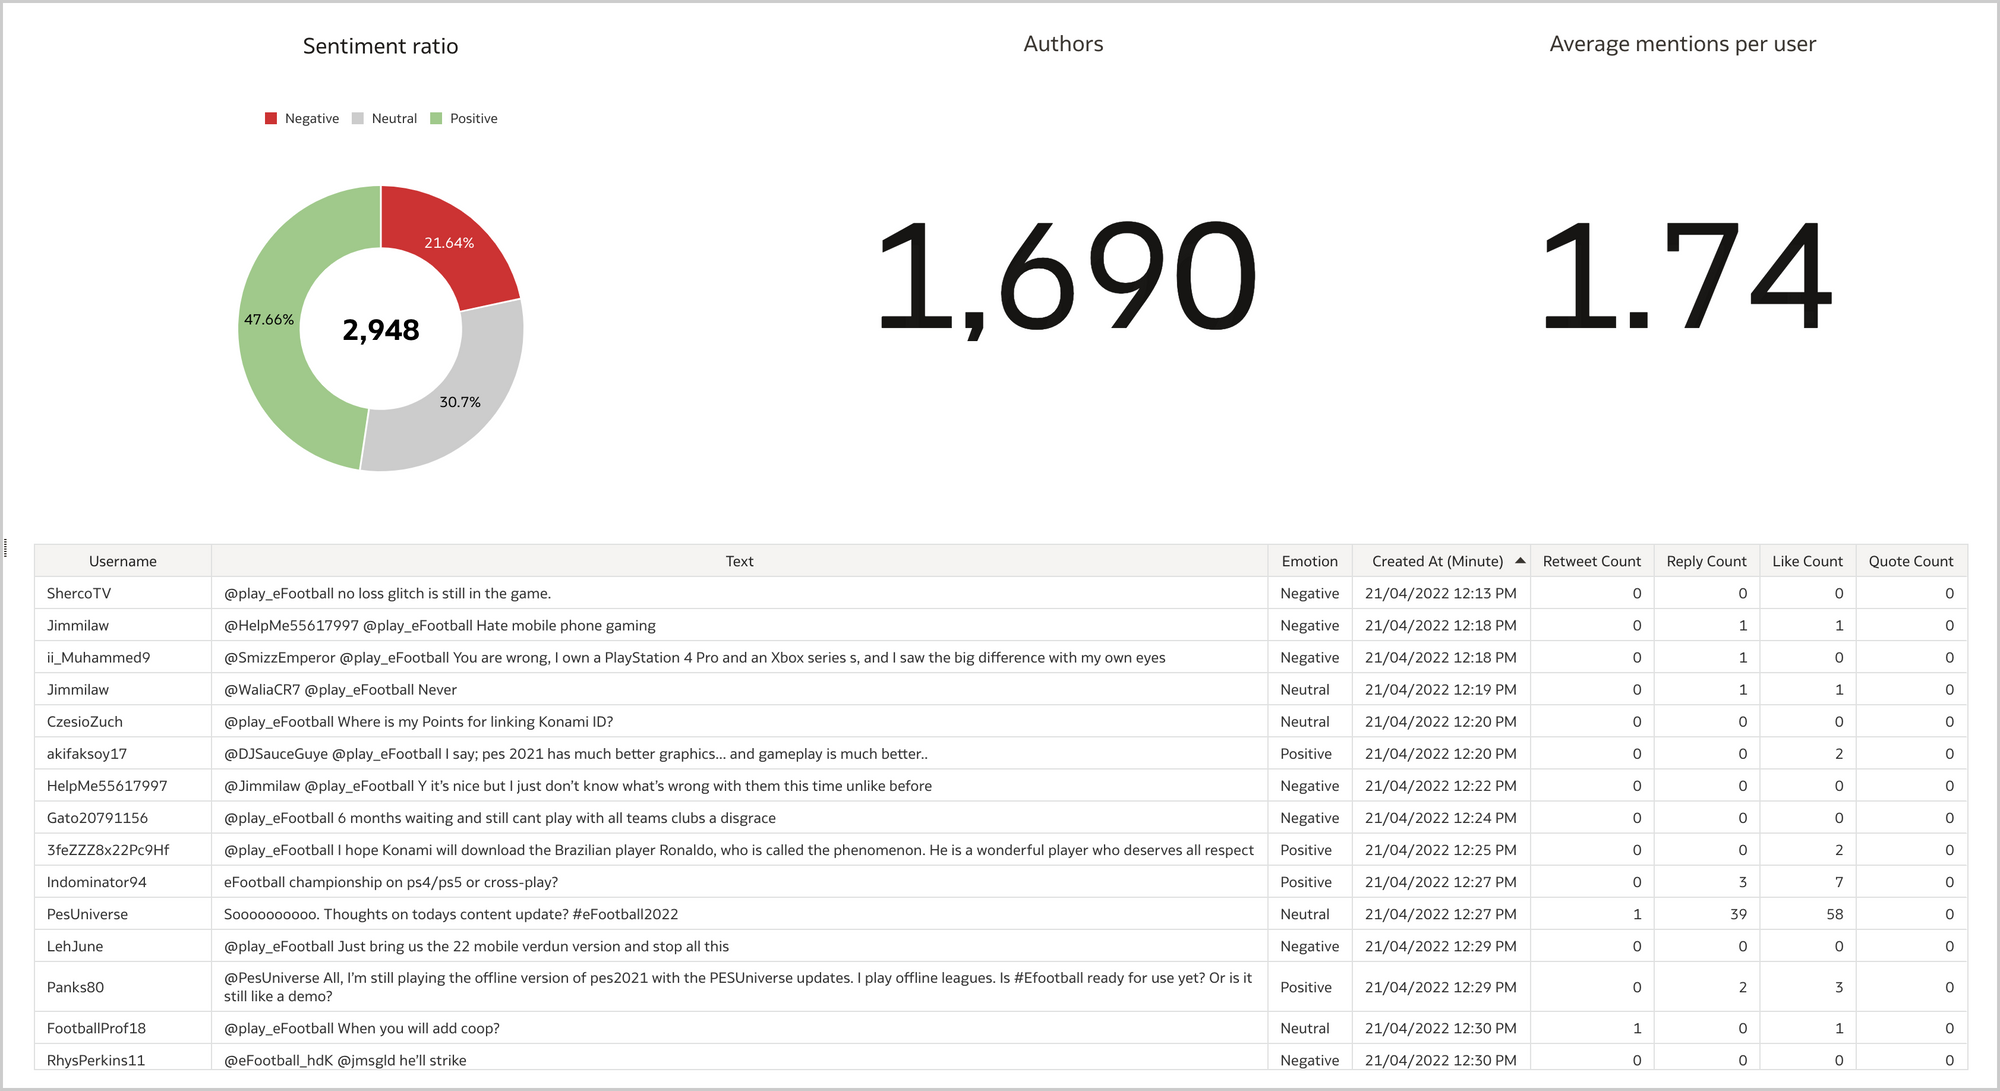
With the fundamental visualizations clear in mind, the brand reputation workbook can take shape. In the Overview canvas (Figure 12), I like to present aggregated data such as the total number of mentions, the sentiment ratio, the sentiment over time, the number of mentions over time, and the top 50 words by occurence. I can restrict the analysis to a specific emotion, a date range, a peak or a word, and see how the selection affects the other visualizations.
The Influencers canvas (Figure 13) lists the most relevant influencers alongside with the sentiment ratio and the most used words by mention, followers count and engagement. Again, I can restrict my analysis to a specific user, an emotion or a word, and see how the selection affects other visualizations.
The last canvas, Tweets (Figure 14), allows to fully inspect the content of the gathered tweets and related public metrics. Since the data in this canvas is at a very granular level, I prefer to reach it through data actions from the Overview or Influencers canvases. This allows to preserve any selection previously made (i.e., the search context) and display the details only for the tweets that I'm really interested in.
What's next?
Once the data is available in a format supported by Oracle Analytics, it takes less than an hour to build a workbook like the one described in previous sections. It's worth saying that while it represents a solid starting point for a brand reputation analysis, there is also large room for improvement:
- Manual data gathering is not the way to go in a production scenario, and the process must be automated.
- I gathered data from Twitter, but there is a wide variety of platforms people use to mention brands and all relevant sources should be monitored.
- Competitors' data should be collected to evaluate the strenghts and weaknesses of brands that are deemed to be a potential threat to your business.
Conclusion
Brand reputation nowadays is a must have intangible asset for any organization since even the small error in service can be visible to the entire world by a single tweet by that unhappy customer, and impact the business.
If you are looking into brand reputation analysis with Oracle Analytics and want to find out more, please do get in touch or DM us on Twitter @rittmanmead. Rittman Mead can help you with a product demo, training and assist within the development process.