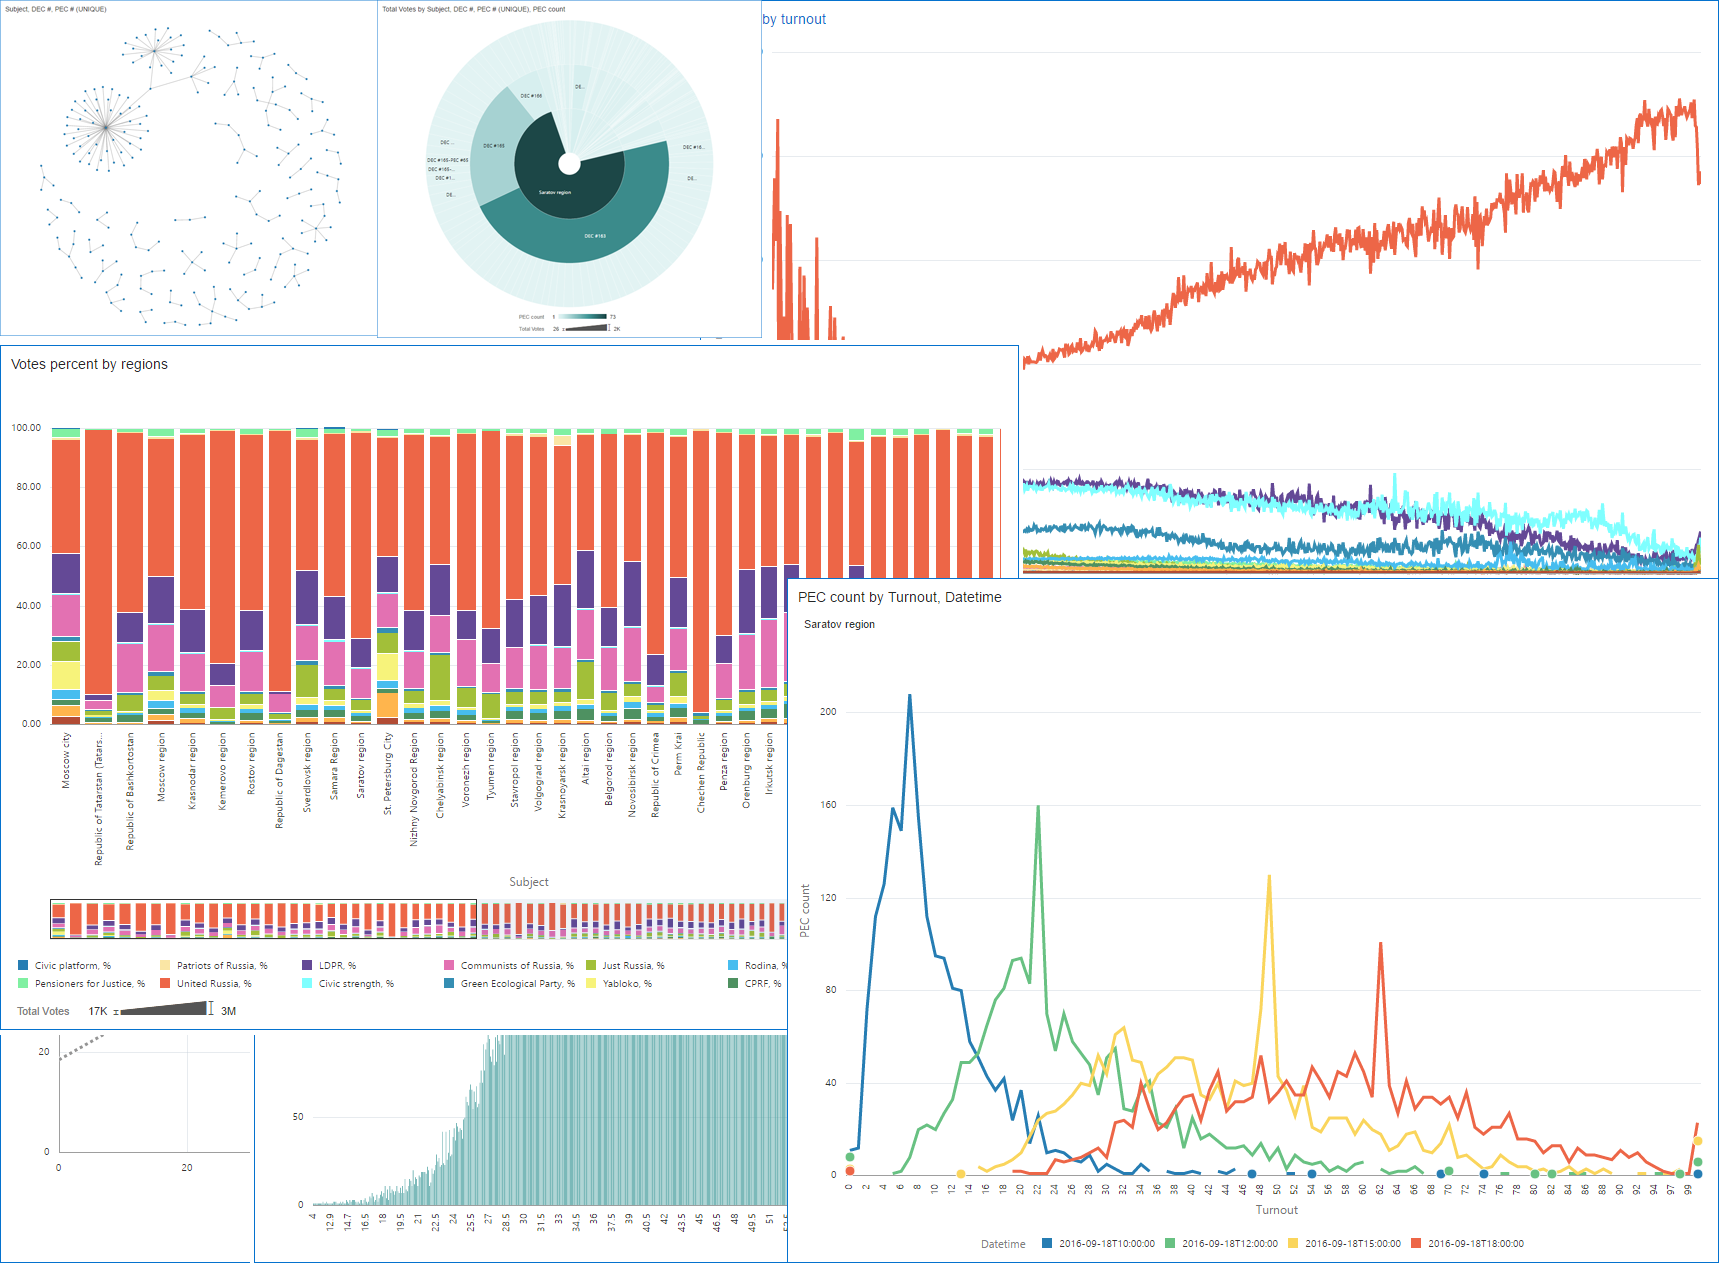
Data Preparation for "Analysing Elections Data with Oracle Data Visualisation Desktop"

In the previous post I wrote about some interesting insights we can get from the elections data. And this post concentrates on the data preparation for it. As the first one, it doesn't work as a guide and aimed to show some data manipulation things end-user can do without IT department and coding. As data preparation is not absolutely needed for the understanding of the visual part but still a piece of the story it was extracted as a separate post.
The Data
From the logical point of view I have two datasets.
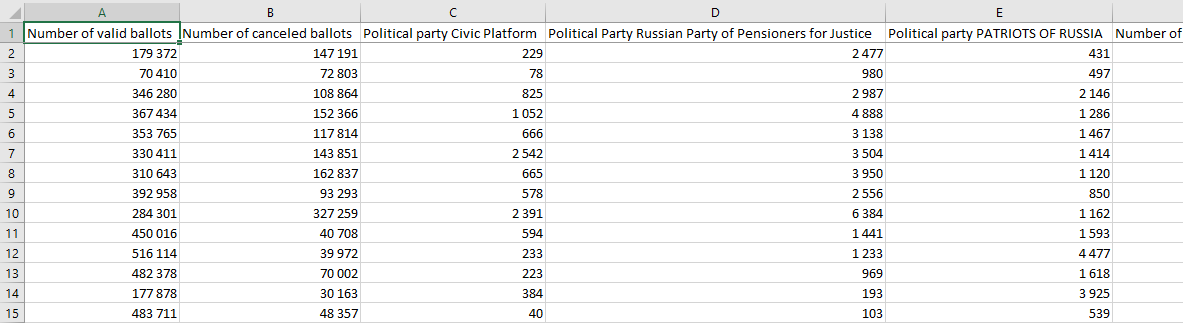
- Voting results by election commissions: number of votes for every political party and a lot of technical measures like number of registered voters, number of good and damaged voting ballots and so on.
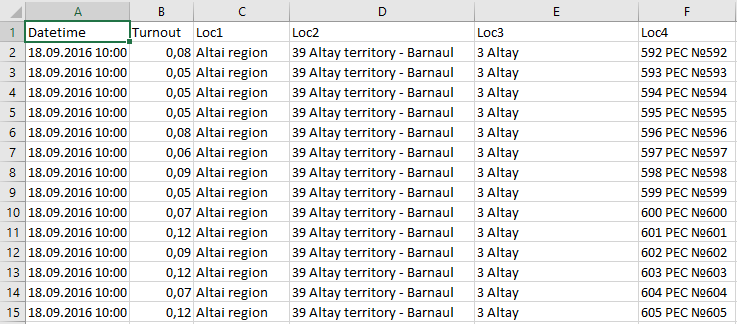
- Turnout figures at given times throughout the day.
From the physical point of view, both datasets are big files (about 500 Mb combined) each line of which is a single record. These records represent information at various levels of aggregation. I will use this fact to show some of Data flows features (great introduction from Francesco Tisiot).
Generally, each record is a JSON which looks like this:
{
 [...]
 "Data":{
  "1 | Number of voters included in the voters list at the time of the end of voting":"102",
  "2 | The number of ballots received by the precinct election commission":"102",
  "3 | The number of ballots issued to voters who voted early":"0",
  [...]
  "19 | 1 Russian political party 'Rodina'":"0",
  "20 | 2 Political party 'COMMUNISTS COMMUNIST PARTY OF RUSSIA'":"3",
  "21 | 3 Political party 'Russian Party of Pensioners for Justice'":"0",
  [...]
  },
  "Loc":[
   "Nizhny Novgorod Region",
   "129 Nizhny Novgorod Region - Nizhny Novgorod",
   "28 Krasnooktyabrskaya",
   "PEC #1148"
   ]
}
You can find a full sample of the JSON here.
Data part is a set of 32 measures and Loc is an array of one to four elements. The more detailed the record, the more elements in Loc array.
The whole votes dataset is slightly smaller than 100'000 of records. As I said, records have various levels of aggregation, and this sample shows the most detailed data (its Loc has four elements). Nizhny Novgorod Region is obviously the region, 129 Nizhny Novgorod Oblast - Nizhny Novgorod is a concatenation of district electoral commission number (129), region name (Nizhny Novgorod Region) and district electoral commission name (Nizhny Novgorod). 28 Krasnooktyabrskaya is number and name of a territorial election commission, and PEC #1148 is precinct electoral commission. For the most aggregated records Loc looks like:
"Loc":[
      "DEC #129"
   ]
This is an aggregated data for a district election commission #129.
Unfortunately, DVD doesn't work with JSON format directly. As one of the possibilities, we can use Apache Drill (for more information see previous posts by Francesco Tisiot and Robin Moffatt). Apache Drill is a supported option for Oracle DV, but it isn't an end-user tool and the story is not about building a complete and reusable system. It is about the storytelling. So I did a one-time manual conversion using Excel magic and got a plain table.
The second part of the data is turnout. In JSON form it's basically the same: one record per line, Data part with four values and Loc part based on the same principles. Data is significantly smaller and has only four values - turnout at four fixed moments. But here I need it in a more dimesional form. I want time as a dimension rather than pivoted.
In my opinion, pivot/unpivot is one more highly desired feature DVD needs. We can live without it in tools like OBIEE because its models aren't built on rapidly changing user-generated data structures, but for desktop data exploration tools like DVD powerful data transformation capabilities are crucial.
But while it isn't implemented, I made unpivot in Excel and got this.
It wasn't obvious that I need in in this particular form in the beginning of data preparation stage, but the good news is both visualisation and data manipulation live in one product, and in reality I was able to build charts, understand that I need more data/attributes/etc, add them and go back to analysis. Very smooth and clean.
I Thought We Weren’t Supposed to Use Excel?
While Data flows DVD feature is powerful and very useful there are some data manipulation tasks that Excel can do just easier or better than DVD. I hope that Oracle will improve Data flows over time but right now it’s not perfect.
I used Excel for the following:
- Splitting of long strings into fields. I could do it using
locate+substring+left+rightfunctions in DVD. But that would produce unreadable code. ExcelText to columnstool is a weapon of choice so far. UNION. When I need to combine two datasets into one, Excel’s copy and paste are beyond competition. Adding set operations (not onlyunion) will greatly improve Oracle’s tool.- A few technical tasks like translating the data. Initially, the data was not in English and I had to translate it. I could use both Excel and DVD for this task but chose Excel in order to simplify the post. But if I did it in DVD, it would be just a few more joins. Can't say what is simpler, so no clear winner here.
Note: I'm talking about static data sets. In case of a changing data that may be not true.
Data Transformations in DVD
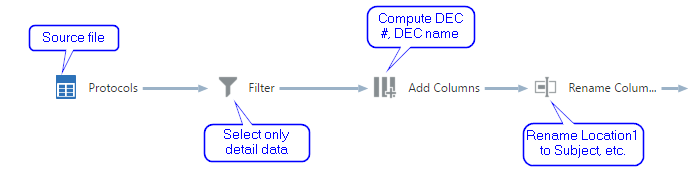
While I was able to (had to) make some of the data preparation in Excel, it's better and easier to do some tasks in DVD using relatively new Data flows feature. I will start with building a clean dictionary of electoral commissions.
When I finished my Excel part, I got this:

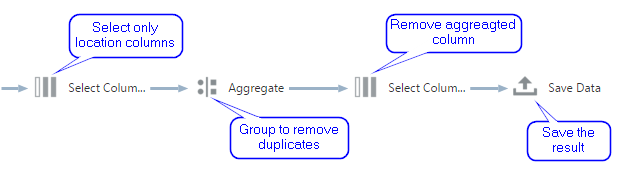
It isn't so bad, but I can make it better in a few minutes. I want to rename Location1 into Subject, split Location2 into DEC #129 and Nizhny Novgorod, remove leading digits from Location3 and rename it to TEC name, and also rename Location4 into PEC #.
Here is the data flow which does it. It may not look like the simplest thing in the world, but I spent about the same time building it as you spent reading what it does.
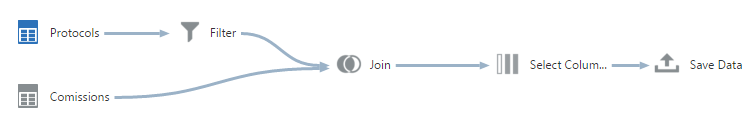
The second thing I want to do is to split my wide file with 32 measures into two. One for party results and another one for other let's say "technical" measures like number of voters, ballots and so on. It's not absolutely necessary but will please me and anyone else who will see it. Both data flows for this task use Commissions dictionary I made earlier and the same source file. I filter the source to get only the most detailed data, join with commissions, select only interesting columns and save the result. Simple and straightforward. The only difference is sets of selected columns.
I could start building visualisations with this data, but I'd prefer to calculate some relative measures. Absolute numbers won't help me because every commission has its own number of voters. We can't compare them directly but relative measures will do the trick.
Data flow for these calculations is the simplest of all.
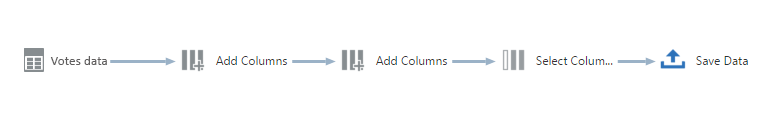
The only not immediately obvious part is why I placed two consequential Add columns steps. The first one calculates Total votes column as a sum of votes for all parties and the second one uses this column for calculation of a percentage.
And it is really cool how we can use results of different flows. I took Protocols, made Commisions, joined Protocols and Commisions and got Votes data and later made calculations based on Votes data. That was very cool.
And here I want to show how the autocomplete feature in formulas editor works (because I really like it). I hope to see it on OBIEE one day.
I have one more data flow for the turnout data, but it simply joins source file with the dictionary of commissions.
Summary
I believe Oracle DVD is a very powerful tool for a data analyst. While many users prefer to stick with Excel exclusively, DVD can significantly increase their data preparation and transformation capabilities. Even now at the very beginning of its journey DVD allows making many data manipulation operations fast and easy. It obviously worth give it a try and include into a data analysis process. Look how the data from this post may be used for analysis and making interesting conclusions: Analyse Elections with Oracle Data Visualisation Desktop.