Forays into Kafka - Logstash transport / centralisation


The holy trinity of Elasticsearch, Logstash, and Kibana (ELK) are a powerful trio of tools for data discovery and systems diagnostics. In a nutshell, they enable you to easily search through your log files, slice & dice them visually, drill into problem timeframes, and generally be the boss of knowing where your application’s at.
Getting application logs into ELK in the most basic configuration means doing the processing with Logstash local to the application server, but this has two overheads - the CPU required to do the processing, and (assuming you have more than one application server) the management of multiple configurations and deployments across your servers. A more flexible and maintainable architecture is to ship logs from the application server to a separate ELK server with something like Logstash-forwarder (aka Lumberjack), and do all your heavy ELK-lifting there.
In this article I’m going to demonstrate an alternative way of shipping and centralising your logs for Logstash processing, with Apache Kafka.
Kafka is a “publish-subscribe messaging rethought as a distributed commit log”. What does that mean in plainer English? My over-simplified description would be that it is a tool that:
- Enables one or more components, local or across many machines, to send messages (of any format) to …
- …a centralised store, which may be holding messages from other applications too…
- …from where one or more consumers can independently opt to pull these messages in exact order, either as they arrive, batched, or ‘rewinding’ to a previous point in time on demand.
Kafka has been designed from the outset to be distributed and fault-tolerant, and for very high performance (low latency) too. For a good introduction to Kafka and its concepts, the introduction section of the documentation is a good place to start, as is Gwen Shapira’s Kafka for DBAs presentation.
If you’re interested in reading more about Kafka, the article that really caught my imagination with its possibilities was by Martin Kleppmann in which he likens (broadly) Kafka to the unix Pipe concept, being the joiner between components that never had to be designed to talk to each other specifically.
Kafka gets a lot of press in the context of “Big Data”, Spark, and the like, but it also makes a lot of sense as a “pipe” between slightly more 'mundane' systems such as Logstash…
Overview
In this article we’re using Kafka at its very simplest - one Producer, one Topic, one Consumer. But hey, if it works and it is a good use of technology who cares if it’s not a gazillion message throughput per second to give us bragging rights on Hacker News
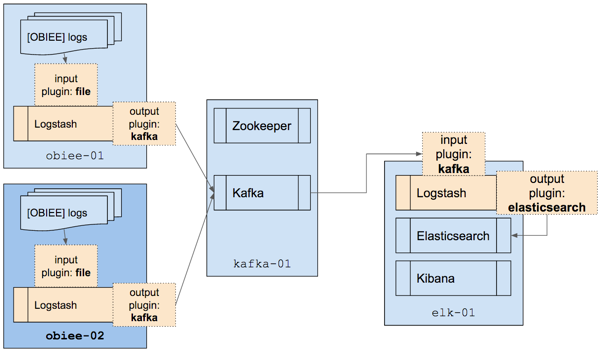
We’re going to run Logstash twice; once on the application server to simply get the logfiles out and in to Kafka, and then again to pull the data from Kafka and process it at our leisure:
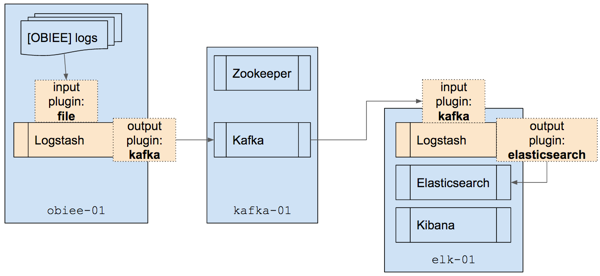
Once Logstash has processed the data we’ll load it into Elasticsearch, from where we can do some nice analysis against it in Kibana.
Build
This article was written based on three servers:
- Application server (OBIEE)
- Kafka server
- ELK server
In practice, Kafka could run on the ELK server if you needed it to and throughput was low. If things got busier, splitting them out would make sense as would scaling out Kafka and ELK across multiple nodes each for capacity and resilience. Both Kafka and Elasticsearch are designed to be run distributed and are easy to do so.
The steps below show how to get the required software installed and running.
Networking and Host Names
Make sure that each host has a hostname that is proper (not ‘demo’) and can be resolved from all the other hosts being used. Liberal use of /etc/hosts hardcoding of IP/hostnames and copying to each host is one way around this in a sandbox environment. In the real world use DNS CNAMEs to resolve the static ip of each host.
Make sure that the hostname is accessible from all other machines in use. That is, if you type hostname on one machine:
rmoff@ubuntu-03:~$ hostname
ubuntu-03
Make sure that you can ping it from another machine:
rmoff@ubuntu-02:/opt$ ping ubuntu-03
PING ubuntu-03 (192.168.56.203) 56(84) bytes of data.
64 bytes from ubuntu-03 (192.168.56.203): icmp_seq=1 ttl=64 time=0.530 ms
64 bytes from ubuntu-03 (192.168.56.203): icmp_seq=2 ttl=64 time=0.287 ms
[...]
and use netcat to hit a particular port (assuming that something’s listening on that port):
rmoff@ubuntu-02:/opt$ nc -vz ubuntu-03 9200
Connection to ubuntu-03 9200 port [tcp/*] succeeded!
Application Server - log source (“sampleappv406”)
This is going to be the machine from which we’re collecting logs. In my example it’s OBIEE that’s generating the logs, but it could be any application. All we need to install is Logstash, which is going to ship the logs - unprocessed - over to Kafka. Because we’re working with Kafka, it’s also useful to have the console scripts (that ship with the Kafka distribution) available as well, but strictly speaking, we don’t need to install Kafka on this machine.
- Downloadkafka is optional, but useful to have the console scripts there for testing
wget https://download.elastic.co/logstash/logstash/logstash-1.5.4.zip
wget http://apache.mirror.anlx.net/kafka/0.8.2.0/kafka_2.10-0.8.2.0.tgz
- Install
unzip logstash*.zip
tar -xf kafka*
sudo mv kafka* /opt

sudo mv logstash* /opt
Kafka host (“ubuntu-02”)
This is our kafka server, where Zookeeper and Kafka run. Messages are stored here before being passed to the consumer.
- Download
wget http://apache.mirror.anlx.net/kafka/0.8.2.0/kafka_2.10-0.8.2.0.tgz
- Install
tar -xf kafka*
sudo mv kafka* /opt
- ConfigureIf there’s any funny business with your networking, such as a hostname on your kafka server that won’t resolve externally, make sure you set the
advertised.host.namevalue in/opt/kafka*/config/server.propertiesto a hostname/IP for the kafka server that can be connected to externally. - RunUse separate sessions, or even better, screen, to run both these concurrently:
- Zookeeper
cd /opt/kafka*
bin/zookeeper-server-start.sh config/zookeeper.properties
- Kafka Server
cd /opt/kafka*
bin/kafka-server-start.sh config/server.properties
- Zookeeper
ELK host (“ubuntu-03”)
All the logs from the application server (“sampleappv406” in our example) are destined for here. We’ll do post-processing on them in Logstash to extract lots of lovely data fields, store it in Elasticsearch, and produce some funky interactive dashboards with Kibana. If, for some bizarre reason, you didn’t want to use Elasticsearch and Kibana but had some other target for your logs after Logtash had parsed them you could use one of the many other output plugins for Logstash.
- Downloadkafka is optional, but useful to have the console scripts there for testing
wget https://download.elastic.co/kibana/kibana/kibana-4.1.2-linux-x64.tar.gz
wget https://download.elastic.co/elasticsearch/elasticsearch/elasticsearch-1.7.2.zip
wget https://download.elastic.co/logstash/logstash/logstash-1.5.4.zip
wget http://apache.mirror.anlx.net/kafka/0.8.2.0/kafka_2.10-0.8.2.0.tgz
- Install
tar -xf kibana* unzip elastic*.zip unzip logstash*.zip tar -xf kafka*
sudo mv kafka* /opt
sudo mv kibana* /opt
sudo mv elastic* /opt
sudo mv logstash* /optKopf is an optional, but very useful, Elasticsearch admin web GUI
/opt/elastic*/bin/plugin --install lmenezes/elasticsearch-kopf
- RunUse separate sessions, or even better, screen, to run both these concurrently:
/opt/elastic*/bin/elasticsearch
/opt/kibana*/bin/kibana
Configuring Kafka
Create the topic. This can be run from any machine with kafka console tools available. The important thing is that you specify the --zookeeper correctly so that it knows where to find Kafka.
cd /opt/kafka*
bin/kafka-topics.sh --create --zookeeper ubuntu-02:2181 --replication-factor 1 --partitions 1 --topic logstash
Smoke test
- Having created the topic, check that the other nodes can connect to zookeeper and see it. The point is less about viewing the topic as checking that the connectivity between the machines is working.
$ cd /opt/kafka*
$ ./bin/kafka-topics.sh --list --zookeeper ubuntu-02:2181
logstash
If you get an error then check that the host resolves and the port is accessible:$ nc -vz ubuntu-02 2181
found 0 associations
found 1 connections:
1: flags=82<CONNECTED,PREFERRED>
outif vboxnet0
src 192.168.56.1 port 63919
dst 192.168.56.202 port 2181
rank info not available
TCP aux info availableConnection to ubuntu-02 port 2181 [tcp/eforward] succeeded!
- Set up a simple producer / consumer test
- On the application server node, run a script that will be the producer, sending anything you type to the kafka server:
cd /opt/kafka*
./bin/kafka-console-producer.sh
--broker-list ubuntu-02:9092
--topic logstash
(I always get the warningWARN Property topic is not valid (kafka.utils.VerifiableProperties); it seems to be harmless so ignore it…)This will sit waiting for input; you won’t get the command prompt back.
- On the ELK node, run a script that will be the consumer:
cd /opt/kafka*
./bin/kafka-console-consumer.sh
--zookeeper ubuntu-02:2181
--topic logstash
- Now go back to the application server node and enter some text and press enter. You should see the same appear shortly afterwards on the ELK node. This is demonstrating Producer -> Kafka -> Consumer
- Optionally, run
kafka-console-consumer.shon a second machine (either the kafka host itself, or on a Mac where you’ve runbrew install kafka). Now when you enter something on the Producer, you see both Consumers receive it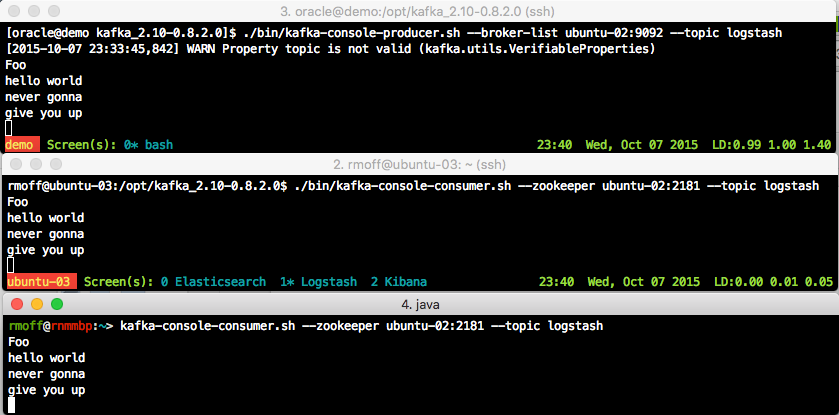
- On the application server node, run a script that will be the producer, sending anything you type to the kafka server:
If the two above tests work, then you’re good to go. If not, then you’ve got to sort this out first because the later stuff sure isn’t going to.
Configuring Logstash on the Application Server (Kafka Producer)
Logstash has a very simple role on the application server - to track the log files that we want to collect, and pass new content in the log file straight across to Kafka. We’re not doing any fancy parsing of the files this side - we want to be as light-touch as possible. This means that our Logstash configuration is dead simple:
input {
    file {
        path =>  ["/app/oracle/biee/instances/instance1/diagnostics/logs/*/*/*.log"]
    }
}

output {
    kafka {
        broker_list => 'ubuntu-02:9092'
        topic_id => 'logstash'
    }
}
Notice the wildcards in the path variable - in this example we’re going to pick up everything related to the OBIEE system components here, so in practice you may want to restrict it down a bit at least during development. You can specify multiple path patterns by comma-separating them within the square brackets, and you can use the exclude parameter to (…drum roll…) exclude specific paths from the wildcard match.
If you now run Logstash with the above configuration (assuming it’s saved as logstash-obi-kafka-producer.conf)
/opt/logstash*/bin/logstash -f logstash-obi-kafka-producer.conf
Logstash will now sit and monitor the file paths that you’ve given it. If they don’t exist, it will keep checking. If they did exist, and got deleted and recreated, or truncated – it’ll still pick up the differences. It’s a whole bunch more smart than your average bear^H^H^H^H tail -f.
If you happen to have left your Kafka console consumer running you might be in for a bit of a shock, depending on how much activity there is on your application server:
Talk about opening the floodgates!
Configuring Logstash on the ELK server (Kafka Consumer)
Let’s give all these lovely log messages somewhere to head. We’re going to use Logstash again, but on the ELK server this time, and with the Kafka input plugin:
input {
    kafka {
            zk_connect => 'ubuntu-02:2181'
            topic_id => 'logstash'
    }
}

output {
    stdout { codec => rubydebug }
}
Save and run it:
/opt/logstash*/bin/logstash -f logstash-obi-kafka-consumer.conf
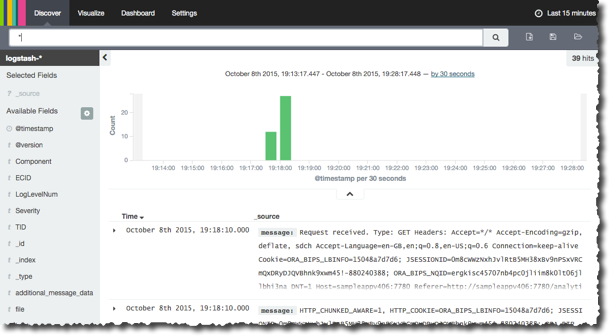
and assuming the application server is still writing new log content we’ll get it written out here:
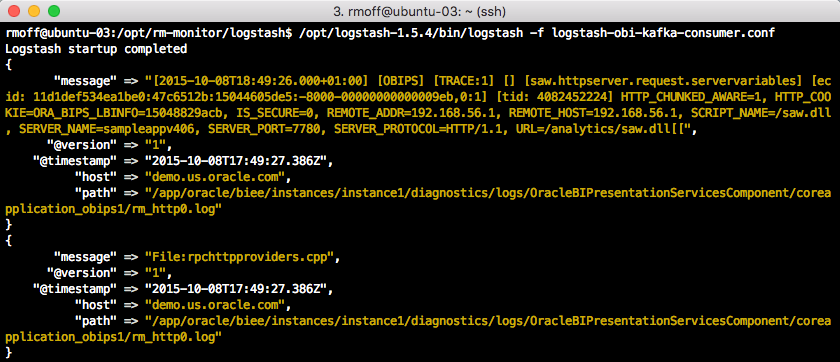
So far we’re doing nothing fancy at all - simply dumping to the console whatever messages we receive from kafka. In effect, it’s the same as the kafka-console-consumer.sh script that we ran as part of the smoke test earlier. But now we’ve got the messages come in to Logstash we can do some serious processing on them with grok and the like (something I discuss and demonstrate in an earlier article) to pull out meaningful data fields from each log message. The console is not the best place to write this all too – Elasticsearch is! So we specify that as the output plugin instead. An extract of our configuration looks something like this now:
input {
    kafka {
            zk_connect => 'ubuntu-02:2181'
            topic_id => 'logstash'
    }
}

filter {
    grok {
        match => ["file", "%{WLSSERVER}"]
        [...]
    }

    geoip { source => "saw_http_RemoteIP"}

[...]
}

output {
    elasticsearch {
        host => "ubuntu-03"
        protocol=> "http"
    }
}
Note the [...] bit in the filter section - this is all the really cool stuff where we wring every last bit of value from the log data and split it into lots of useful data fields…which is why you should get in touch with us so we can help YOU with your OBIEE and ODI monitoring and diagnostics solution!
Advert break over, back to the blog. We’ve set up the new hyper-cool config file, we’ve primed the blasters, we’ve set the “lasers” to 11 … we hit run … and …

…nothing happens. “Logstash startup completed” is the last sign of visible life we see from this console. Checking our kafka-console-consumer.sh we can still see the messages are flowing through:
But Logstash remains silent? Well, no - it’s doing exactly what we told it to, which is to send all output to Elasticsearch (and nowhere else), which is exactly what it’s doing. Don’t believe me? Add back in to the output stanza of the configuration file the output to stdout (console in this case):
output {
    elasticsearch {
        host => "ubuntu-03"
        protocol=> "http"
    }
    stdout { codec => rubydebug }
}
(Did I mention Logstash is mega-powerful yet? You can combine, split, and filter data streams however you want from and to mulitple sources. Here we’re sending it to both elasticsearch and stdout, but it could easily be sending it to elasticsearch and then conditionally to email, or pagerduty, or enriched data back to Kafka, or … you get the idea)
Re-run Logstash with the updated configuration and sure enough, it’s mute no longer:
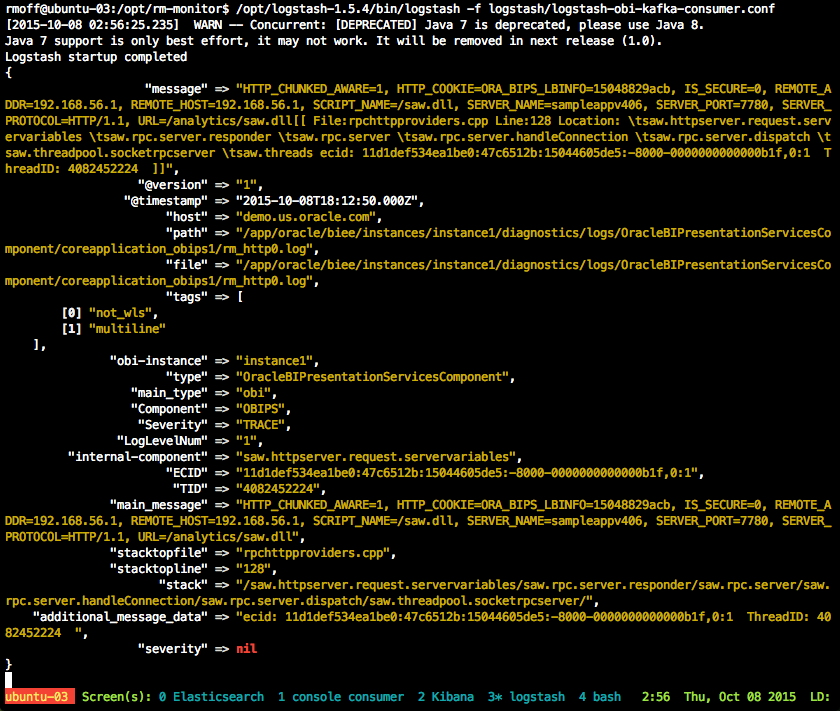
(this snippet gives you an idea of the kind of data fields that can be extracted from a log file, and this is one of the less interesting ones, difficult to imagine, I know).
Analysing OBIEE Log Data in Elasticsearch with Kibana
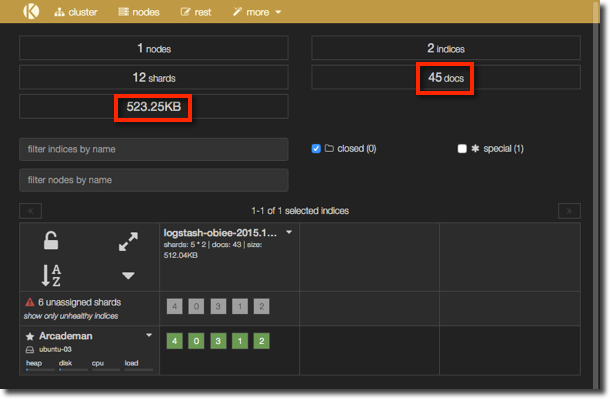
The kopf plugin provides a nice web frontend to some of the administrative functions of Elasticsearch, including a quick overview of the state of a cluster and number of documents. Using it we can confirm we’ve got some data that’s been loaded from our Logstash -> Kafka -> Logstash pipeline:
and now in Kibana:
You can read a lot more about Kibana, including the (minimal) setup required to get it to show data from Elasticsearch, in other articles that I’ve written here, here, and here.
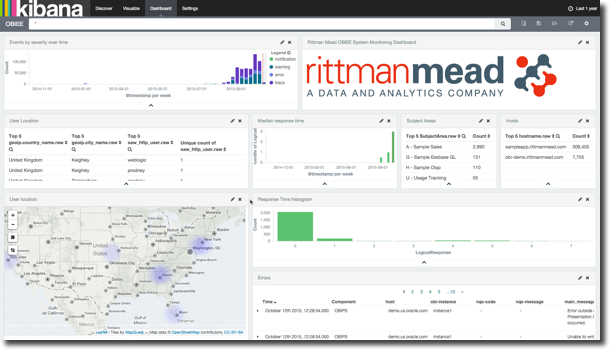
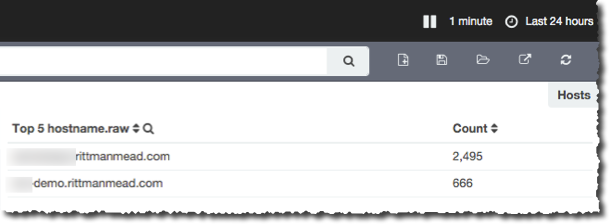
Using Kibana we can get a very powerful but simple view over the data we extracted from the log files, showing things like response times, errors, hosts, data models used, and so on:
MOAR Application Servers
Let’s scale this thing out a bit, and add a second application server into the mix. All we need to do is replicate the Logstash install and configuration on the second application server - everything else remains the same. Doing this we start to see the benefit of centralising the log processing, and decoupling it from the application server.
Set the Logstash ‘producer’ running on the second application server, and the data starts passing through, straight into Elasticsearch and Kibana at the other end, no changes needed.
Reprocessing data
One of the appealing features of Kafka is that it stores data for a period of time. This means that consumers can stream or batch as they desire, and that they can also reprocess data. By acting as a durable ‘buffer’ for the data it means that recovering from a client crash, such as a Logstash failure like this:
Error: Your application used more memory than the safety cap of 500M.
Specify -J-Xmx####m to increase it (#### = cap size in MB).
Specify -w for full OutOfMemoryError stack trace
is really simple - you just restart Logstash and it picks up processing from where it left off. Because Kafka tracks the last message that a consumer (Logstash in this case) read, it can scroll back through its log to pass to the consumer just messages that have accumulated since that point.
Another benefit of the data being available in Kafka is the ability to reprocess data because the processing itself has changed. A pertinent example of this is with Logstash. The processing that Logstash can do on logs is incredibly powerful, but it may be that a bug is there in the processing, or maybe an additional enrichment (such as geoip) has been added. Instead of having to go back and bother the application server for all its logs (which may have since been housekept away) we can just rerun our Logstash processing as the Kafka consumer and re-pull the data from Kafka. All that needs doing is telling the Logstash consumer to reset its position in the Kafka log from which it reads:
input {
    kafka {
            zk_connect => 'ubuntu-02:2181'
            topic_id => 'logstash'
            # Use the following two if you want to reset processing
            reset_beginning => 'true'
            auto_offset_reset => 'smallest'
    }
}
Kafka will keep data for the length of time, or size of data, as defined in the log.retention.minutes and log.retention.bytes configuration settings respectively. This is set globally by default to 7 days (and no size limit), and can be changed globally or per topic.
Conclusion
Logstash with Kafka is a powerful and easy way to stream your application log files off the application server with minimal overhead and then process them on a dedicated host. Elasticsearch and Kibana are a great way to visualise, analyse, and diagnose issues within your application’s log files.
Kafka enables you to loosely couple your application server to your monitoring and diagnostics with minimal overhead, whilst adding the benefit of log replay if you want to reprocess them.