How Are My Users Connecting? Analyzing OAC and OBIEE entry points


Are you managing an OAC or OBIEE instance and your life is nice and easy since you feel like having everything in control: your users browse existing dashboards, create content via Analysis, Data Visualization or SmartView and deliver data via Agents or download dashboard content to use in Excel. You feel safe since you designed your platform to provide aggregated data and track every query via Usage Tracking.
But one day you start noticing new BI tools appearing in your company that provide similar KPIs to the ones you are already exposing and you start questioning where those data are coming from. Then suddently realize they are automagically sourcing data from your platform in ways you don't think you can control or manage.
Well, you're not alone, let me introduce you on how to monitor OAC/OBIEE connections via network sniffing and usage tracking in this new world of self-service BI platforms.
A Bit of History
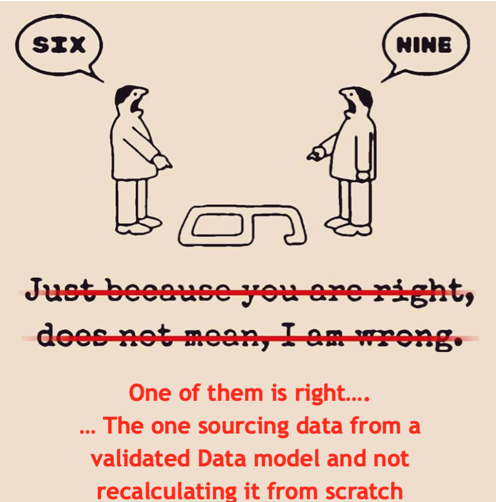
Anybody who has been for some time in the Analytics market will be able to recognise the situation described in the image above as a direct experience: multiple people having different views on a KPI calculation and therefore results. Back in the days, that problem was strictly related to the usage of Excel as BI tool and the fact that everybody was directly accessing raw data to build up their own KPIs.
Centralised BI Solutions
The landscape started to change when Centralised Enterprise BI Solutions (like OBIEE or in more recent times OAC ) started appearing and being developed in the market. The Key point of those solutions was to provide a unique source of truth for a certain set of KPIs across the organization.
However, the fact that those tools were centralised in the hands of the IT department, meant most of the times a lack of agility for the Business Departments: every new KPI had to be well defined, understood, documented, implemented by IT, validated and delivered in a process that could take months. Even when the development phase was optimised, via DevOps practices for example, time was still burned due to the communication and coordination efforts which are necessary between Business and IT teams.
Self Service BI Platforms
In order to solve the agility problem, in the last few years a new bottom-up approach has been suggested by the latest set of self-service Analytics tools: a certain set of KPIs is developed locally directly by the Business Department and then, once the KPI has been validated and accepted, its definition and the related data model is certified to allow a broader audience to use it.
Oracle has historically been a leader on the Centralised BI platform space with OBIEE being the perfect tool for this kind of reporting. In recent years, Data Visualization closed the gap of the Self-Service Analytics, providing tools for data preparation, visualization and machine learning directly in the hands of Business Users. Oracle Analytics Cloud (OAC) combines in a unique tool both the traditional centralised BI as well as the self-service analytics providing the best option for each use case.
What we have seen at various customer is a proliferation of BI tools being acquired from various departments: most of the time a centralised BI tool is used side by side with one or more self-service with little or no control over data source usage or KPI calculation.
The transition from old-school centralised BI platform to the new bottom-up certified systems is not immediate and there is no automated solution for it. Moreover, centralised BI platforms are still key in most corporates with big investments associated with them in order to get fully automated KPI management. A complete rewrite of the well-working legacy BI solutions following the latest BI trends and tools is not a doable/affordable on short-term and definitively not a priority for the business.
A Mix of The Two
So, how can we make the old and the new world coexist in a solution which is efficient, agile, and doesn't waste all well defined KPIs that are already produced? The solution that we are suggesting more and more is the re-usage of the central BI solution as a curated data source for the self-service tools.
Just imagine the case where we have a very complex Churn Prediction formula, based on a series of fields in a star schema that has been already validated and approved by the Business. Instead of forcing a new user to rewrite the whole formula from the base tables we could just offer, based on the centralised BI system, something like:
Select "Dim Account"."Account Code", "Fact Churn"."Churn Prediction" from "Churn"
There are various benefits to this:
- No mistakes in formula recalculation
- No prior knowledge of joining Condition, filtering, aggregation needed
- Security system inheritance if specific filters or security-sensitive fields were defined, those settings will still be valid.
- No duplication of code, with different people accessing various versions of the same KPIs.
Using the centralised BI system to query existing KPIs and mashing-up with new datasources is the optimal way of giving agility to the business but at the same time certifying the validity of the core KPIs.
OBIEE as a datasource
A lot of our customers have OBIEE as their own centralised BI reporting tool and are now looking into expanding the BI footprint with a self-service tool. If the chosen tool is Oracle Data Visualization then all the hard work is already done: it natively interfaces with OBIEE's RPD and all the Subject Areas are available together with the related security constraints since the security system is shared.
But what if the self-service tool is not Oracle Data Visualization? How can you expose OBIEE's Data to an external system? Well, there are three main ways:
The first one is by using web-services: OAC (OBIEE) provides a set of SOAP web-services that can be called via python for example, with one of them being executeSQLQuery. After passing the SQL in a string the results are returned in XML format. This is the method used for example by Rittman Mead Insights. SOAP Web-services, however, can't directly be queried by BI tools this is why we created Unify to allow OBIEE connections from Tableau (which is now available for FREE!).
If you aren't using Tableau, a more generic connection method that can is accessible by most of BI tools is via ODBC: OBIEE's BIServer (the component managing the RPD) can be exposed via ODBC by installing the AdminTool Drivers and creating an ODBC connection.
Please note that the ODBC method is only available if the BIServer port is not blocked by firewalls. Once the port is open, the ODBC datasource can be queried by any tool having ODBC querying capabilities.
The last method is obviously Smartview, that allows sourcing from pre-existing or the creation of new Analysis with the option of refreshing the data on demand. Smartview is the perfect choice if your target Analytical tool is one of the two supported: Excel or Powerpoint.
Good for all use-cases?
Are the above connection methods good in every situation?
The solutions described above work really well if you let OBIEE do its job: KPI calculations, aggregations, group by and joins or, in other terms, if your aim is to extract aggregated data. OBIEE is not a massive data exporting tool, if your plan is to export 100k rows (just a random number) every time then you may need to rethink about the solution since you:
- will experience poor performances since you're adding a layer (OAC) between where the data resides (DB) and yourself
- put the OBIEE environment under pressure since it has to run the query and transform the resultset in XML before pushing it to you
If that's the use case you're looking for then you should think about alternative solutions like sourcing the data directly from the database and possibly moving your security settings there.
How Can You Monitor Who is Connecting?
Let's face the reality, in our days everyone tries to make his work as easy as it can. Business Analysts are tech savvy and configurations and connection options are just a google search away. Stopping people from finding alternative solutions to accelerate their work is counterproductive: there will be tension since the analyst work is slowed down thus the usage of the centralized BI platform will decline quickly since analysts will just move to other platforms giving them the required flexibility.
Blocking ports and access methods is not the correct way of providing a (BI) service that should be centrally controlled but used by the maximum amount of people in an organization. Therefore monitoring solutions should be created in order to:
- Understand how users are interacting with the platform
- Provide specific workarounds in cases when there is a misuse of the platform
But how can you monitor user's access? Well, you really have two options: network sniffing or usage tracking.
Network Sniffing
Let's take the example of ODBC connections directly to BI Server (RPD). Those connections can be of three main types:
- From/To the Presentation Service in order to execute queries in the front-end (e.g. via analysis) and to retrieve the data
- From OBI administrators Admin Tool to modify OAC/OBIEE's metadata but this shouldn't happen in Production systems
- From End Users ODBC connections to query OAC/OBIEE data with other BI tools
In the type one connection both the sender and receiver (Presentation and BI server) share the same IP (or IPs in case of cluster), while in the second and third type (the one we are interested) the IP address of the packet sender/receiver is different from the IP of the OBIEE server.
We can then simply use a Linux network analysis tool like tcpdump to check the traffic. With the following command, we are able to listen on port 9516 (the BI Server one) and exclude all the traffic generated from the Presentation Server (IP 192.168.1.30)
sudo tcpdump -i eth0 -ennA 'port 9516' | grep -v "IP 192.168.1.30"
The following is a representation of the traffic
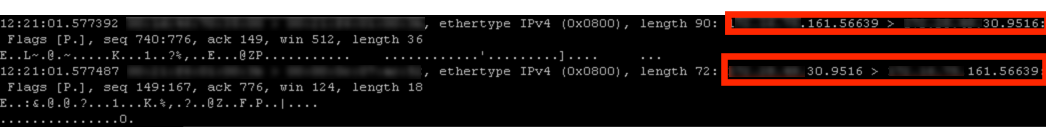
We can clearly see the traffic passing between the user's machine (IP ending with 161 and the BI Server port (IP ending with 30 and port 56639).
This is the first tracking effort and it already provides us with some information (like users IP address) however is limited to ODBC and doesn't tell us the username. Let's see now what can we get from Usage Tracking.
Usage Tracking
We wrote a lot about Usage Tracking, how to enhance and how to use it so I don't want to repeat that. A very basic description of it: is a database table containing statistics of every query generated by OBIEE.
The "every query" bit is really important: the query doesn't have to be generated by the standard front-end (analytics), but a record is created even if is coming from Smartview or with a direct ODBC access to the BIServer.
Looking into S_NQ_ACCT (the default table name) there is an interesting field named QUERY_SRC_CD that, from Oracle documentation contains
The source of the request.
Checking the values for that table we can see:
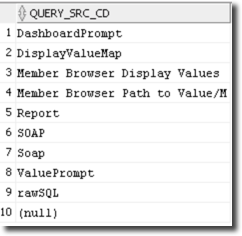
Analysing the above data in Detail
- DashboardPrompt and ValuePrompt are related to display values in Prompts
- DisplayValueMap, Member Browser Display Values and Member Browser Path to Value seem related to items display when creating analysis
- Report is an Analysis execution
- SOAP is the webservices
- rawSQL is the usage of Raw SQL (shouldn't be permitted)
So SOAP identifies the webservices, what about the direct ODBC connections? they don't seem to be logged! Not really, looking more in detail in a known dataset, we discovered that ODBC connections are marked with NULL value in QUERY_SRC_CD together with some other traffic.
Looking into the details of the Null QUERY_SRC_CD transactions we can see two types of logs:

- The ones starting with
SELECTare proper queries sent via an ODBC call - The ones starting with
CALLare requests from the Presentation Server to the BI Server
Summarizing all the findings, the following query should give you the list of users accessing OBIEE via either ODBC, SOAP or using rawSQL.
SELECT DISTINCT
  USER_NAME,
  NVL(QUERY_SRC_CD, 'RPD ODBC') SOURCE,
  TRUNC(START_TS) TS
FROM S_NQ_ACCT
WHERE
   AND
    (
     QUERY_SRC_CD IS NULL OR
     UPPER(QUERY_SRC_CD) IN ('SOAP', 'RAWSQL')
    )
   AND QUERY_TEXT NOT LIKE '{CALL%'
ORDER BY 3 DESC;
You can, of course, do more than this, like analysing query volumes (ROW_COUNT column) and Subject Areas afflicted in order to understand any potential misuse of the platform!
Real Example
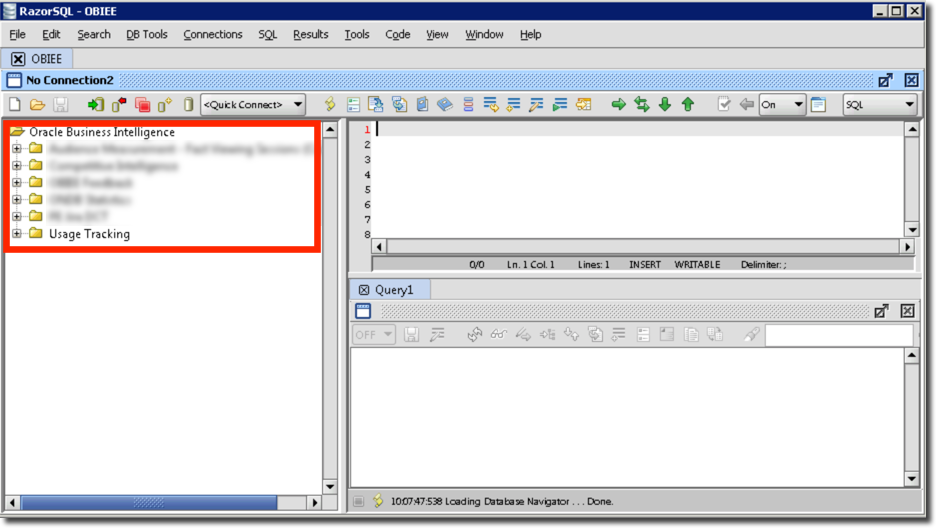
Let's see an example I'll try logging in via ODBC and executing a query. For this I'm using RazorSQL a SQL query tool and OBIEE, exactly the same logs can be found in Oracle Analytics Cloud (OAC) once the Usage Tracking is enabled so, administrators, don't afraid your job is not going to extinct right now.
Small note: Usage Tracking may be available only on non-Autonomous version of Oracle Analytics Cloud, since some parts of the setup need command line access and server configuration changes which may not available on the Autonomous version
Setup
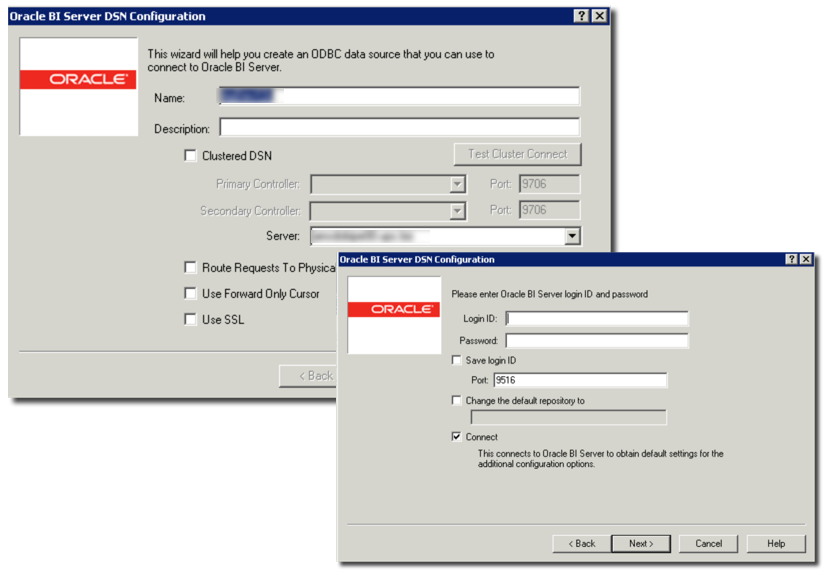
First a bit of a setup: In order to connect to OAC all you need to do is to download OBIEE's Administration Tool, install it and create an ODBC connection. After this we can open RazorSQL and add create a connection.
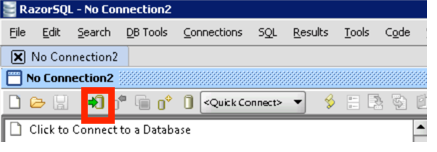
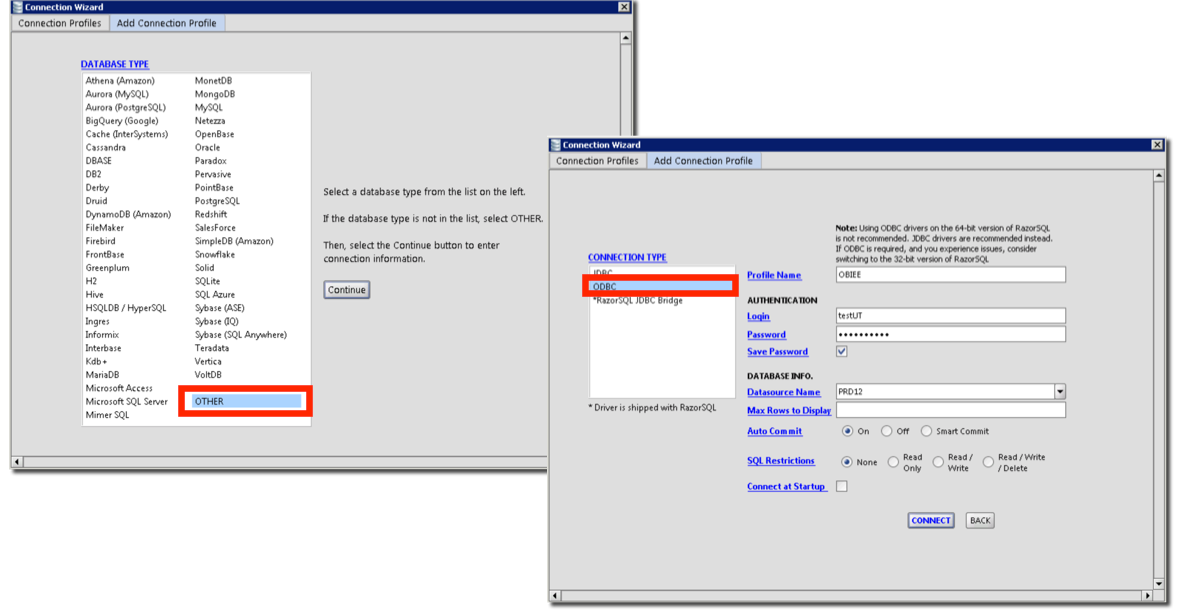
Then we need to specify our connection details, by selecting Add Connection Profile, specifying OTHER as Connection Profile, then selecting ODBC as Connection Type and filling in the remaining properties. Please note that:
- Datasource Name: Select the ODBC connection entry created with the Admin tool drivers
- Login/Password: Enter the OAC/OBIEE credentials
Querying and Checking the Logs
Then it's time to connect. As expected we see in RazorSQL the list of Subject Areas as datapoints which depend on the security settings configured in Weblogic and RPD.
The Login action is not visible from Usage Tracking S_NQ_ACCT table, it should be logged in the S_NQ_INITBLOCK if you have Init Blocks associated with the login. Let's start checking the data and see what's going to happen. First of all, let's explore which Tables and Columns are part of the Usage Tracking Subject Area, by clicking on the + Icon next to it.
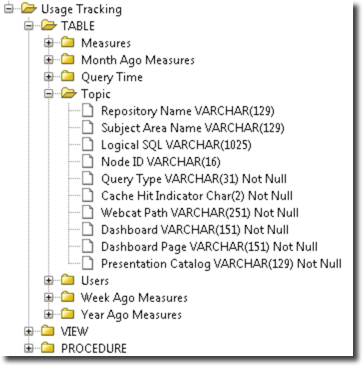
The various Dims and Facts are exposed as Tables by the ODBC driver, now let's see if this action is logged in the database with the query
SELECT USER_NAME,
  QUERY_TEXT,
  QUERY_SRC_CD,
  START_TS,
  END_TS,
  ROW_COUNT
FROM S_NQ_ACCT

We can clearly see that even checking the columns within the Measures table is logged as ODBC call, with the column QUERY_SRC_CD as Null as expected.
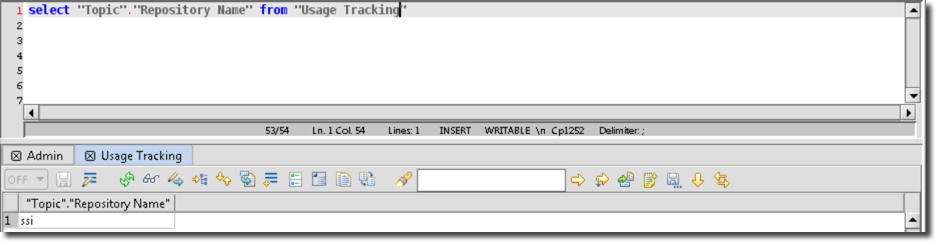
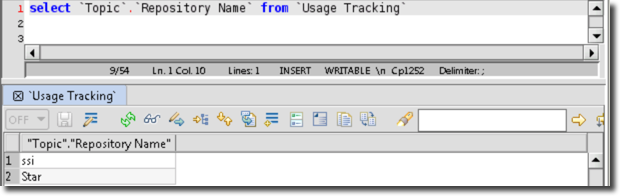
Now let's try to fire a proper SQL, we need to remember that the SQL we are writing needs to be in the Logical SQL syntax. An example can be
select `Topic`.`Repository Name` from `Usage Tracking`
Which in RazorSQL returns the row
And in the database is logged as

We can see the user who run the query, the execution time (START_TS and END_TS) as well as the number of rows returned (ROW_COUNT).
We demonstrated that we now have all the info neccessary to start tracking any misuse of OAC/OBIEE as a datasource via ODBC connections.
Automating the Tracking
The easiest solution to properly track this type of OBIEE usage is to have an Agent that on daily basis reports users accessing OAC/OBIEE via ODBC. This solution is very easy to implement since all the Usage Tracking tables are already part of the Repository. Creating an Agent that reports on Usage Tracking rows having QUERY_SRC_CD field as Null, SOAP or rawSQL covers all the "non traditional" use-cases we have been talking about.
As mentioned above sourcing aggregated data from OAC/OBIEE should be considered a "good practice" since it provides the unique source of truth across the company. On the other side, exporting massive amount of data should be avoided since end-user performances will be slow and there will be an impact on OAC/OBIEE server. Thus setting an upper limit on the number of rows (e.g. ROW_COUNT > 100k) reported by the Agent could also mean identifying all the specific data-exports cases that should drive an impact assessment and a possible solution redesign.
Conclusion
Tools and Options in the Analytical Market are exploding and more and more we'll see companies using a number of different solutions for specific purposes. Centralised BI solutions, built over the years, provide the significant advantage of containing the unique source of truth across the company and should be preserved. Giving agility to Analysts and at the same time keeping the centrality of well defined and calculated KPIs is a challenge we'll face more and more often in the future.
OAC (or OBIEE on-premises) offers the duality of both Centralised and Self-Service Analytics methods together with a variety (webservices, ODBC, Smartview) of connecting methods which makes it the perfect cornerstone of a company analytical system.
Tracking down usage, discovering potential misuse of the platform is very easy so inefficiencies can be addressed quickly to provide adequate agility and performance to all analytical business cases!