Democratize Data Science with Oracle Analytics Cloud
Oracle Analytics Cloud bridges the gap between Business Analysts and Data Scientist by providing Augmented Analytics and a easy path to Machine Learning.


In the last few weeks, I had the chance to speak both at Analytics and Data Summit held in Oracle HQ in San Francisco and OUG Norway Spring Conference 2019 on a wavy cruise between Oslo and Kiel. The underlying topic of the presentations was just one: demonstrate how Oracle Analytics Cloud can be used to bridge the gap between Business Analysts and Data Science.
Imagine: you only need to connect to the data, and the tool starts giving you suggestions on enrichments and transformations, important drivers, segments and anomalies, and an easy way to create machine learning predictions. Well, that's Oracle Analytics Cloud!
But let's start from the beginning, let's define the problem.
Problem Definition
Let's try to dive into the subject by answering a few questions.
What is Data Science? Why should I be curious about that?
Data science, as per Wikipedia, is a multi-disciplinary field that uses scientific methods, processes, algorithms and systems to extract knowledge and insights from structured and unstructured data.
Why should you be interested? Well, I'm not going to reply to this question directly, I leave it to Gartner to do that. In a recent publication, they claimed that Artificial Intelligence implementation adoption has growth by 270% in the last four years with companies implementing it raising from 10% to 37%. Data Science represents the basics of Artificial Intelligence, the spread of successful AI projects is directly related to the correct application of Data Science principles to raw or curated datasets. Again, as Gartner writes "By 2023, AI and deep-learning techniques will be the most common approaches for new applications of Data Science"
I'm a Business Analyst, I'm an expert in my field, why do I need Data Science?
I see three main drivers to answer this question:
- Complexity of the data: nowadays we are working on top of huge volumes of highly dimensional datasets. Traditional tools (like Excel) and methods (visual analysis) can't fulfil anymore the analytical needs: data is too complex to be extracted, manipulated and analyzed manually. Thus Data Science techniques and Machine Learning need to be used in the analytical routines to automate parts of the daily workflow of insights generation.
- Personal Bias: every person has a history that serves as the basis for the daily work. What if your prebuilt knowledge actually poses an obstacle to new insights discovery? With Data Science you can discover what is statistically significant in the data versus what you think it's significant.
- Future Work Opportunities: I leave this driver to an article of insidebigdata.com. The Data Scientist skillset is rare and there is a boom in demand. What are you waiting for?
I'm a Business Analyst, can't I just rebrand myself as Data Scientist?
There is no single definition of a Business Analyst and Data Scientist, it hugely depends both on prior knowledge and study as well as the context where the person is working on. However, there have been multiple attempts of defining Data Scientist skills over the years, with the below Venn diagram being quite famous, coming from drewconway.com.
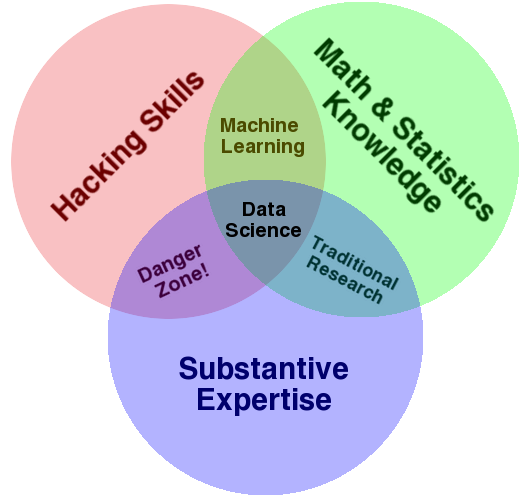
The diagram is already showing some common points and differences between the general idea of Business Analyst and the Data Scientist:
- Substantive Expertise: this skillset is a must-have in both roles. Even if Data Science standard techniques can be applied in every context, domain knowledge is required to gain better insights into the data.
- Math & Statistic Knowledge: this is the first difference, the math used in Data Science is probably more advanced than the one used in the day to day job as Business Analysts. As per datascience.com's suggestion, #1 step to go from a Data Analyst to a Data Scientist is to refresh statistics.
- Hacking Skills: this is where the biggest difference is, Data Scientist mostly uses scripting languages like R and Python which are not traditionally included in the skillset of a Business Analyst who instead uses visual tools.
Summarizing, there is quite some difference between the skillset traditionally associated with a Business Analyst and the Data Scientist one. A simple "rebranding" is not enough.
How can I empower my Business Analysts with Data Science Skills?
This is what it's called Data Science Democratization: using tools and techniques to lower the barrier to Data Science!
One of the drivers of Data Science Democratization is Augmented Analytics! Gartner defines Augmented Analytics as the Future of Data Analytics, but what is it?
Augmented Analytics
It's the concept of using Machine Learning to automate some steps of data preparation, insights discovery and sharing. Those steps are included in the Analytical platform already used by Business Analysts.
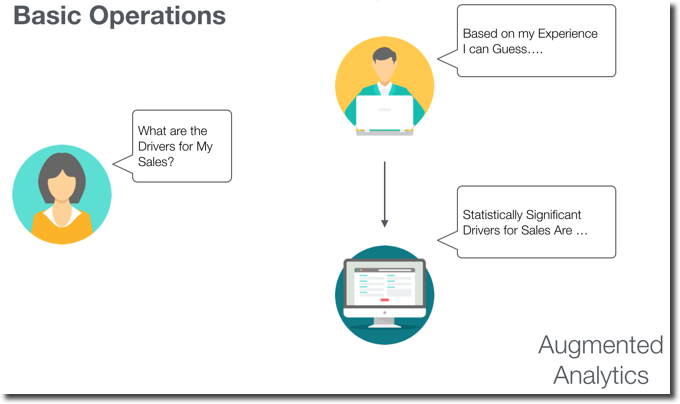
Let's see an example: the typical task of a Business Analyst is to find the significant drivers of Sales. With the usual flow based on BA's prior knowledge: the experience was driving the analysis and thus insight generation. However, how we discussed before, this brings a personal BIAS that could stop BA from understanding new and hidden patterns. What if the analytical platform itself suggests, based on the dataset, what are the statistically significant drivers? Those drivers can then be verified by the Business Analyst and maybe generate new insights.
Low-code Machine Learning
The second trend in Data Science Democratization is empowering Business Users to create low-code Machine Learning models, in the same GUI-driven tool they use for their day-to-day job.
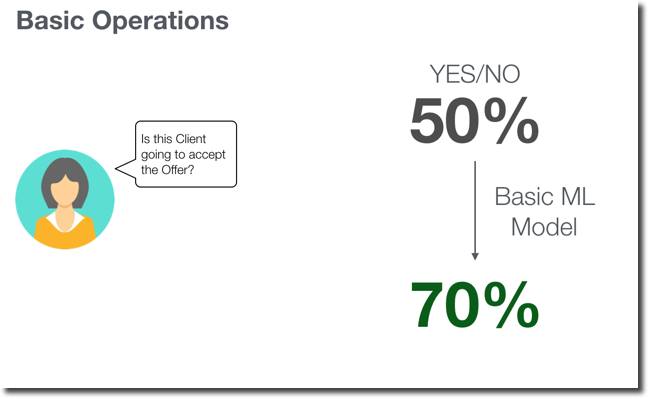
Let's see another example: if a Business Analyst wants to classify a client based on the fact that he'll accept an offer. With no prior knowledge, he starts from a 50/50 position (50% chance he will say yes or no). The traditional approach was either personal-experience based (with the related Bias problem) or the involvement of a Data Scientist. What if, instead, with a series of simple, visual and repeatable steps he could create an ML model correctly predicting 70% of the customers accepting the offer? The model will not be perfect but still giving the option to focus the calls to the clients more likely to accept the offer, generating potentially a 20% increase in sales.
How Oracle Analytics Cloud Bridges the Gap to Data Science?
Oracle Analytics Cloud offers a series of features enabling Data Science, I've been blogging about them in 2018 when they were first published. Let's see now how a Data Science process could be executed with OAC.
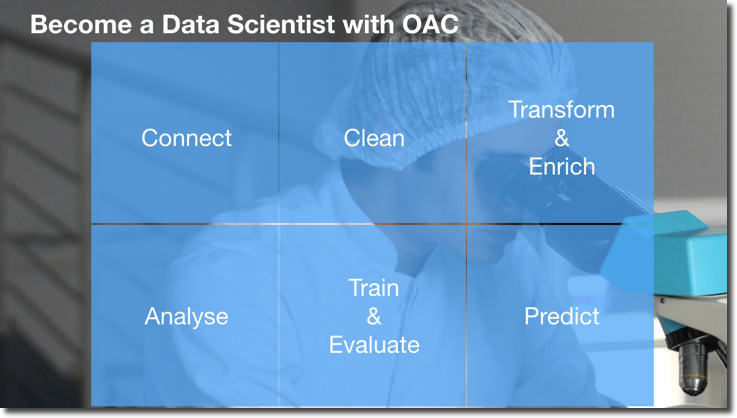
Step #0: Problem Definition
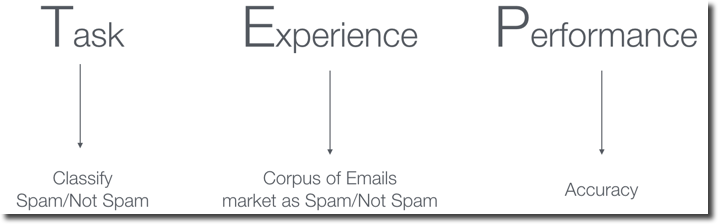
The basic step in Data Science (not in the picture above) actually doesn't require any tool: it's the Problem Definition. There is no general purpose Data Science! We need to define precisely what problem we're going to solve. A good approach is to define using TEP: Task, Experience and Performance.
- Task represents the problem we're trying to solve: Classify Spam/Not-Spam, predict the temperature in the room
- Experience represents the historical background that we'll use: Corpus of emails already classified as Spam/Not-Spam, history of hourly room temperatures
- Performance is the metric we are using to understand how good/bad our prediction is. There is a multitude of metrics we can use, depending on the type of problem we are trying to solve. The metric(s) selection will guide the decisions in our Data Science process.
Step #1: Data Connection
This is the first step in the tool itself, and, I believe, very familiar for any Business Analyst working with Oracle Analytics Cloud. OAC provides users with the ability to connect to:
- Curated Subject Areas coming from a prebuilt repository in the hands of the IT department where data is sourced, modelled and exposed following precise business logic and KPI definitions. The importance of a central curated data repository is detailed here
- Raw Data Sources: do you have data in Excel, MongoDB, Kafka, Dropbox? No problem, OAC allows you to connect to it and start analysing within few clicks! All you need is specifying the connection URL, credentials and parameters.
- Both: do you want to mix curated KPIs with data coming from a variety of datasets? OAC covers this case by allowing you to mash them up!

Step #2: Clean
Data cleaning, I guess many Business Analysts are already familiar with this. What are, on the other hand, the typical cleaning steps a data scientist performs?
The usual steps are the following
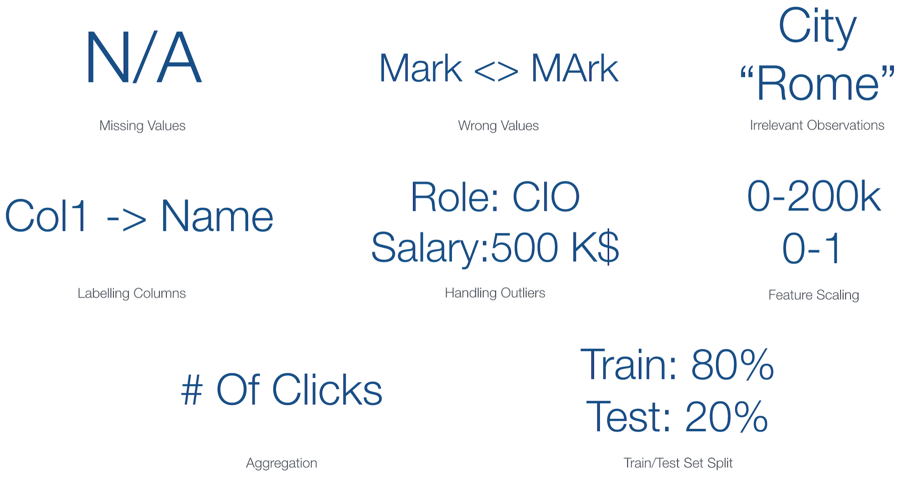
- Handle Missing Values: What does a missing value mean? How should I treat it? Understanding and handling missing values are fundamental since it could enhance our comprehension of the dataset. Should I remove samples with missing values? Should I substitute them with a default value? The response depends on the value meaning.
- Correcting Wrong Values: Free Text, easy to implement, a nightmare to fix! In the example above the same content,
MARKis written in two different ways (capital and lower caseA). For a human eye, the two values are the same, but for a computer, they'll belong to two different classes. If we want to optimise the output of our model, we should optimise the inputs by correcting the wrong values. - Remove Irrelevant Observation: If we are trying to do predictions on the city of Milan in Italy, are the observations of Rome relevant? Or the ones from Milan in Michigan, USA? If not we should remove them because the following Machine Learning model a) could learn behaviours which are not relevant b) the related process will run faster since it will need to handle less data
- Labelling Columns: especially when connecting to raw datasources we can't expect to have proper naming of the columns. E.g. Col1 is containing ClientName. The Machine Learning Tools will probably don't care about column names, but you do in order to explain their behaviour.
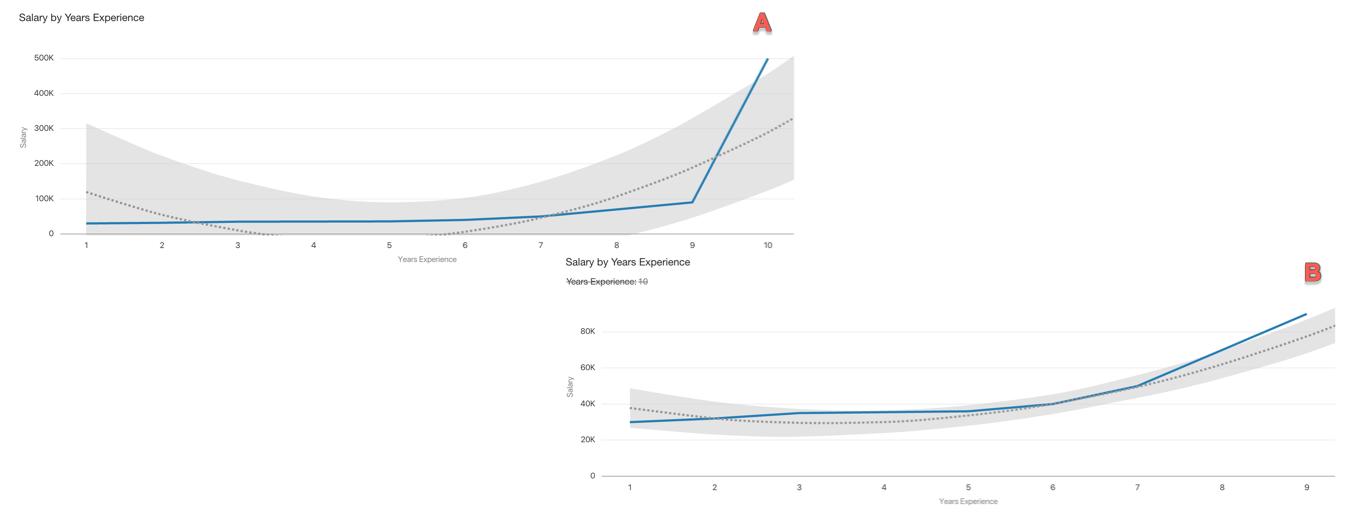
- Handling Outliers: outliers represent corner cases of our dataset. Is the CIO salary relevant in our dataset if we are trying to predict a person salary based on the years of experience in the company? Well, probably not since the CIO salary will be far away from any other salary. The images below show the same predictive model: trying to fit all salaries including the CIO one (10 Years Experience) in A, and excluding the CIO salary in B. We can clearly see that excluding the corner case in our dataset improves the fitting of our predicting model.
- Feature Scaling: Some of the predictive models in data science try to optimise the Euclidean distance (the distance between the predicted points and the actual points). If we have features on different scales (e.g. the number of bedrooms in a house and house price) those models will try to optimise much better the feature having a larger scale since the Euclidean distance gain will be much higher than when optimising the feature having a smaller scale.
- Aggregations: most of the times the dataset we'll face with will have a different granularity to the one we intend to work with, just imagine working with a website clickstream trying to predict customer buying. Probably we'll want to aggregate the clickstream at session or user level and count the number of clicks, the time within the session or between sessions.
- Train/Test Split: it's very important to test our prediction against unseen data in order to avoid overfitting. The dataset division in train/test can be done randomly or based on specific columns (Ids, timestamps) depending on the problem we are facing.
How do we perform the above steps with OAC? In the OAC bundle, there is a component called Dataflow (described here), providing ETL capabilities in the same visual platform where we visualize the data.
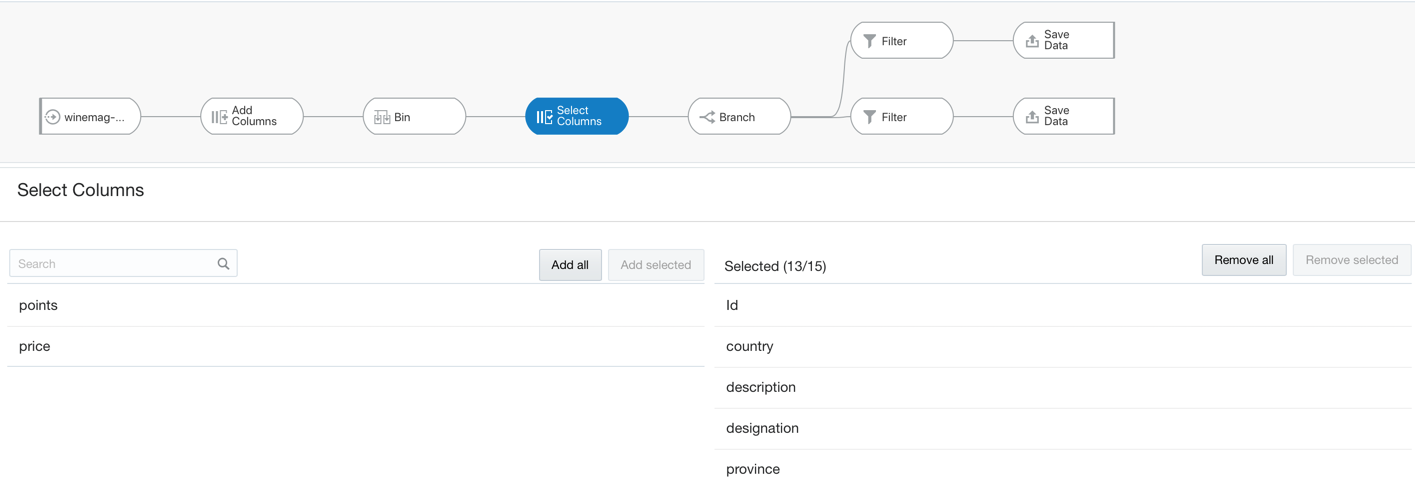
DataFlows provides a variety of steps including:
CASE WHEN...THEN...statements useful to handle missing valuesFILTERSto remove irrelevant observations and outliers and split train and test datasets.COLUMN MANAGEMENTto rename, aggregate, combine, write simple transformations and aggregations useful in features scaling and error corrections.
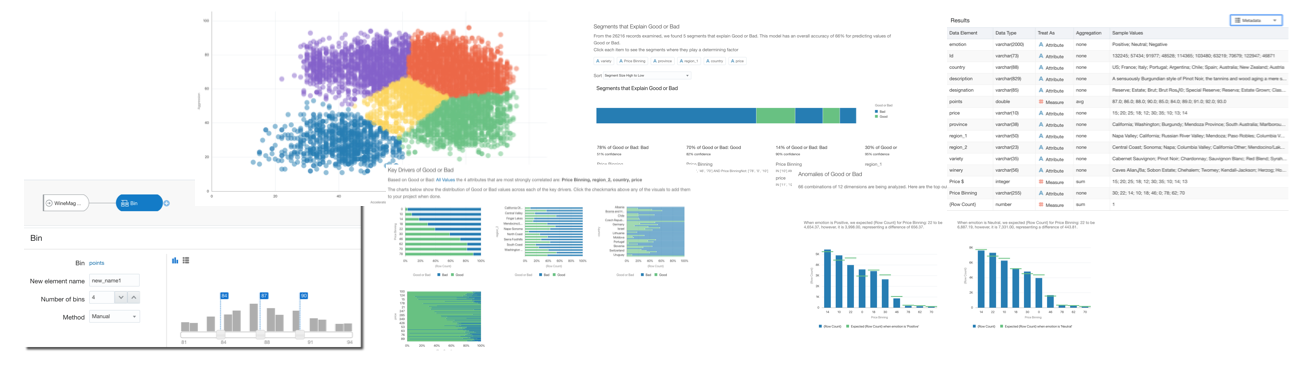
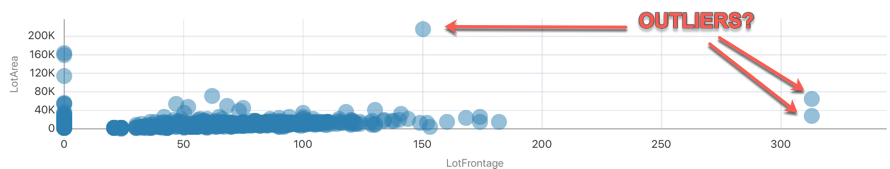
An important topic during the data cleaning is the Outlier Identification for which we have several options with OAC. The basic one is by plotting the data and visually selecting the outliers.
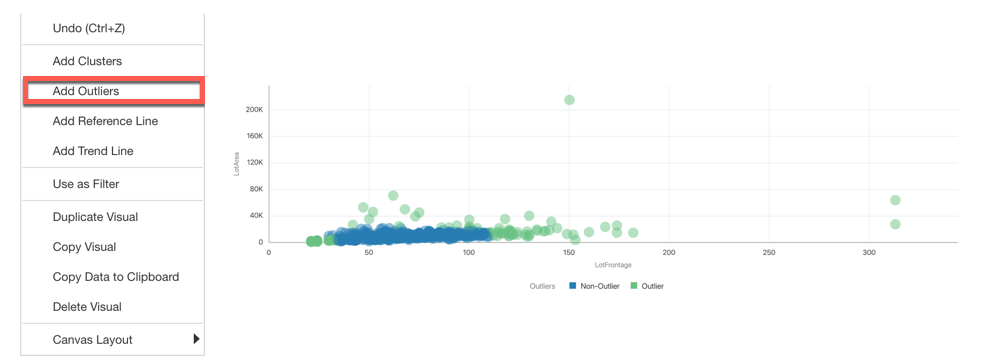
OAC also offers the option to automatically label points a Outliers/Not Outliers.
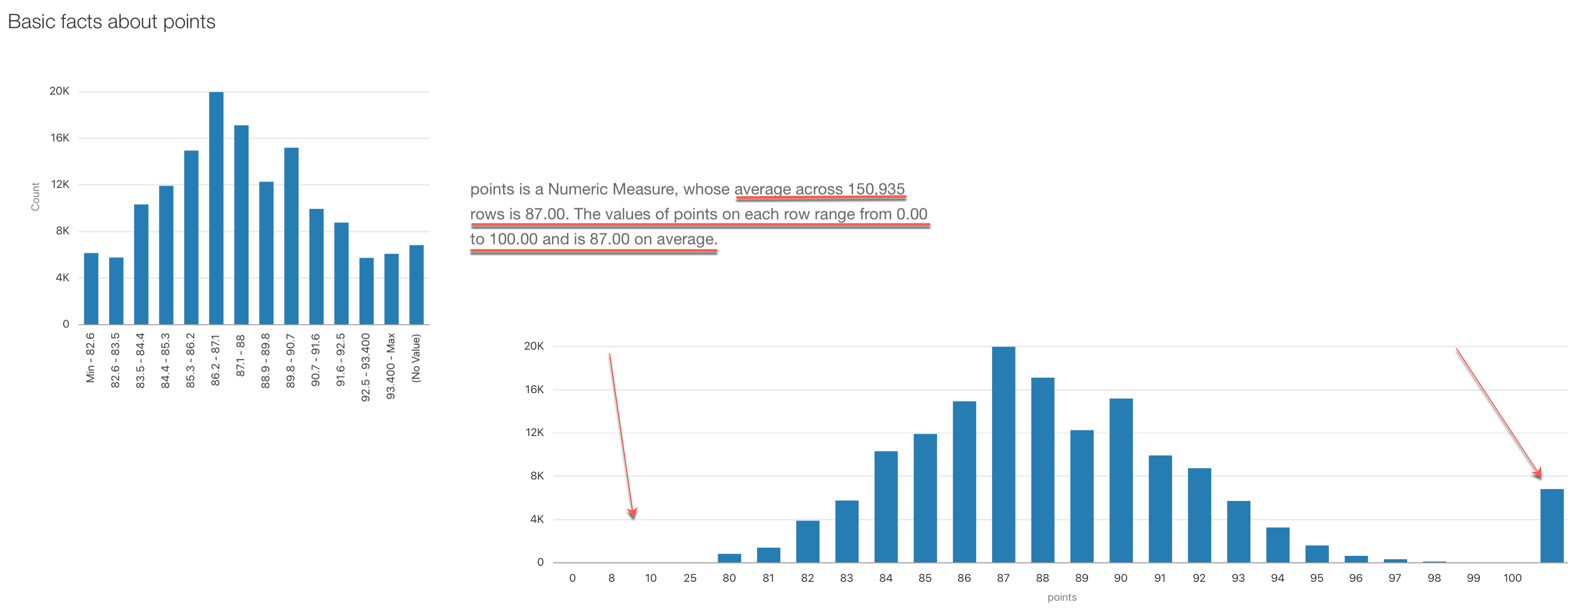
The third option OAC offers is via the Explain option: by selecting any column in the dataset and clicking on Explain OAC, it provides information about the column itself which can be useful for spotting outliers. Like in the example below we can clearly see NULL values (on the right side of the chart) and odd values in the range 0-25 where most of the values are in the range 80-100.
So far we understood how OAC helps out in the first three steps in our data science path: objective definition, data connection and cleaning. Stay tuned for the next blog posts covering feature engineering, model creation & evaluation and prediction!