OBIEE Performance - Why Metrics Matter (and…Announcing obi-metrics-agent v2!)


One of the first steps to improve OBIEE performance is to determine why it is slow. That may sound obvious—can’t fix it if you don’t know what you’re fixing, right? Unfortunately, the “Drunk Man anti-method”, in which we merrily stumble from one change to another, maybe breaking things along the way and certainly having a headache at the end of it, is far too prevalent. This comes about partly through unawareness of a better method to follow, and partly encouraged by tuning documents comprising reams of configuration settings to "tune" and fiddle with without really knowing why or how to prove if they indeed actually fixed anything...
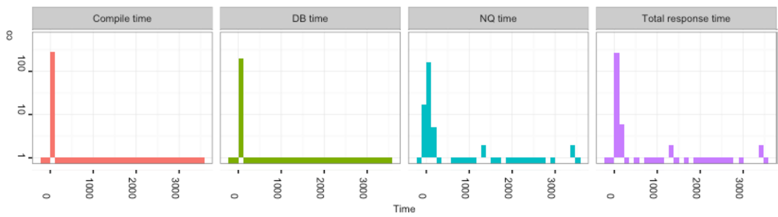
Determining the cause of performance problems is often a case of working out what it’s not just as much as what it is. This is for two important reasons. Firstly, we begin to narrow down the area of focus and analysis. Secondly, we know what to leave alone. If we can prove that, for example, the database is running the query behind a report quickly, then there is no point “tuning” the database, because the problem doesn't lie there. Similarly, if we can see that a report taking 60 seconds in total to run spends 59 seconds of that in the database, fiddling with Java Heap Size settings on OBIEE is going to at the very, very most reduce our total runtime to…59 seconds! This kind of time profiling is important to do, and something that we produce automatically in our Performance Analytics Report:
So, how do we pinpoint what is, or isn’t, going wrong? We need data, and specifically, we need metrics. We need log files, too, maybe for the real nitty-gritty of explain plans, but a huge amount can be understood about a system by looking at the metrics available.
Any modern operating system, from Windows to Linux, AIX to Solaris, will have copious utilities that will expose important metrics such as CPU usage, disk throughout, and so on. These can often be of great assistance in diagnosing performance problems.
OBIEE DMS Metrics
When it comes to OBIEE itself, we are spoilt by the performance counters available that since 11g (and still in 12c) have been exposed through the Dynamic Monitoring System (DMS). They were even there in 10g too, but accessed through JMX. These metrics give us information ranging from things like the number of logged in users, through how many connections are open to a given database, down to real low-level internals like how many threads are in use for handling LDAP lookups. Crucially, there are also metrics showing current and peak levels of queueing within the various internal systems in OBIEE, which is where DMS becomes particularly important.
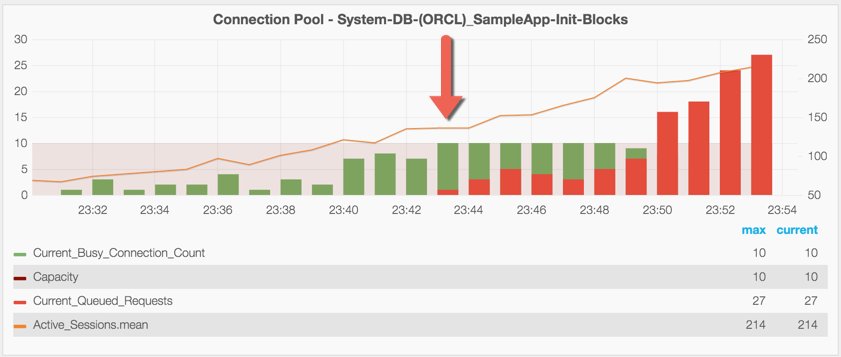
By being able to prove that OBIEE has, for example, run out of available connections to the database, we can confidently state that by changing a given configuration parameter we will alleviate a bottleneck. Not only that, but we can monitor and determine how many connections we really do need at a given workload level. The chart below illustrates this. The capacity of the connection pool is plotted against the number of busy connections. As the number of active sessions increases so does the pressure on the connection pool, until it hits capacity at which point queueing starts—which now means queries are waiting for a connection to the database before they can even begin to execute (and it's at this point we'd expect to see response times suffer).
So this is the kind of valuable information that is just not available anywhere other than the DMS metrics, and you can see from the above illustration just how useful it is. To access DMS metrics in OBIEE 11g and 12c, you have several options available out of the box:
- DMS Spy Servlet
- This includes the very useful (but undocumented) option to pull the metrics out in XML format, by including
format=xmlas a request parameters—thanks to etcSudoers on the #obihackers IRC channel for this gem!
- This includes the very useful (but undocumented) option to pull the metrics out in XML format, by including
- Fusion Middleware Control
- WLST
- opmnctl (not 12c)
- There’s also the paid-for option of the BI Management Pack.
Some of these are useful for programmatically scraping the data, others for interactively checking values at a point in time.
obi-metrics-agent - v2
At Rittman Mead, we always recommend collecting and storing DMS metrics (alongside others, including OS) all the time—not just if you find yourself with performance problems. That way you can compare before and after states, you can track historical trends—and you're all set to hit the ground running with your diagnostics when (if) you do hit performance problems.
You can capture DMS metrics with the BI Management Pack in Enterprise Manager, you can write something yourself, or you can take advantage of an open-source tool from Rittman Mead, obi-metrics-agent.
I wrote about obi-metrics-agent originally when we first open-sourced it almost two years ago. The principle in version 2 is still the same, we’ve just rewritten it in Jython so as to remove the need for any dependencies like Python and associated libraries. We’ve also added native InfluxDB output, as well as retained the option to send data in the original carbon/graphite protocol.
You can run obi-metrics-agent and just write the DMS data to CSV, but our recommendation is always to persist it straight to a time series data store such as InfluxDB. Once you’ve collected the data you can analyse and monitor it with several tools, our favourite being Grafana (read more about this here).
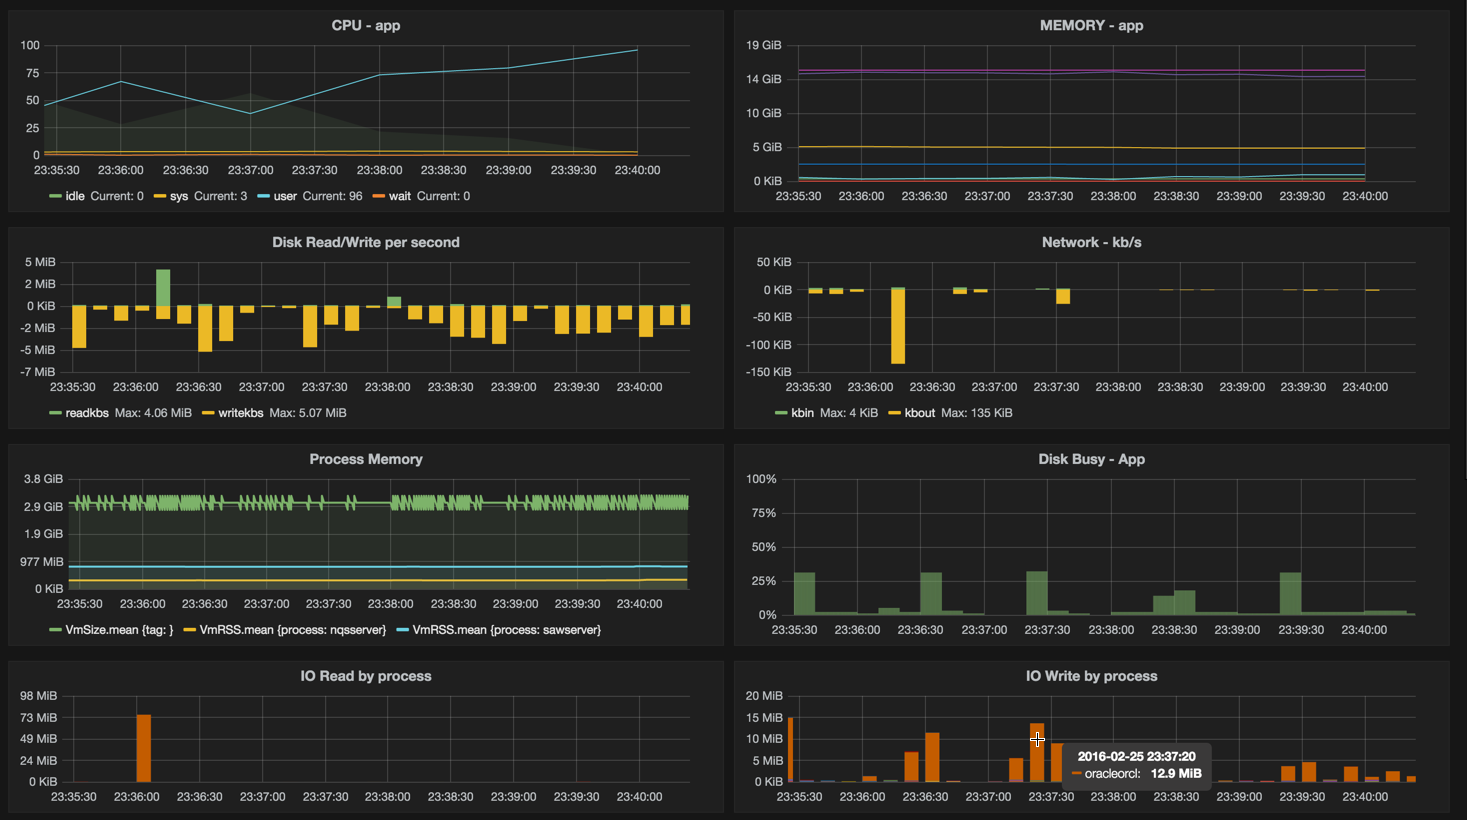
As part of our Performance Analytics Service we’ve built a set of Performance Analytics Dashboards, making available a full-stack view of OBIEE metrics (including DMS, OS, and even Oracle ASH data), as seen in this video here (click on the image to enlarge it):
If you’d like to find out more about these and the Performance Analytics service offered by Rittman Mead, please get in touch. You can download obi-metrics-agent itself freely from our github repository.